Keltner Channels: Complete Trading Strategy Guide
What Are Keltner Channels?
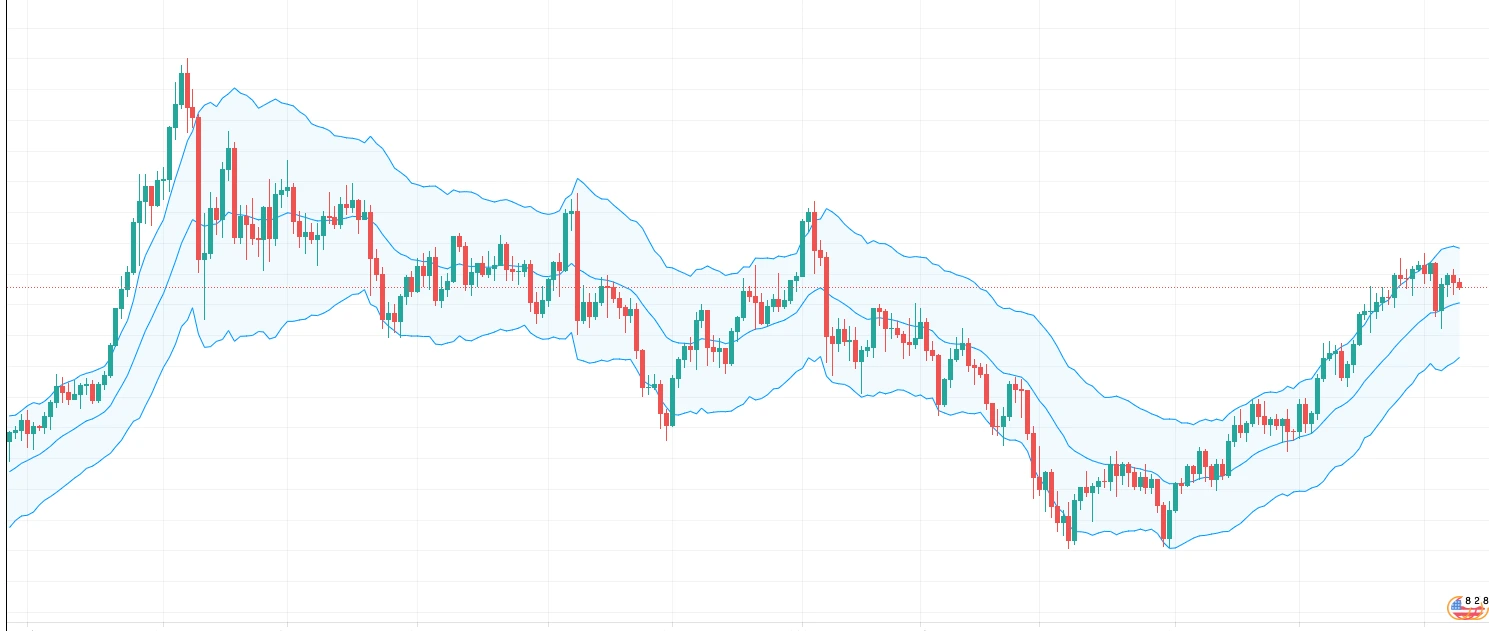
Keltner Channels are a volatility-based technical indicator developed by Chester Keltner in the 1960s and later refined by Linda Raschke. Unlike other channel indicators, Keltner Channels use the Average True Range (ATR) to create dynamic support and resistance levels around a moving average. This makes them particularly effective for trend identification and breakout trading strategies.
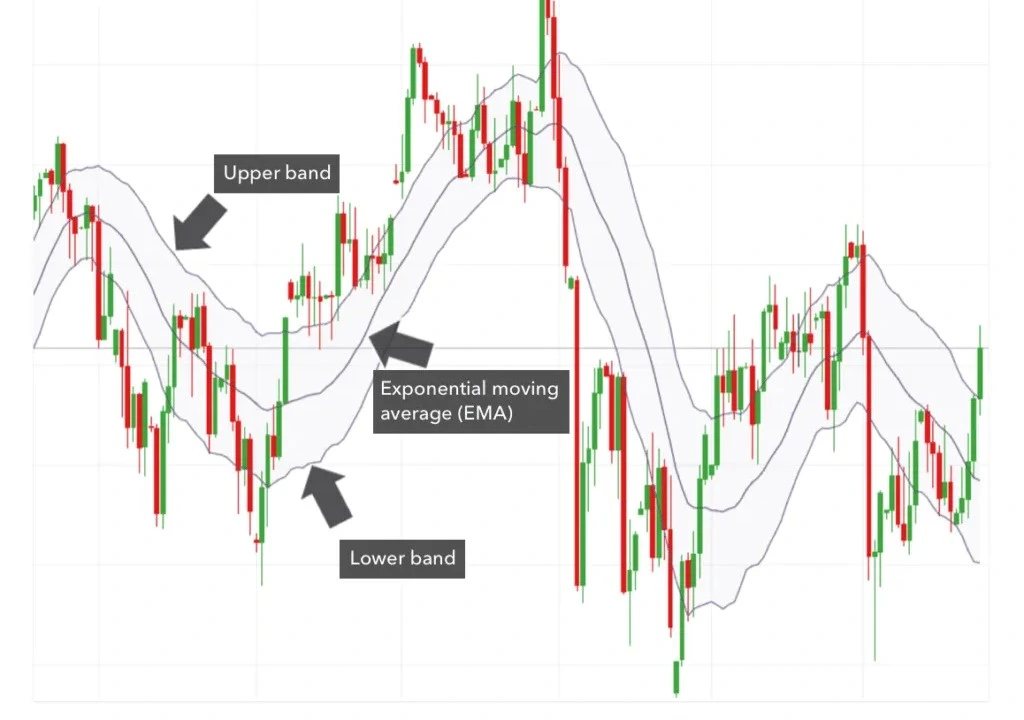
The indicator consists of three lines plotted on a price chart:
- Middle Line: Typically a 20-period Exponential Moving Average (EMA)
- Upper Channel: Middle line + (ATR × Multiplier)
- Lower Channel: Middle line - (ATR × Multiplier)
What sets Keltner Channels apart from other indicators like Bollinger Bands is their use of ATR rather than standard deviation. This creates smoother, more consistent channels that are less susceptible to sudden price spikes, making them ideal for trend-following strategies in volatile markets.
Keltner Channels Formula and Calculation
Understanding the Keltner Channels formula is crucial for mastering this powerful trading tool. The calculation involves three key components:
1. Middle Line (Exponential Moving Average):
EMA = (Price × Multiplier) + (Previous EMA × (1 - Multiplier))
Where Multiplier = 2 / (Period + 1), typically using 20 periods
2. Average True Range (ATR):
TR = Max[(High - Low), |High - Closeprev|, |Low - Closeprev|]
ATR = EMA of TR over specified period (typically 10 periods)
ATR measures market volatility over time
3. Channel Lines:
Upper Channel = EMA + (ATR × 2.0)
Lower Channel = EMA - (ATR × 2.0)
Standard multiplier is 2.0, but can be adjusted for different market conditions
The ATR component is what makes Keltner Channels unique. By using average true range instead of standard deviation, the channels adapt more smoothly to changing market volatility, providing cleaner signals for trend-following strategies.
Key Differences: Keltner Channels vs Bollinger Bands
While both indicators create channels around price action, their calculation methods produce significantly different signals:
| Feature | Keltner Channels | Bollinger Bands |
|---|---|---|
| Calculation Base | Average True Range (ATR) | Standard Deviation |
| Sensitivity | Smoother, less reactive | More reactive to price changes |
| Best Use | Trend following, breakouts | Mean reversion, volatility |
| Moving Average | Exponential Moving Average | Simple Moving Average |
How to Interpret Keltner Channels
1. Trend Identification
The direction of the Keltner Channels reveals the underlying trend:
- Upward sloping channels: Indicate a bullish trend
- Downward sloping channels: Indicate a bearish trend
- Horizontal channels: Suggest sideways market conditions
2. Volatility Measurement
The width between the upper and lower channels indicates market volatility:
- Wide channels: High volatility, stronger trending conditions
- Narrow channels: Low volatility, potential for breakout
- Expanding channels: Increasing volatility, trend acceleration
- Contracting channels: Decreasing volatility, trend deceleration
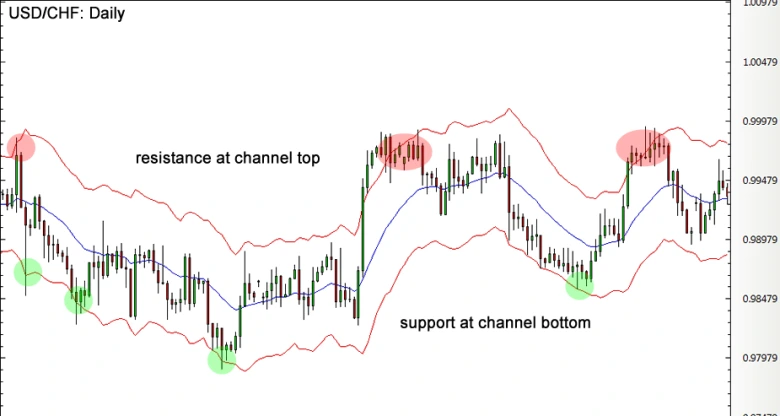
3. Dynamic Support and Resistance
Keltner Channels provide dynamic support and resistance levels that adjust with market conditions:
- Upper channel: Acts as dynamic resistance in uptrends
- Lower channel: Acts as dynamic support in downtrends
- Middle line (EMA): Provides support/resistance during pullbacks
Keltner Channels Trading Strategies
1. Breakout Trading Strategy
This is the most popular and effective strategy for Keltner Channels:
Bullish Breakout Setup:
- Wait for price to close above the upper Keltner Channel
- Confirm with increased volume on the breakout
- Enter long position on the next candle
- Set stop loss below the middle EMA line
- Target profit at 2-3x the risk amount
Bearish Breakout Setup:
- Wait for price to close below the lower Keltner Channel
- Confirm with increased volume on the breakdown
- Enter short position on the next candle
- Set stop loss above the middle EMA line
- Target profit at 2-3x the risk amount
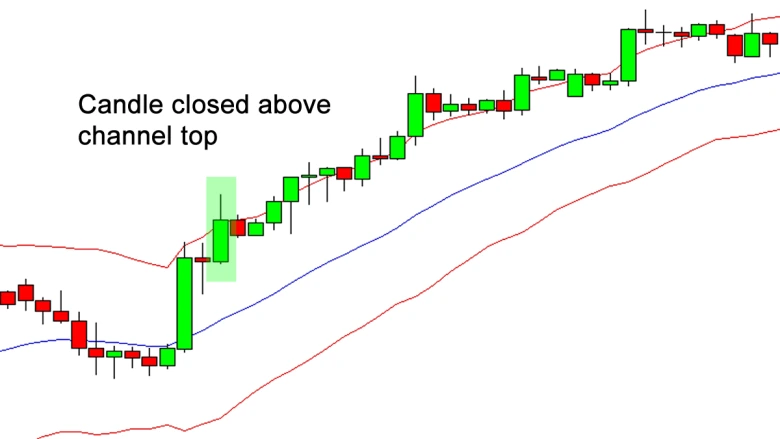
Bullish Breakout Example
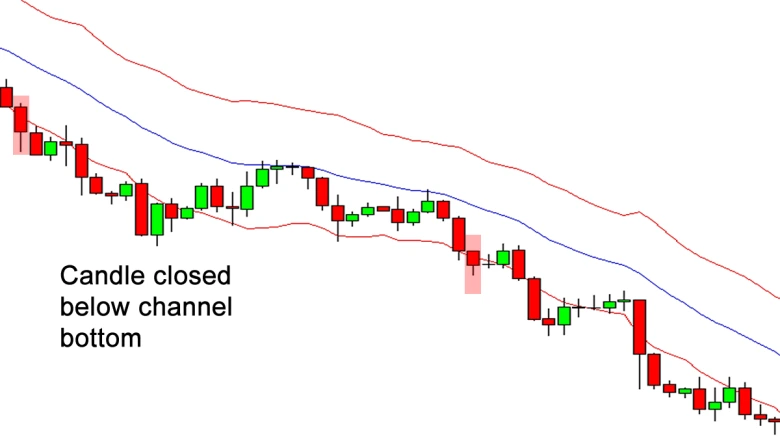
Bearish Breakout Example
2. Trend Following Strategy
Use Keltner Channels to enter trending markets on pullbacks:
- In uptrends: Buy when price pulls back to the middle EMA and shows signs of bouncing
- In downtrends: Sell when price rallies to the middle EMA and shows signs of rejection
- Risk management: Place stops outside the opposite channel line
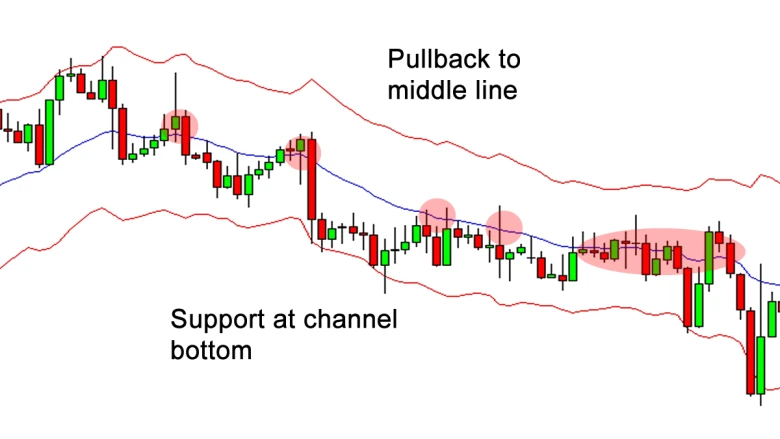
Support and Pullback Example
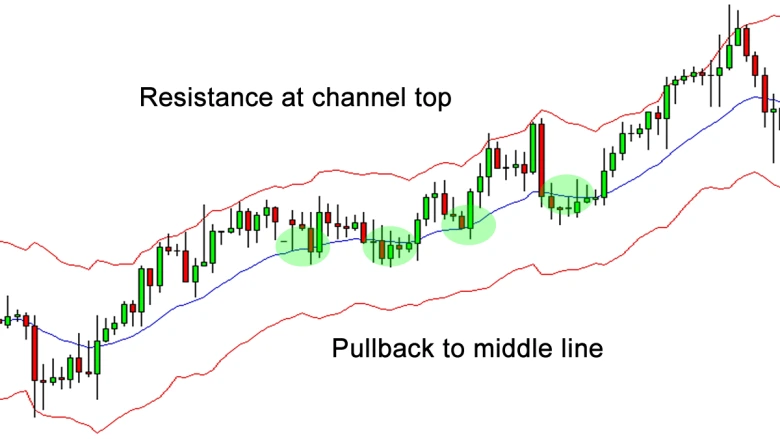
Resistance and Pullback Example
3. Range Trading Strategy
During sideways markets, use the channels as traditional support and resistance:
- Buy near the lower channel with targets at the upper channel
- Sell near the upper channel with targets at the lower channel
- Exit strategy when channels start to slope (trend emerging)
Optimal Keltner Channels Settings
The effectiveness of Keltner Channels depends heavily on using appropriate settings for your trading style and market conditions:
Standard Settings
- EMA Period: 20 (good balance between responsiveness and smoothness)
- ATR Period: 10 (captures recent volatility changes)
- ATR Multiplier: 2.0 (standard setting for most markets)
Custom Settings by Trading Style
| Trading Style | EMA Period | ATR Period | Multiplier |
|---|---|---|---|
| Day Trading | 10-15 | 5-10 | 1.5-2.0 |
| Swing Trading | 20-30 | 10-14 | 2.0-2.5 |
| Position Trading | 50-100 | 20-30 | 2.5-3.0 |
Advanced Keltner Channels Techniques
1. Multiple Timeframe Analysis
Combine Keltner Channels from different timeframes for stronger signals:
- Use higher timeframe (daily) for trend direction
- Use lower timeframe (4-hour) for precise entry points
- Look for alignment between timeframes for high-probability trades
2. Volume Confirmation
Enhance Keltner Channels signals with volume analysis:
- Breakouts with high volume: More likely to continue
- Breakouts with low volume: Higher probability of false signals
- Volume spikes at channel touches: Confirm reversal potential
3. Combining with Other Indicators
Keltner Channels work well with complementary indicators:
- RSI: Confirm overbought/oversold conditions at channel extremes
- MACD: Validate trend direction and momentum
- Support/Resistance levels: Additional confirmation for breakouts
Risk Management with Keltner Channels
Proper risk management is crucial when trading with Keltner Channels:
Stop Loss Placement
- Breakout trades: Place stops outside the opposite channel line
- Pullback trades: Place stops beyond the channel boundary
- Dynamic stops: Trail stops along the middle EMA in trending markets
Position Sizing
- Adjust position size based on channel width (volatility)
- Smaller positions during high volatility (wide channels)
- Larger positions during low volatility (narrow channels)
Trade Management
- Take partial profits at channel boundaries
- Trail stops to protect gains in trending markets
- Exit if price fails to reach channel targets
Common Mistakes and How to Avoid Them
⚠️ Common Pitfalls:
- Trading every breakout: Not all breakouts are significant - wait for volume confirmation
- Ignoring trend context: Counter-trend trades have lower success rates
- Wrong settings: Using default settings for all markets without optimization
- No stop losses: Keltner Channels provide natural stop loss levels - use them
- Overtrading: Quality over quantity - wait for clear setups
Keltner Channels in Different Markets
Forex Markets
- Work best on major currency pairs (EUR/USD, GBP/USD)
- Adjust multiplier for currency-specific volatility
- Consider session-based volatility patterns
Stock Markets
- Effective on trending stocks with good liquidity
- Combine with fundamental analysis for best results
- Consider sector rotation and market conditions
Cryptocurrency Markets
- Increase ATR multiplier due to higher volatility
- Use shorter EMA periods for faster-moving markets
- Be cautious of sudden news-driven volatility spikes
Conclusion: Mastering Keltner Channels
Keltner Channels offer traders a powerful and versatile tool for identifying trends, timing entries, and managing risk. Their unique use of Average True Range creates smoother, more reliable signals compared to other channel indicators, making them particularly effective for trend-following strategies and breakout trading.
The key to success with Keltner Channels lies in:
- Understanding the underlying calculation and how ATR affects channel behavior
- Adapting settings to match your trading style and market conditions
- Combining with volume and other technical indicators for confirmation
- Implementing proper risk management using the natural stop loss levels provided
- Practicing patience and waiting for high-quality setups rather than trading every signal
Whether you're a day trader looking for quick breakout opportunities or a swing trader seeking to ride medium-term trends, Keltner Channels can provide the structure and discipline needed for consistent trading success. Remember to backtest any strategy thoroughly and always practice proper risk management in your trading endeavors.