Technical Analysis
Master chart patterns, indicators, and technical tools to identify high-probability trading opportunities in any market condition.
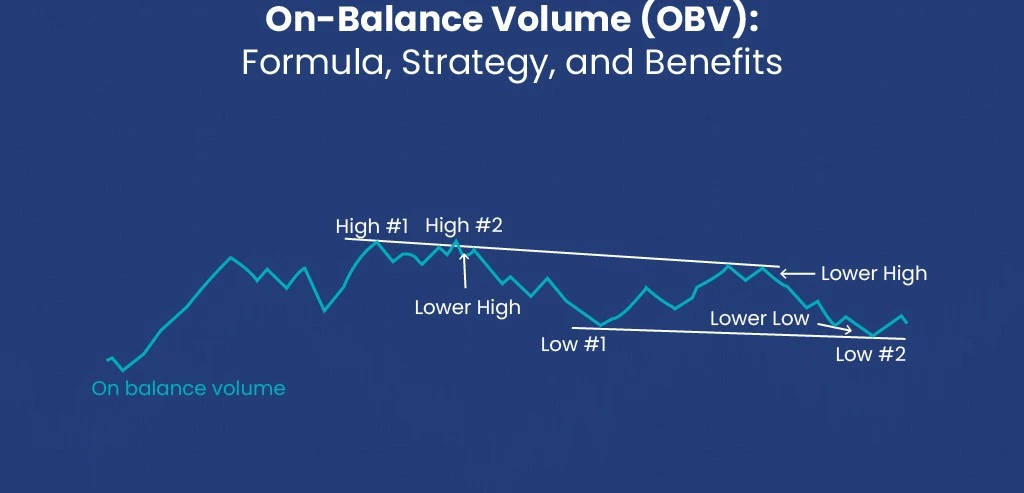
On-Balance Volume (OBV): Smart Money Flow Analysis
Master the On-Balance Volume indicator to track institutional money flow, identify divergences, and predict price movements.
Read article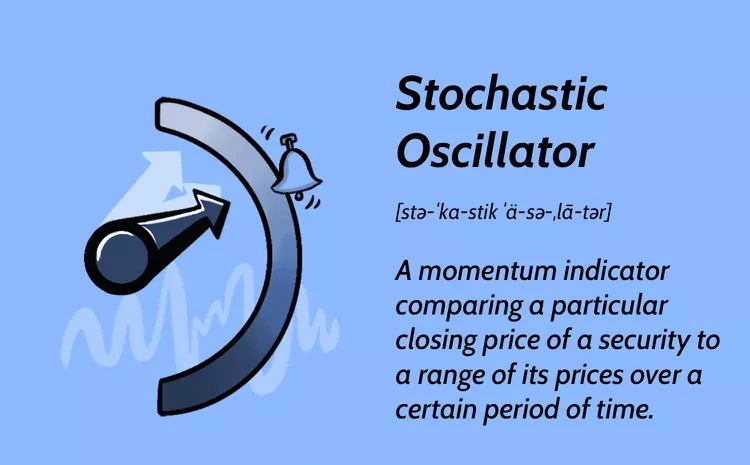
Stochastic Oscillator: Complete Trading Guide
Master the Stochastic Oscillator to identify overbought/oversold conditions, divergences, and high-probability trading signals.
Read article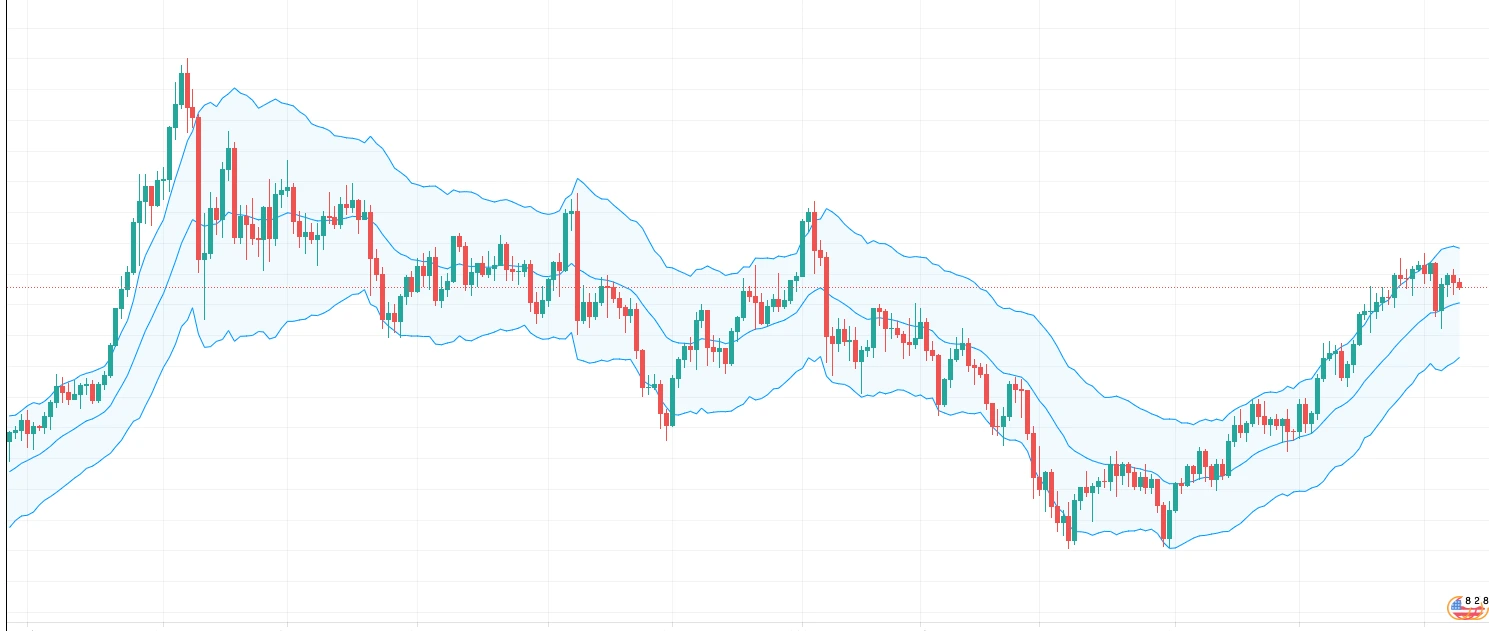
Keltner Channels: The Complete Guide
Learn how to use the Keltner Channels indicator to identify potential entry and exit points in trending markets.
Read article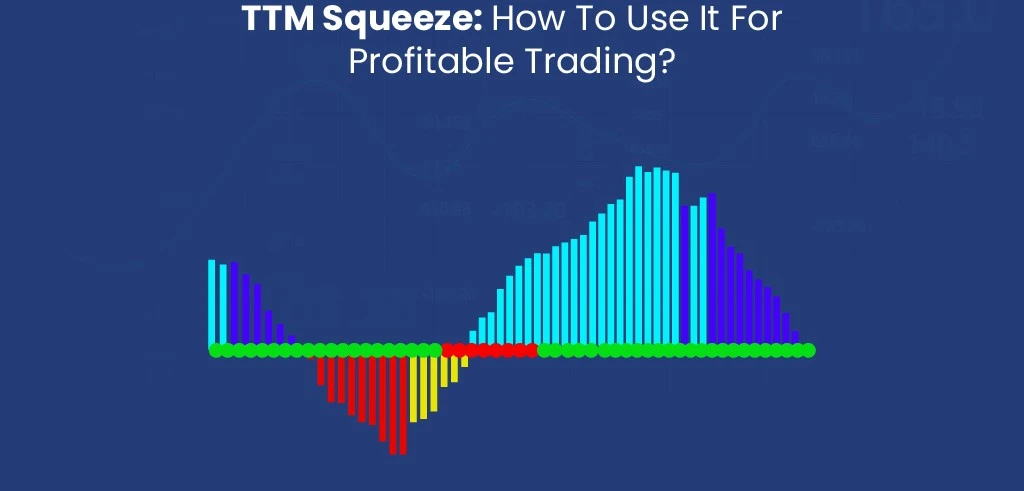
TTM Squeeze: The Complete Guide
Learn how to use the TTM Squeeze indicator to identify potential entry and exit points in trending markets.
Read article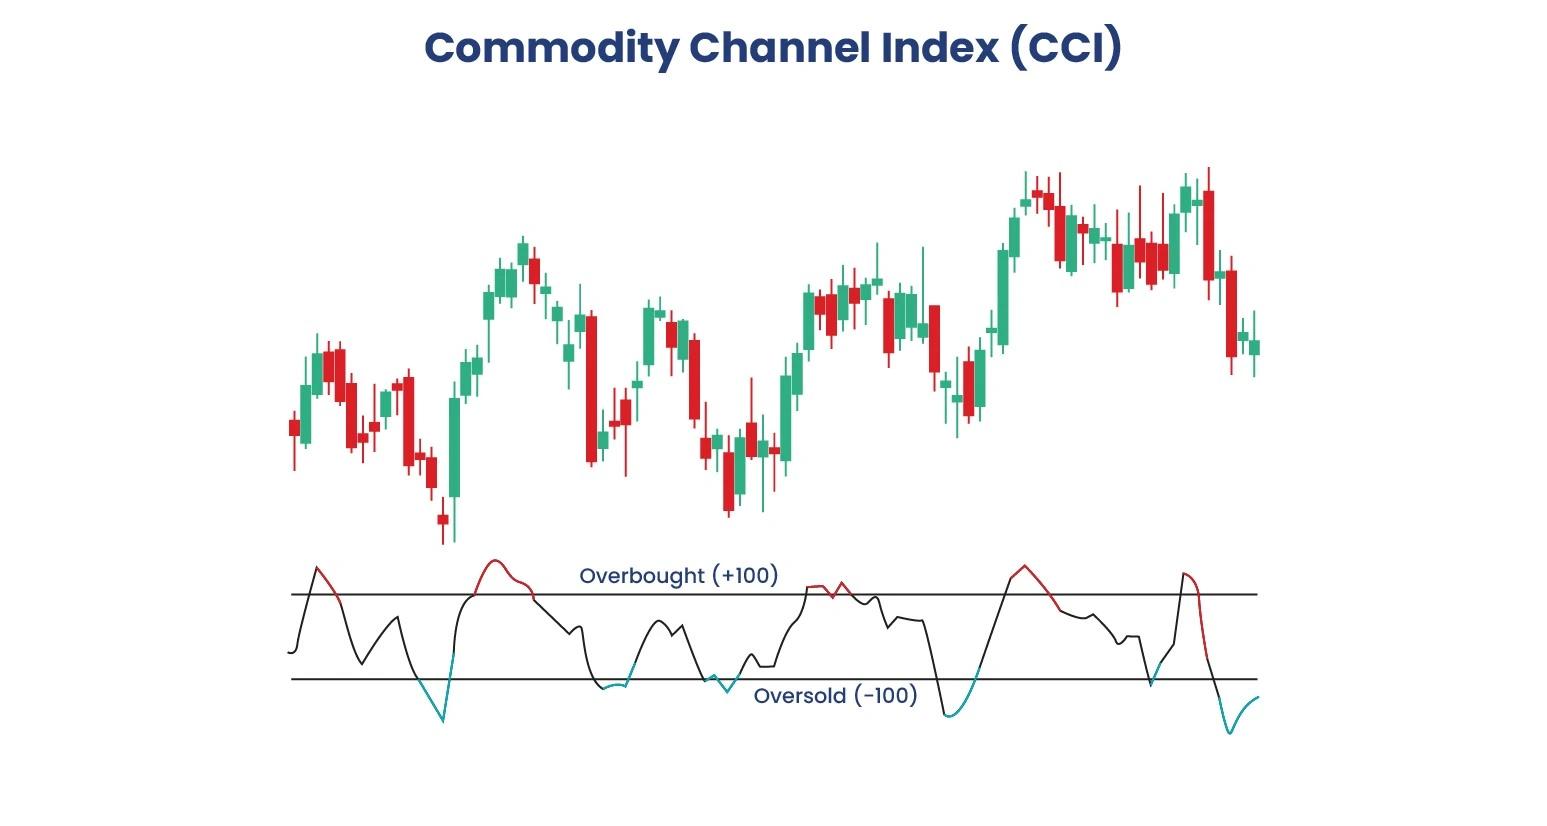
Commodity Channel Index (CCI) Explained
Learn how to use the CCI indicator to identify potential entry and exit points in trending markets.
Read article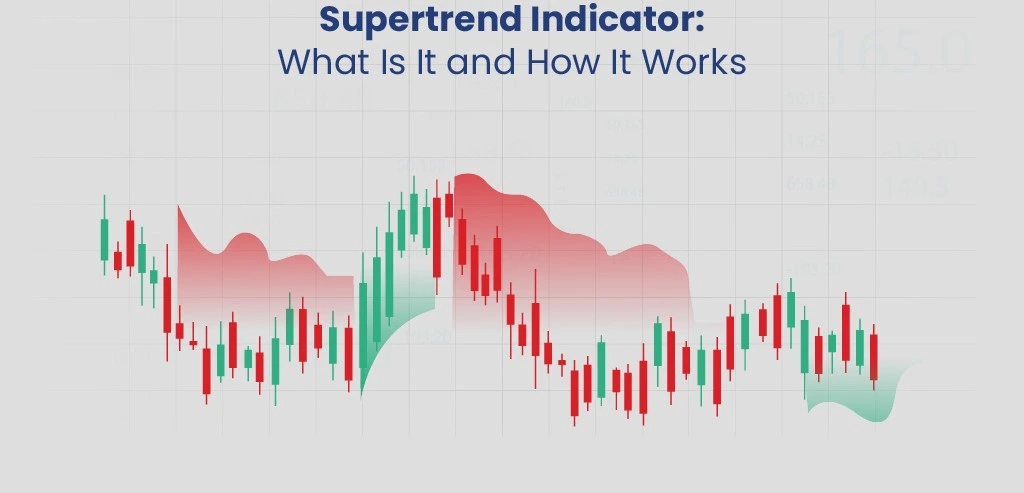
Supertrend: The Complete Guide
Learn how to use the Supertrend indicator to identify potential entry and exit points in trending markets.
Read articleWhat is Technical Analysis? An In-Depth Look
Technical analysis is a cornerstone methodology used in financial markets to forecast future price movements and identify potential trading opportunities, particularly common in short-term analysis like forex and commodity trading. Unlike fundamental analysis, which delves into a company's financial health or macroeconomic factors, technical analysis focuses exclusively on the analysis of historical market data, primarily price charts and trading volume. The core premise is that all known information is already reflected in the price, and that price movements tend to follow identifiable patterns and trends over time.
Its roots trace back to the Dow Theory developed by Charles Dow in the late 1800s and Japanese candlestick charting techniques originating even earlier. Modern technical analysis builds upon these foundations, incorporating statistical methods and computational power.
Traders utilize a diverse toolkit within technical analysis. This includes studying various chart patterns (like head and shoulders, triangles, or flags) which can signal potential reversals or continuations, and applying mathematical trading indicators (such as Moving Averages, RSI, MACD, or Fibonacci retracements) to gauge momentum, volatility, and potential overbought or oversold conditions. Analyzing volume alongside price action is also critical, as it helps confirm the strength or weakness of a trend or pattern.
Key Tools and Concepts
Several core concepts form the basis of technical chart analysis:
- Support and Resistance: These are key price levels where buying (support) or selling (resistance) pressure has historically emerged, often halting or reversing price trends. They are identified by looking at past price peaks (resistance) and troughs (support) or areas of price consolidation.
- Trends, Trendlines, and Channels: Prices tend to move in trends (up, down, or sideways). Trendlines connect successive higher lows (in an uptrend) or lower highs (in a downtrend) to visualize the trend's slope and potential reversal points. Channels are formed by adding a parallel line to a trendline, outlining the range within which the price is trending.
- Moving Averages (MAs): These smooth out price data to create a single flowing line, making it easier to identify the underlying trend direction. Crossovers between different MAs (e.g., 50-day vs. 200-day) are often used as buy or sell signals.
- Indicators and Oscillators: These are calculations based on price and/or volume data, often plotted below the price chart. Oscillators like the Relative Strength Index (RSI) or Stochastic Oscillator help identify overbought or oversold conditions and potential momentum shifts. Indicators like MACD (Moving Average Convergence Divergence) help gauge trend strength and potential reversals.
- Volume Analysis: Trading volume represents the number of shares or contracts traded over a period. High volume during a price move confirms the trend's strength, while low volume can indicate weakness or lack of conviction.
The Foundational Pillars of Technical Analysis
The practice of technical analysis rests on three widely accepted beliefs:
- The Market Discounts Everything: This pillar suggests that all relevant information (fundamental factors, economic news, political events, and market sentiment) is already incorporated into the current market price. Therefore, analyzing the price action itself is sufficient.
- Prices Move in Trends: Technical analysts believe that price movements are not random but follow directional trends (uptrends, downtrends, or sideways ranges) that tend to persist until a clear reversal occurs. Identifying these trends is a primary goal.
- History Repeats Itself: This principle is rooted in market psychology. Because human behavior is relatively consistent, traders tend to react similarly to comparable market situations, leading to recurring and predictable chart patterns that have been observed over decades of market data.
Strengths and Limitations
Technical analysis offers several advantages, but also comes with limitations:
Strengths:
- Focus on Price: It directly analyzes what the market is doing (price and volume), which ultimately determines profit or loss.
- Universality: Can be applied to any tradable asset (stocks, forex, crypto, commodities) across any timeframe.
- Entry/Exit Timing: Helps identify potential entry and exit points based on support, resistance, breakouts, and indicator signals, aiding risk management.
- Visual History: Charts provide an easily digestible history of price action, volatility, and trading levels.
Limitations:
- Subjectivity: Chart pattern identification and indicator interpretation can be subjective and vary between analysts (analyst bias).
- Lagging Nature: Many indicators are derived from past price data, meaning they often lag behind current price action, potentially leading to late signals.
- Self-Fulfilling Prophecy: Widespread use of certain tools (like major moving averages or Fibonacci levels) can cause prices to react at those levels simply because many traders place orders there.
- Doesn't Predict Fundamentals: Cannot predict unexpected news events (e.g., earnings surprises, geopolitical events) that can drastically alter prices irrespective of technical patterns.
- Can Generate False Signals: No indicator or pattern is perfect; false breakouts and misleading signals are common, especially in choppy or non-trending markets.
Many traders combine technical analysis with fundamental analysis or other methods to get a more holistic view. Skilled technical analysts understand these limitations and use multiple tools in confluence, alongside robust risk management, to make trading decisions.
By systematically applying these principles and tools, traders aim to develop effective trading strategies. Mastering technical analysis enables informed decision-making regarding entry points, exit points, and risk management (e.g., setting stop-loss orders). Whether applied to forex trading, stock trading, cryptocurrency trading, or commodities, technical analysis provides a structured framework for navigating the complexities of financial markets and improving the probability of trading success.
Related Trading Topics
Price Action Trading
Learn to trade using pure price movements without relying on complex indicators. Master the art of reading the market directly from the charts.
Explore Price ActionTrading Psychology
Develop the right mindset for consistent trading success. Learn to manage emotions, build discipline, and overcome psychological barriers.
Explore Trading PsychologyApply Technical Analysis in Your Trading
Our premium indicators are designed to implement technical analysis concepts automatically, helping you identify key patterns, levels, and signals without manual calculations.
Explore Our Indicators