TTM Squeeze: Master the Complete Trading Strategy Guide
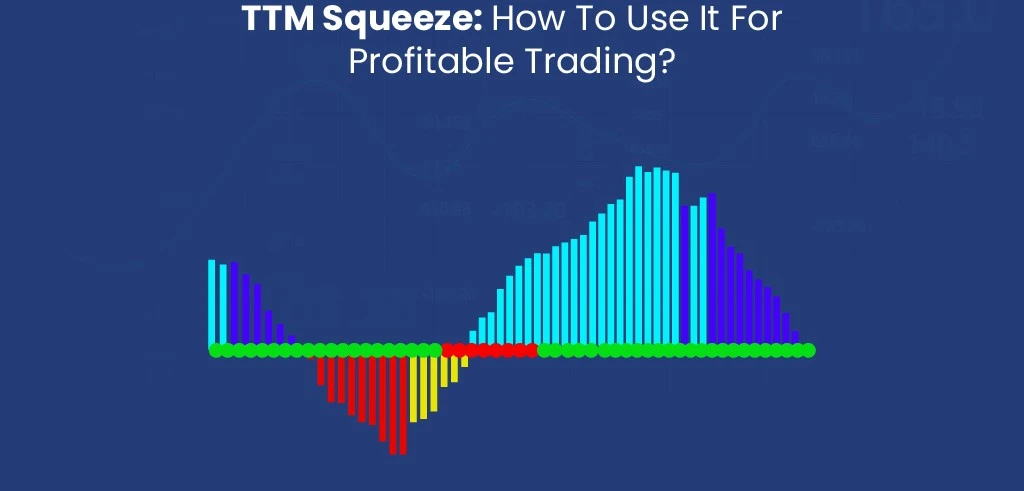
What is the TTM Squeeze Indicator?
The TTM Squeeze is a powerful volatility and momentum indicator developed by John Carter of Trade the Markets (now Simpler Trading). This innovative tool combines Bollinger Bands, Keltner Channels, and a momentum oscillator to identify periods of low volatility that typically precede explosive price movements. The indicator is specifically designed to help traders capitalize on the market's tendency to experience significant moves after periods of compression.
What makes the TTM Squeeze unique is its ability to identify when the market is “coiled” like a spring, ready to explode in either direction. According to John Carter's analysis, markets spend approximately 80% of their time in consolidation and only 20% in trending moves. The TTM Squeeze helps traders position themselves before these explosive moves occur, rather than chasing them after they've already begun.
💡 Key Insight:
The TTM Squeeze indicator earned John Carter a 1,270% annualized return in 2020, demonstrating its effectiveness in identifying high-probability trading opportunities during volatile market conditions.
How the TTM Squeeze Works: The Three Components
The TTM Squeeze indicator consists of three key components that work together to identify compression and expansion phases in the market:
1. Bollinger Bands
Bollinger Bands measure volatility using standard deviation around a moving average. In the TTM Squeeze, they typically use a 20-period simple moving average with 2.0 standard deviations. When volatility decreases, the bands contract toward the center line.
2. Keltner Channels
Keltner Channels use the Average True Range (ATR) to create upper and lower boundaries around an exponential moving average. The standard setting uses a 20-period EMA with 1.5 times the ATR. These channels respond differently to volatility changes compared to Bollinger Bands.
3. Momentum Oscillator
The momentum oscillator is displayed as a histogram that oscillates around a zero line. It provides crucial information about the likely direction of the breakout when the squeeze fires. The momentum is calculated using a linear regression slope of the closing prices.
TTM Squeeze Formula Components:
Bollinger Bands = SMA(20) ± (2 × Standard Deviation)
Keltner Channels = EMA(20) ± (1.5 × ATR(20))
Momentum = Linear Regression Slope of Close Prices
Red Dots: Bollinger Bands inside Keltner Channels (Squeeze On)
Green Dots: Bollinger Bands outside Keltner Channels (Squeeze Off)
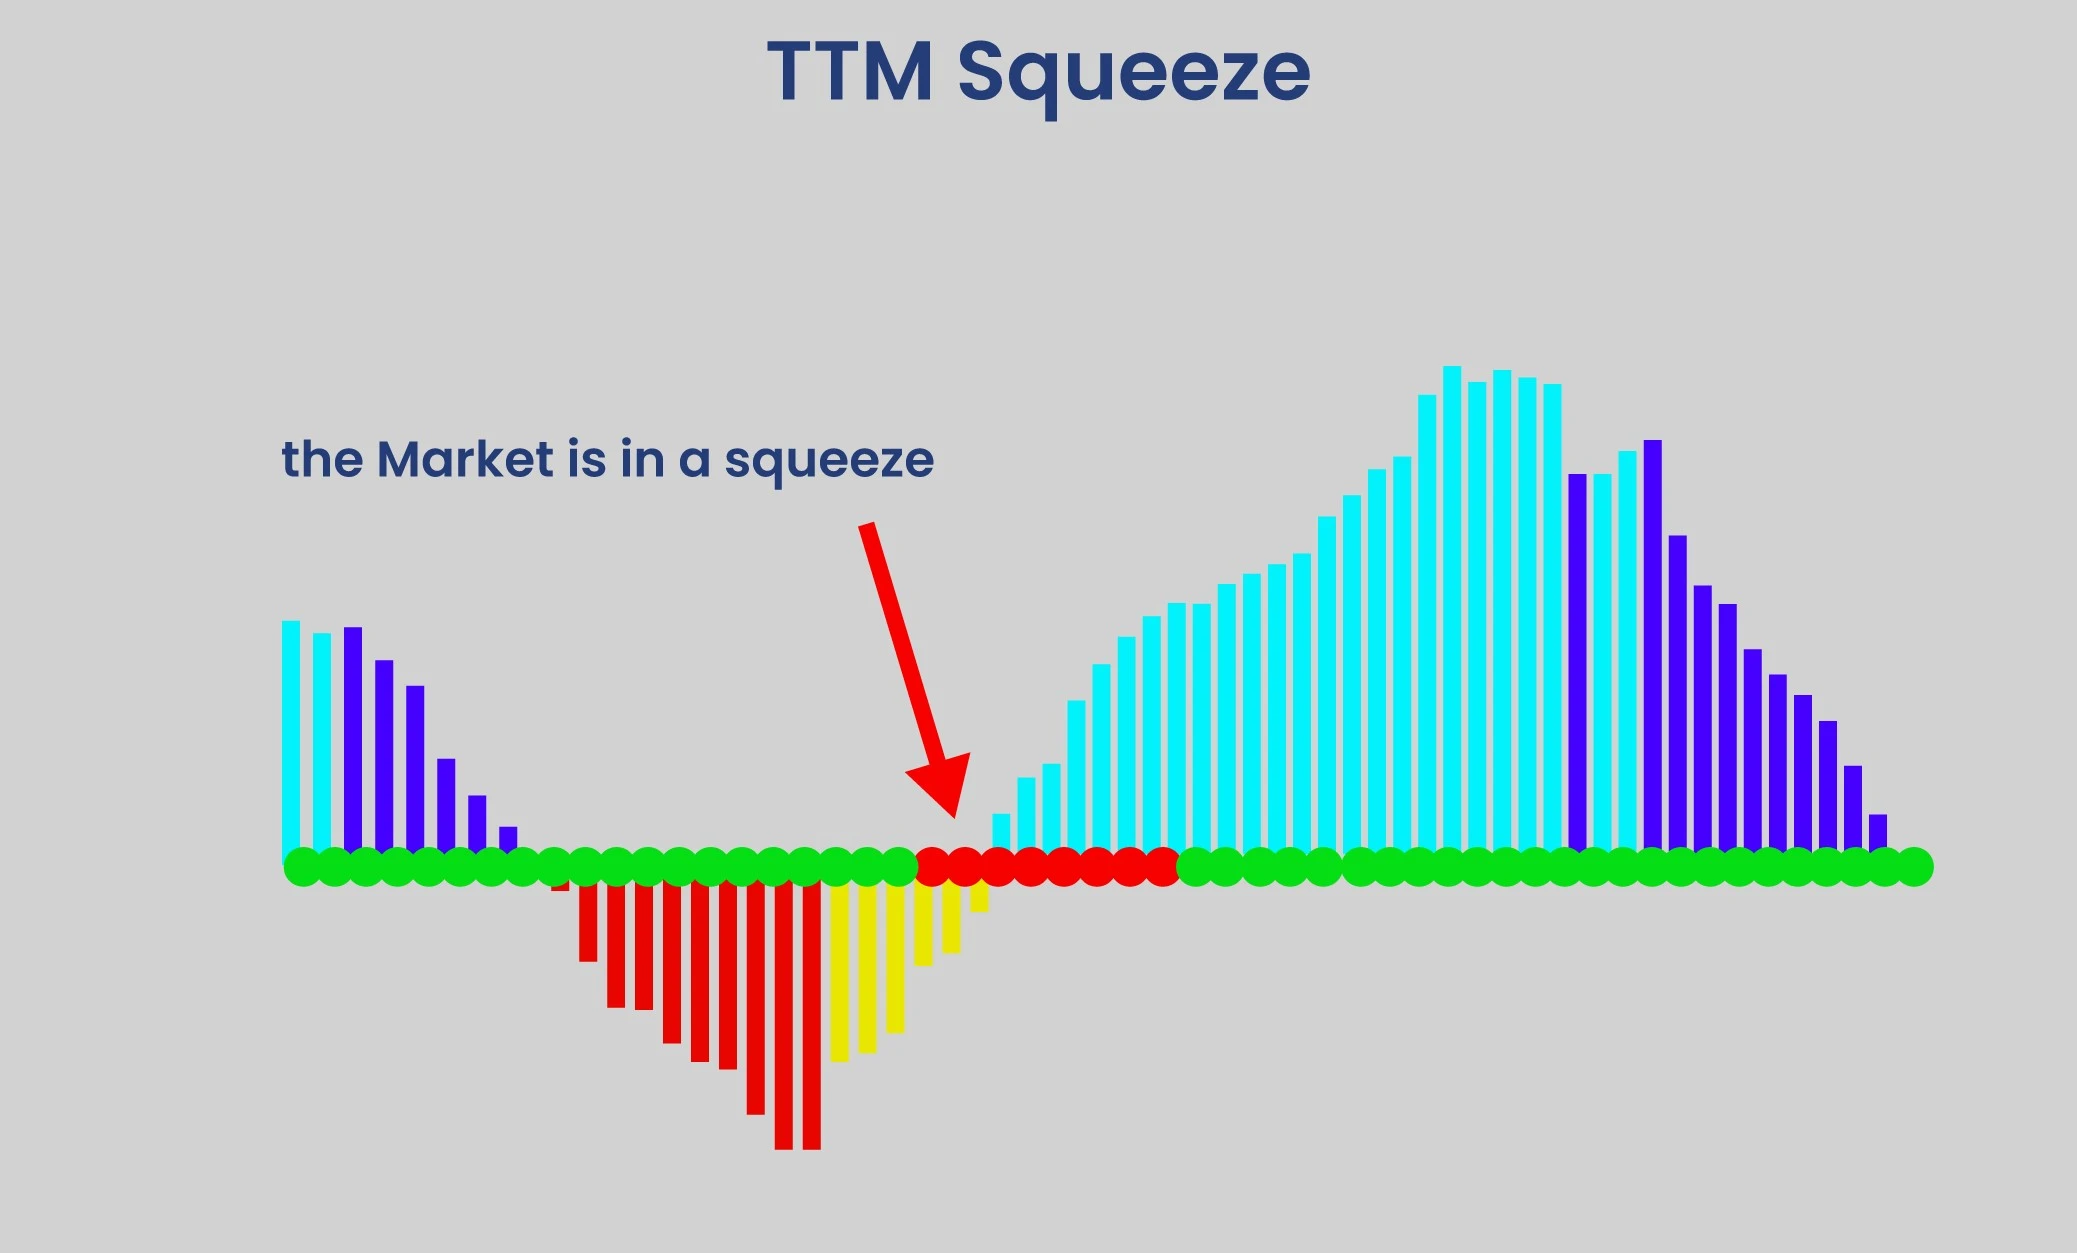
Reading TTM Squeeze Signals: Dots and Momentum
Understanding the Squeeze Dots
The colored dots along the zero line are the heart of the TTM Squeeze indicator:
- Red Dots: Indicate the squeeze is ON - Bollinger Bands are inside the Keltner Channels, showing low volatility and building pressure
- Green Dots: Indicate the squeeze is OFF - Bollinger Bands have expanded outside the Keltner Channels, signaling the start of a potentially explosive move
The transition from red to green dots (the “squeeze fire”) is the primary signal that traders watch for. This transition typically occurs when market volatility increases and price begins to break out of its consolidation range.
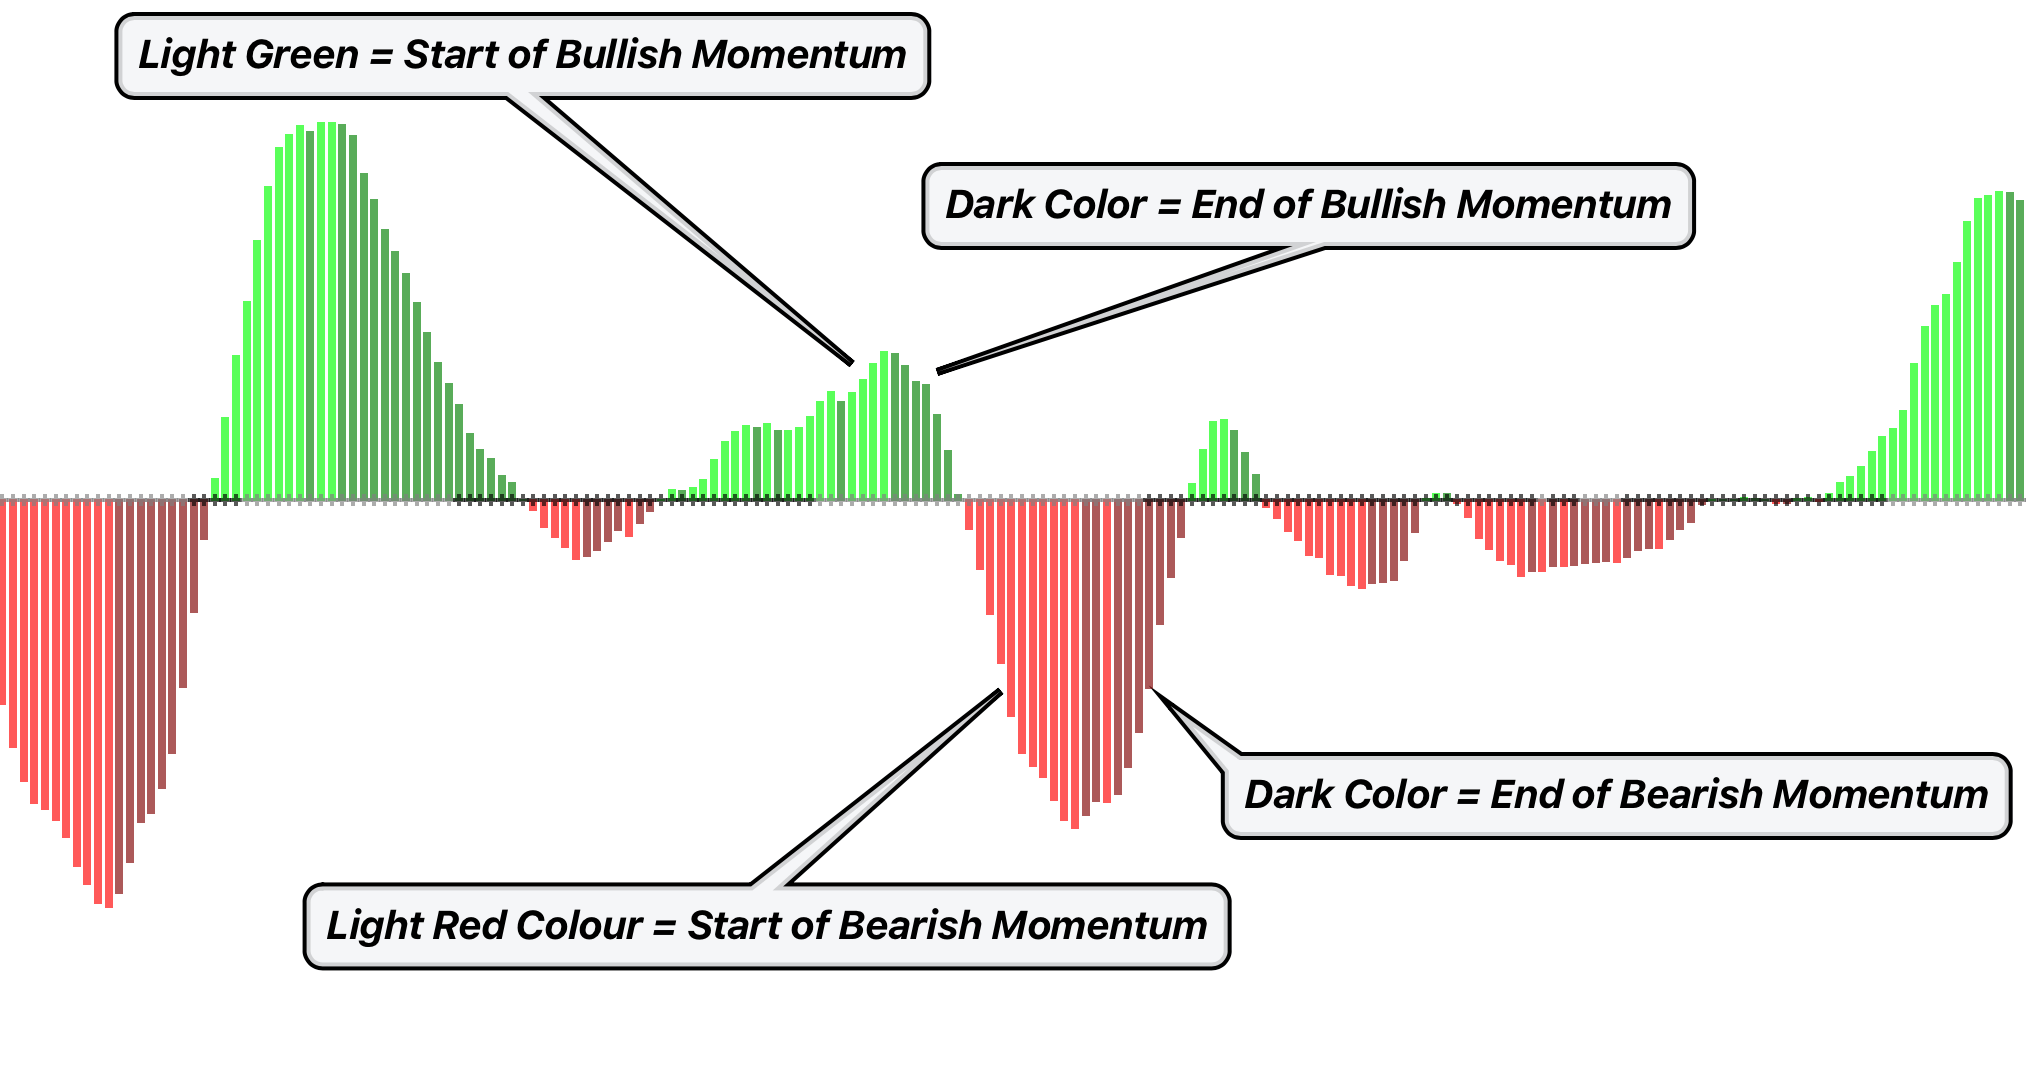
Interpreting the Momentum Histogram
The momentum histogram provides critical directional information:
- Rising histogram above zero: Suggests bullish momentum and potential upward breakout
- Falling histogram above zero: Indicates weakening bullish momentum
- Falling histogram below zero: Suggests bearish momentum and potential downward breakout
- Rising histogram below zero: Indicates weakening bearish momentum
TTM Squeeze Trading Strategies
Strategy 1: The Classic Squeeze Play
This is the foundational TTM Squeeze strategy developed by John Carter:
- Wait for the Setup: Look for at least 3-5 consecutive red dots indicating sustained compression
- Monitor Momentum: Watch the momentum histogram for directional bias
- Enter on the Fire: Enter trades when the first green dot appears after red dots
- Direction Confirmation: Trade in the direction of the momentum histogram
- Exit Strategy: Hold for 8-10 bars after the squeeze fires, or exit when momentum begins to decline
Strategy 2: Early Entry on Momentum Shifts
For more aggressive traders, this strategy involves entering before the squeeze officially fires:
- Identify Active Squeeze: Confirm red dots are present
- Watch for Momentum Change: Look for momentum histogram starting to move in one direction
- Enter on Momentum Acceleration: Enter when momentum shows increasing bars in the desired direction
- Confirm with Volume: Higher volume adds conviction to the signal
Strategy 3: Multi-Timeframe Squeeze Analysis
This advanced strategy uses multiple timeframes for enhanced accuracy:
- Higher Timeframe Trend: Identify the primary trend on a higher timeframe (e.g., daily for intraday trading)
- Lower Timeframe Entry: Use a lower timeframe TTM Squeeze for precise entry timing
- Alignment Strategy: Only take trades that align with the higher timeframe trend direction
- Enhanced Risk Management: Use the higher timeframe context for better stop-loss placement
| Timeframe | Typical Duration | Best Use Case |
|---|---|---|
| 5-minute | 40 minutes (8 bars) | Scalping, day trading |
| 15-minute | 2-3 hours | Intraday swing trading |
| 1-hour | 8-10 hours | Short-term position trading |
| Daily | 8-10 days | Swing trading |
| Weekly | 8-10 weeks | Position trading |
TTM Squeeze Settings and Optimization
Standard TTM Squeeze Settings
The default TTM Squeeze parameters work well for most markets and timeframes:
- Length: 20 periods
- Bollinger Bands: 2.0 standard deviation
- Keltner Channels: 1.5 ATR multiplier
- Source: Closing prices
Customized Settings by Trading Style
Aggressive/Scalping:
- Length: 10 periods
- BB Deviation: 1.5
- KC Multiplier: 1.0
- More frequent but less reliable signals
Conservative/Position:
- Length: 30 periods
- BB Deviation: 2.5
- KC Multiplier: 2.0
- Fewer but more reliable signals
Advanced TTM Squeeze Techniques
The TTM Squeeze Pro Enhancement
The TTM Squeeze Pro version adds compression levels with different colored dots:
- Orange Dots: Highest compression (strongest potential)
- Red Dots: Medium compression
- Black Dots: Light compression
- Green Dots: No compression (squeeze fired)
Combining TTM Squeeze with Other Indicators
Enhance TTM Squeeze effectiveness by combining it with complementary indicators:
- RSI or Stochastic: Confirm overbought/oversold conditions before squeeze fires
- Moving Averages: Determine overall trend direction for trade alignment
- Volume Indicators: Confirm breakout strength with volume analysis
- Support/Resistance Levels: Identify key levels for profit targets and stops
Risk Management for TTM Squeeze Trading
Position Sizing and Entry Rules
Proper risk management is crucial for TTM Squeeze trading success:
- Never risk more than 1-2% of your account on a single squeeze trade
- Wait for confirmation: Don't enter on the first sign of momentum change
- Use appropriate position sizing based on the distance to your stop-loss level
- Consider volatility: Reduce position size during high volatility periods
Stop-Loss Strategies
Several effective stop-loss approaches for TTM Squeeze trades:
- Squeeze Entry Stop: Place stop-loss just below/above the squeeze entry point
- ATR-Based Stops: Use 1.5-2x ATR from entry point for volatile markets
- Support/Resistance Stops: Place stops beyond significant support or resistance levels
- Momentum-Based Stops: Exit when momentum histogram shows opposing direction for 2+ bars
TTM Squeeze in Different Market Conditions
Trending Markets
In strong trending markets, TTM Squeeze signals often provide excellent continuation opportunities. Look for squeezes that fire in the direction of the primary trend for higher probability trades.
Range-Bound Markets
During sideways markets, TTM Squeeze can help identify breakout attempts. However, be cautious of false breakouts and consider waiting for strong momentum confirmation before entering trades.
High Volatility Periods
During earnings seasons or major news events, adjust TTM Squeeze parameters to account for increased volatility. Consider using wider Bollinger Bands (2.5-3.0 standard deviations) and larger ATR multipliers.
Common TTM Squeeze Trading Mistakes
Mistake 1: Entering Too Early
Many traders enter positions as soon as they see momentum building, before the squeeze actually fires. This often results in being stopped out during continued consolidation.
Mistake 2: Ignoring the Trend Context
Trading squeeze signals against the primary trend significantly reduces success rates. Always consider the larger market context before entering positions.
Mistake 3: Poor Risk Management
Risking too much on individual trades or failing to use proper stop-losses can quickly destroy trading accounts, even with good signal identification.
Mistake 4: Overtrading
Not all squeeze setups are worth trading. Focus on high-quality setups with strong momentum confirmation and favorable risk-reward ratios.
TTM Squeeze vs. Other Volatility Indicators
| Indicator | Primary Focus | Best Use Case | Compared to TTM Squeeze |
|---|---|---|---|
| Bollinger Bands | Volatility expansion/contraction | Mean reversion trading | Less directional information |
| Keltner Channels | ATR-based volatility | Trend following | No compression detection |
| ATR | Volatility measurement | Position sizing, stops | No directional signals |
| VIX | Market fear/complacency | Market sentiment analysis | Broader market only |
Getting Started with TTM Squeeze Trading
Platform Availability
The TTM Squeeze indicator is available on several popular trading platforms:
- ThinkOrSwim (TOS): Built-in under “John Carter's Studies”
- TradingView: Available as a third-party indicator
- TradeStation: Available through the app store
- NinjaTrader: Available as add-on indicator
- MetaTrader: Custom versions available
Practice and Paper Trading
Before risking real money with TTM Squeeze strategies:
- Study historical charts: Practice identifying squeeze setups on past price data
- Paper trade first: Test your understanding without financial risk
- Start with liquid markets: Practice on major indices or forex pairs
- Keep a trading journal: Document setups, entries, exits, and outcomes
- Backtest strategies: Verify strategy performance over extended periods
⚠️ Important Note:
The TTM Squeeze indicator should never be used in isolation. Always combine it with proper risk management, market context analysis, and additional confirmation indicators for optimal results.
Conclusion: Mastering the TTM Squeeze
The TTM Squeeze indicator represents one of the most powerful tools for identifying explosive market opportunities. By combining the volatility measurement of Bollinger Bands and Keltner Channels with momentum analysis, it provides traders with a comprehensive system for anticipating and capitalizing on major price movements.
Success with the TTM Squeeze requires patience, discipline, and proper risk management. Focus on high-quality setups, understand the market context, and always have a clear plan for both profits and losses. With consistent practice and proper application, the TTM Squeeze can become a cornerstone of a successful trading strategy.
Remember that no indicator is perfect, and the TTM Squeeze works best when combined with other forms of analysis. Continue learning, practicing, and refining your approach to maximize the potential of this powerful trading tool.
🎯 Key Takeaways:
- • TTM Squeeze identifies compression periods that precede explosive moves
- • Red dots indicate squeeze conditions, green dots signal the “fire”
- • Momentum histogram provides directional bias for trade entries
- • Typical squeeze moves last 8-10 bars after firing
- • Always combine with proper risk management and market context