Complete Candlestick Patterns Guide
Master the complete collection of candlestick patterns - from basic hammer and doji formations to advanced three-candle reversal patterns. Learn to identify high-probability trading opportunities with proven success rates and professional trading strategies.
What Are Candlestick Patterns?
Candlestick patterns are visual representations of price movements within a specific time frame displayed on a candlestick chart. Each candlestick shows four key pieces of information: the opening price, the closing price, the highest price, and the lowest price during the period.
Originally developed by Japanese rice traders in the 18th century, candlestick analysis has become one of the most powerful tools in modern technical analysis. These patterns work across all timeframes and markets, from forex and stocks to cryptocurrencies and commodities, providing insights into market psychology and potential future price movements.
Understanding Candlestick Anatomy
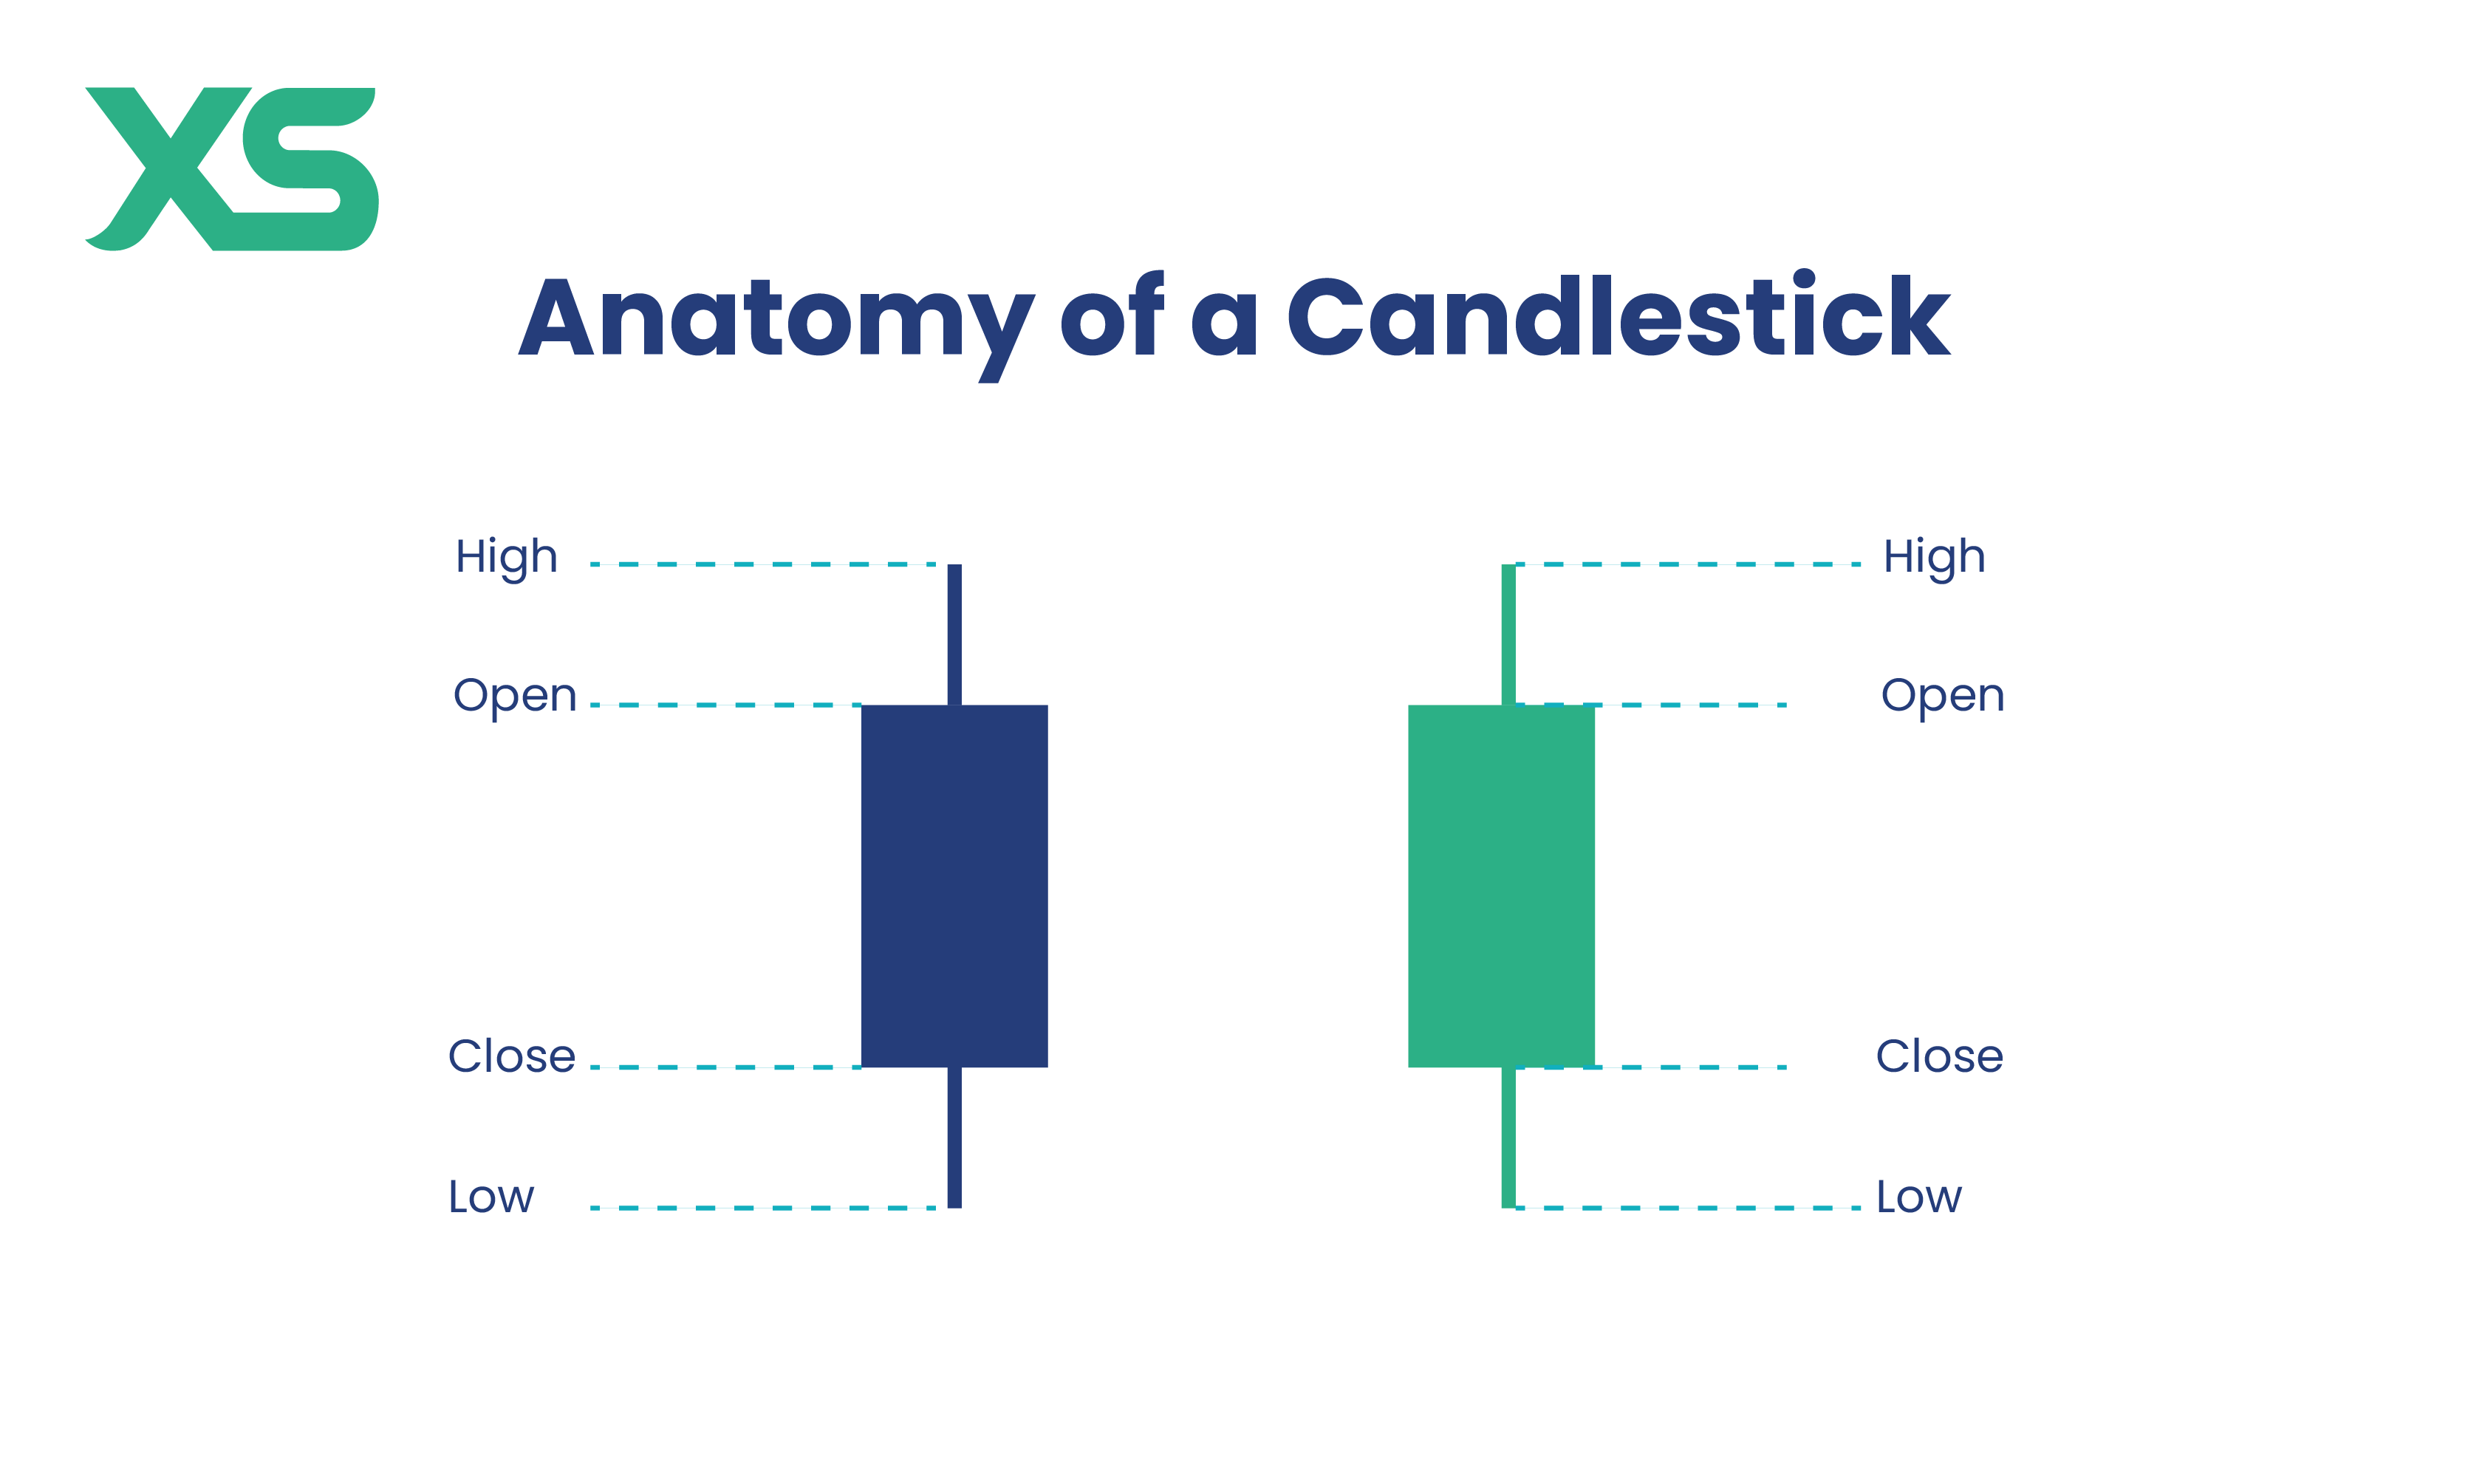
Before diving into the 59 specific patterns, it's essential to understand the basic structure of a candlestick:
- Body: The thick part representing the difference between opening and closing prices
- Upper Shadow (Wick): The thin line above the body showing the highest price reached
- Lower Shadow (Wick): The thin line below the body showing the lowest price reached
- Color: Green/white for bullish candles (close > open), red/black for bearish candles (close < open)
Complete List of 59 Candlestick Patterns
This comprehensive table lists all 59 candlestick patterns recognized by professional traders worldwide. Each pattern is categorized by its signal type and includes a detailed description of its market psychology.
| # | Candlestick Pattern | Signal | Description |
|---|---|---|---|
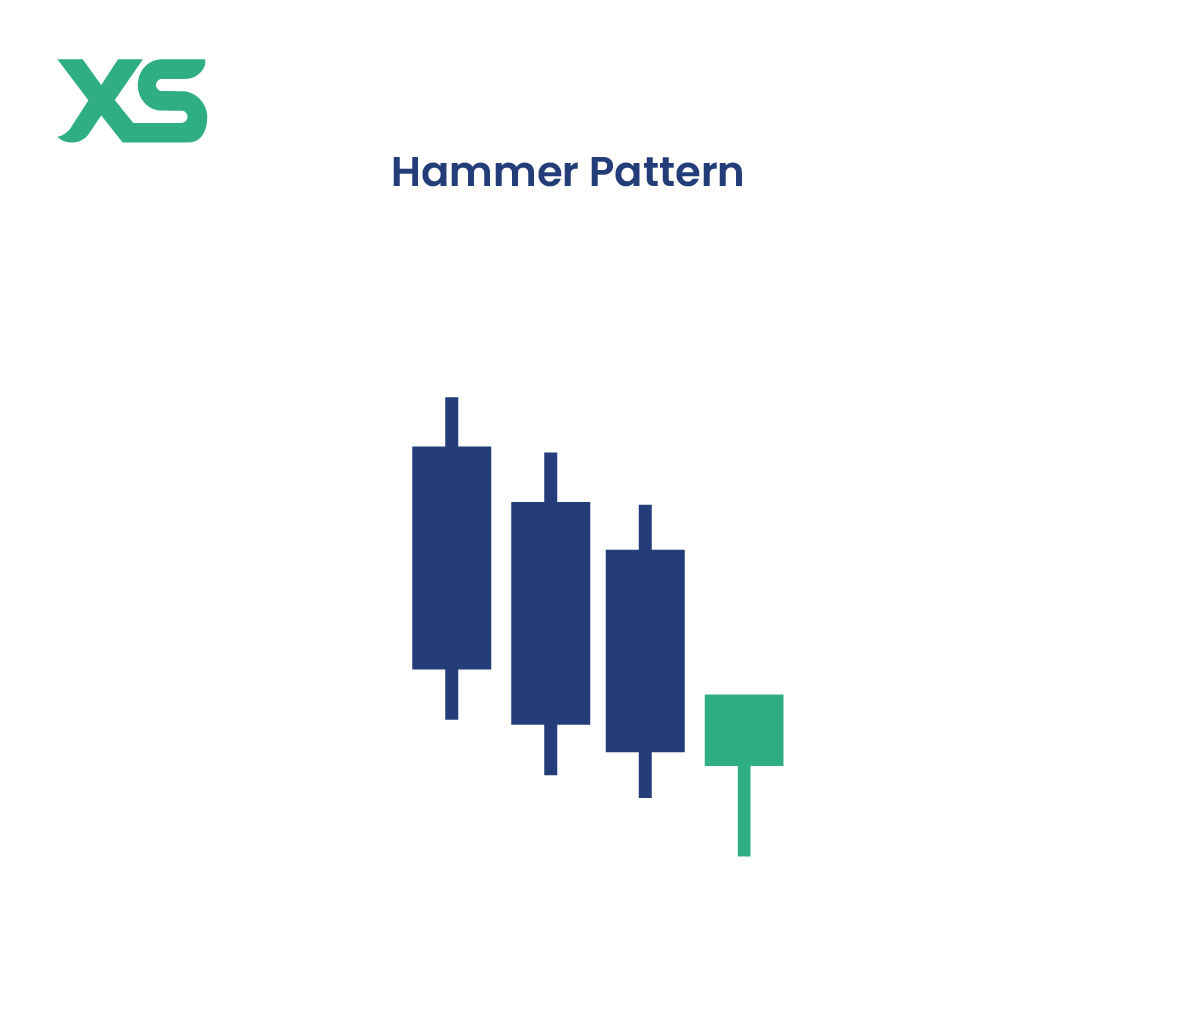
| 1 | Hammer Pattern | Bullish Reversal | Small body near the top of the candlestick with a long lower wick, indicating buying pressure overcoming selling pressure. |
| 2 | Inverted Hammer Pattern | Bullish Reversal | Small body with a long upper wick after a downtrend, indicating resistance but potential for upward movement. |
| 3 | Piercing Line Pattern | Bullish Reversal | Two-candlestick pattern where the second candlestick closes above the midpoint of the first, signaling a shift to bullish sentiment. |
| 4 | Bullish Engulfing Pattern | Bullish Reversal | A small bearish candle followed by a larger bullish candle that engulfs the previous one, signaling a shift in control. |
| 5 | Bullish Spinning Top Pattern | Bullish Reversal | Small body and long wicks on both sides, showing indecision but weakening selling pressure after a downtrend. |
| 6 | The Morning Star Pattern | Bullish Reversal | Three-candlestick pattern with a long bearish, a small-bodied candlestick, and a long bullish one, indicating a bullish reversal. |
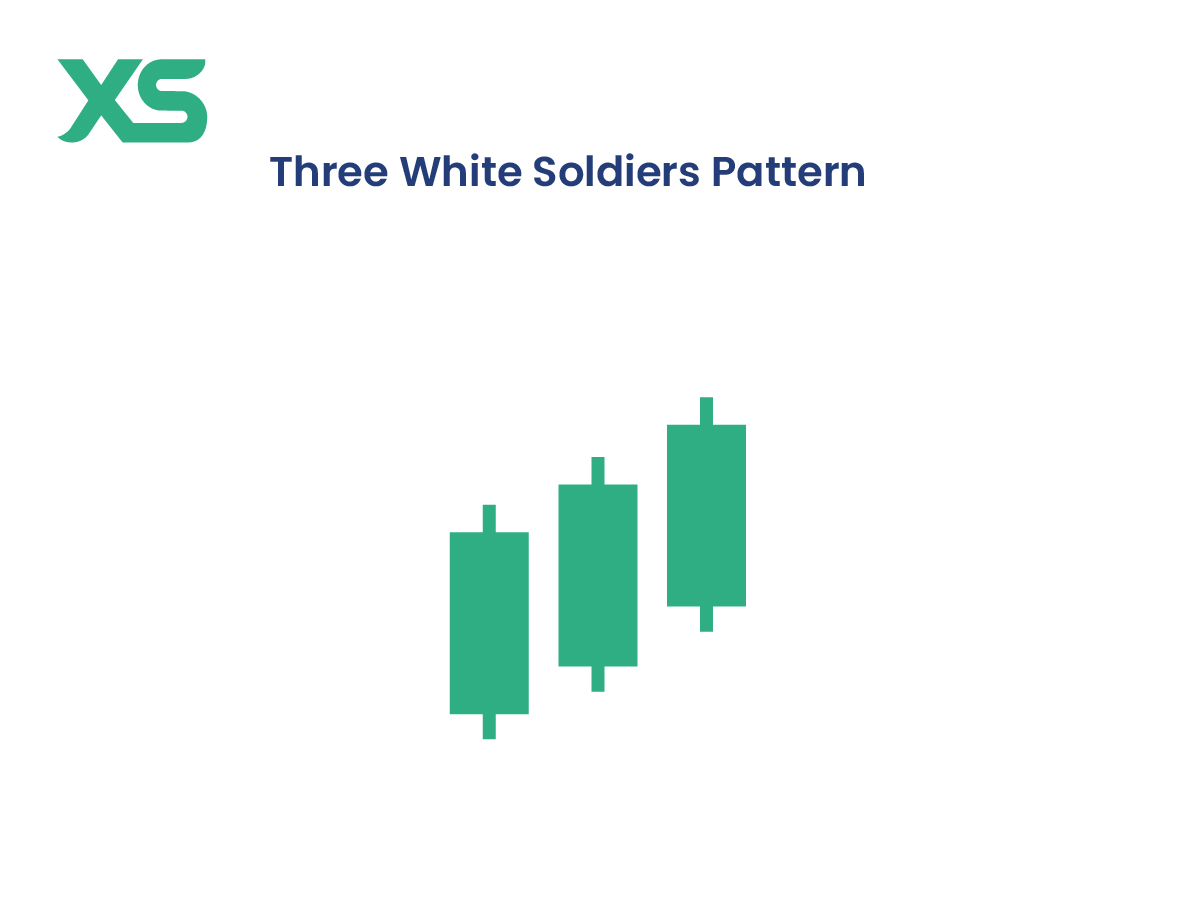
| 7 | Three White Soldiers Pattern | Bullish Continuation | Three consecutive long bullish candles with small or no wicks, signaling strong buying pressure and uptrend continuation. |
| 8 | Three Inside Up Pattern | Bullish Reversal | Three-candlestick pattern with a long bearish, a smaller bullish, and a third bullish that closes above the first, showing a reversal. |
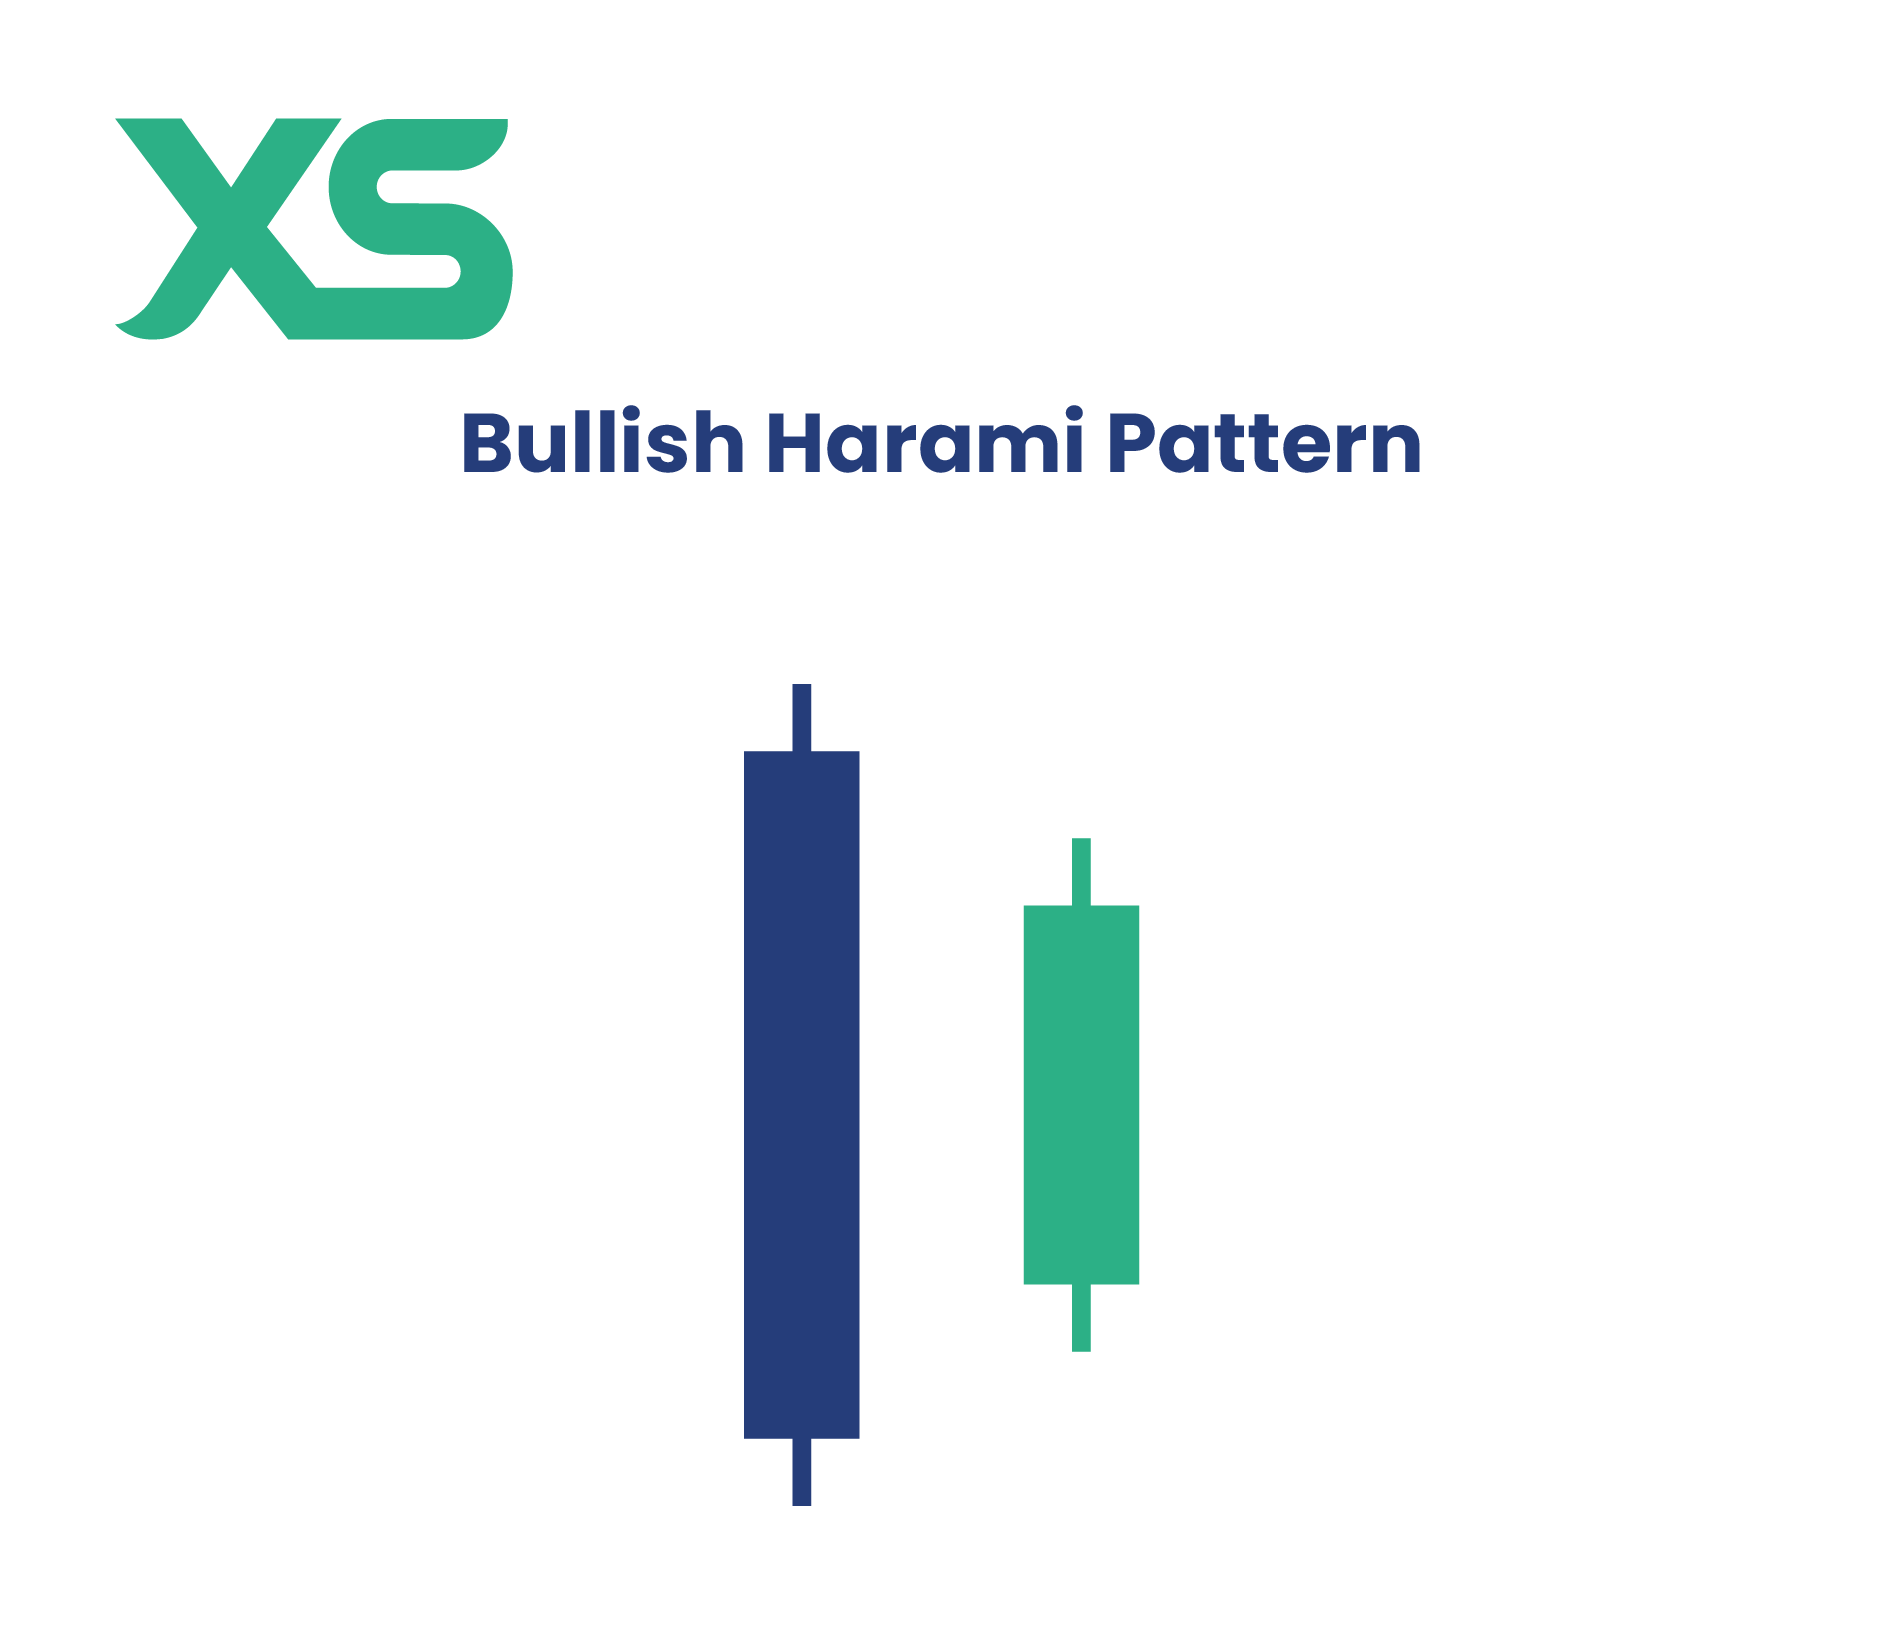
| 9 | Bullish Harami Pattern | Bullish Reversal | A small bullish candle within the body of a preceding large bearish candle, signaling weakening selling pressure. |
| 10 | Tweezer Bottom Pattern | Bullish Reversal | Two candlesticks with matching lows, indicating strong support and a potential upward reversal. |
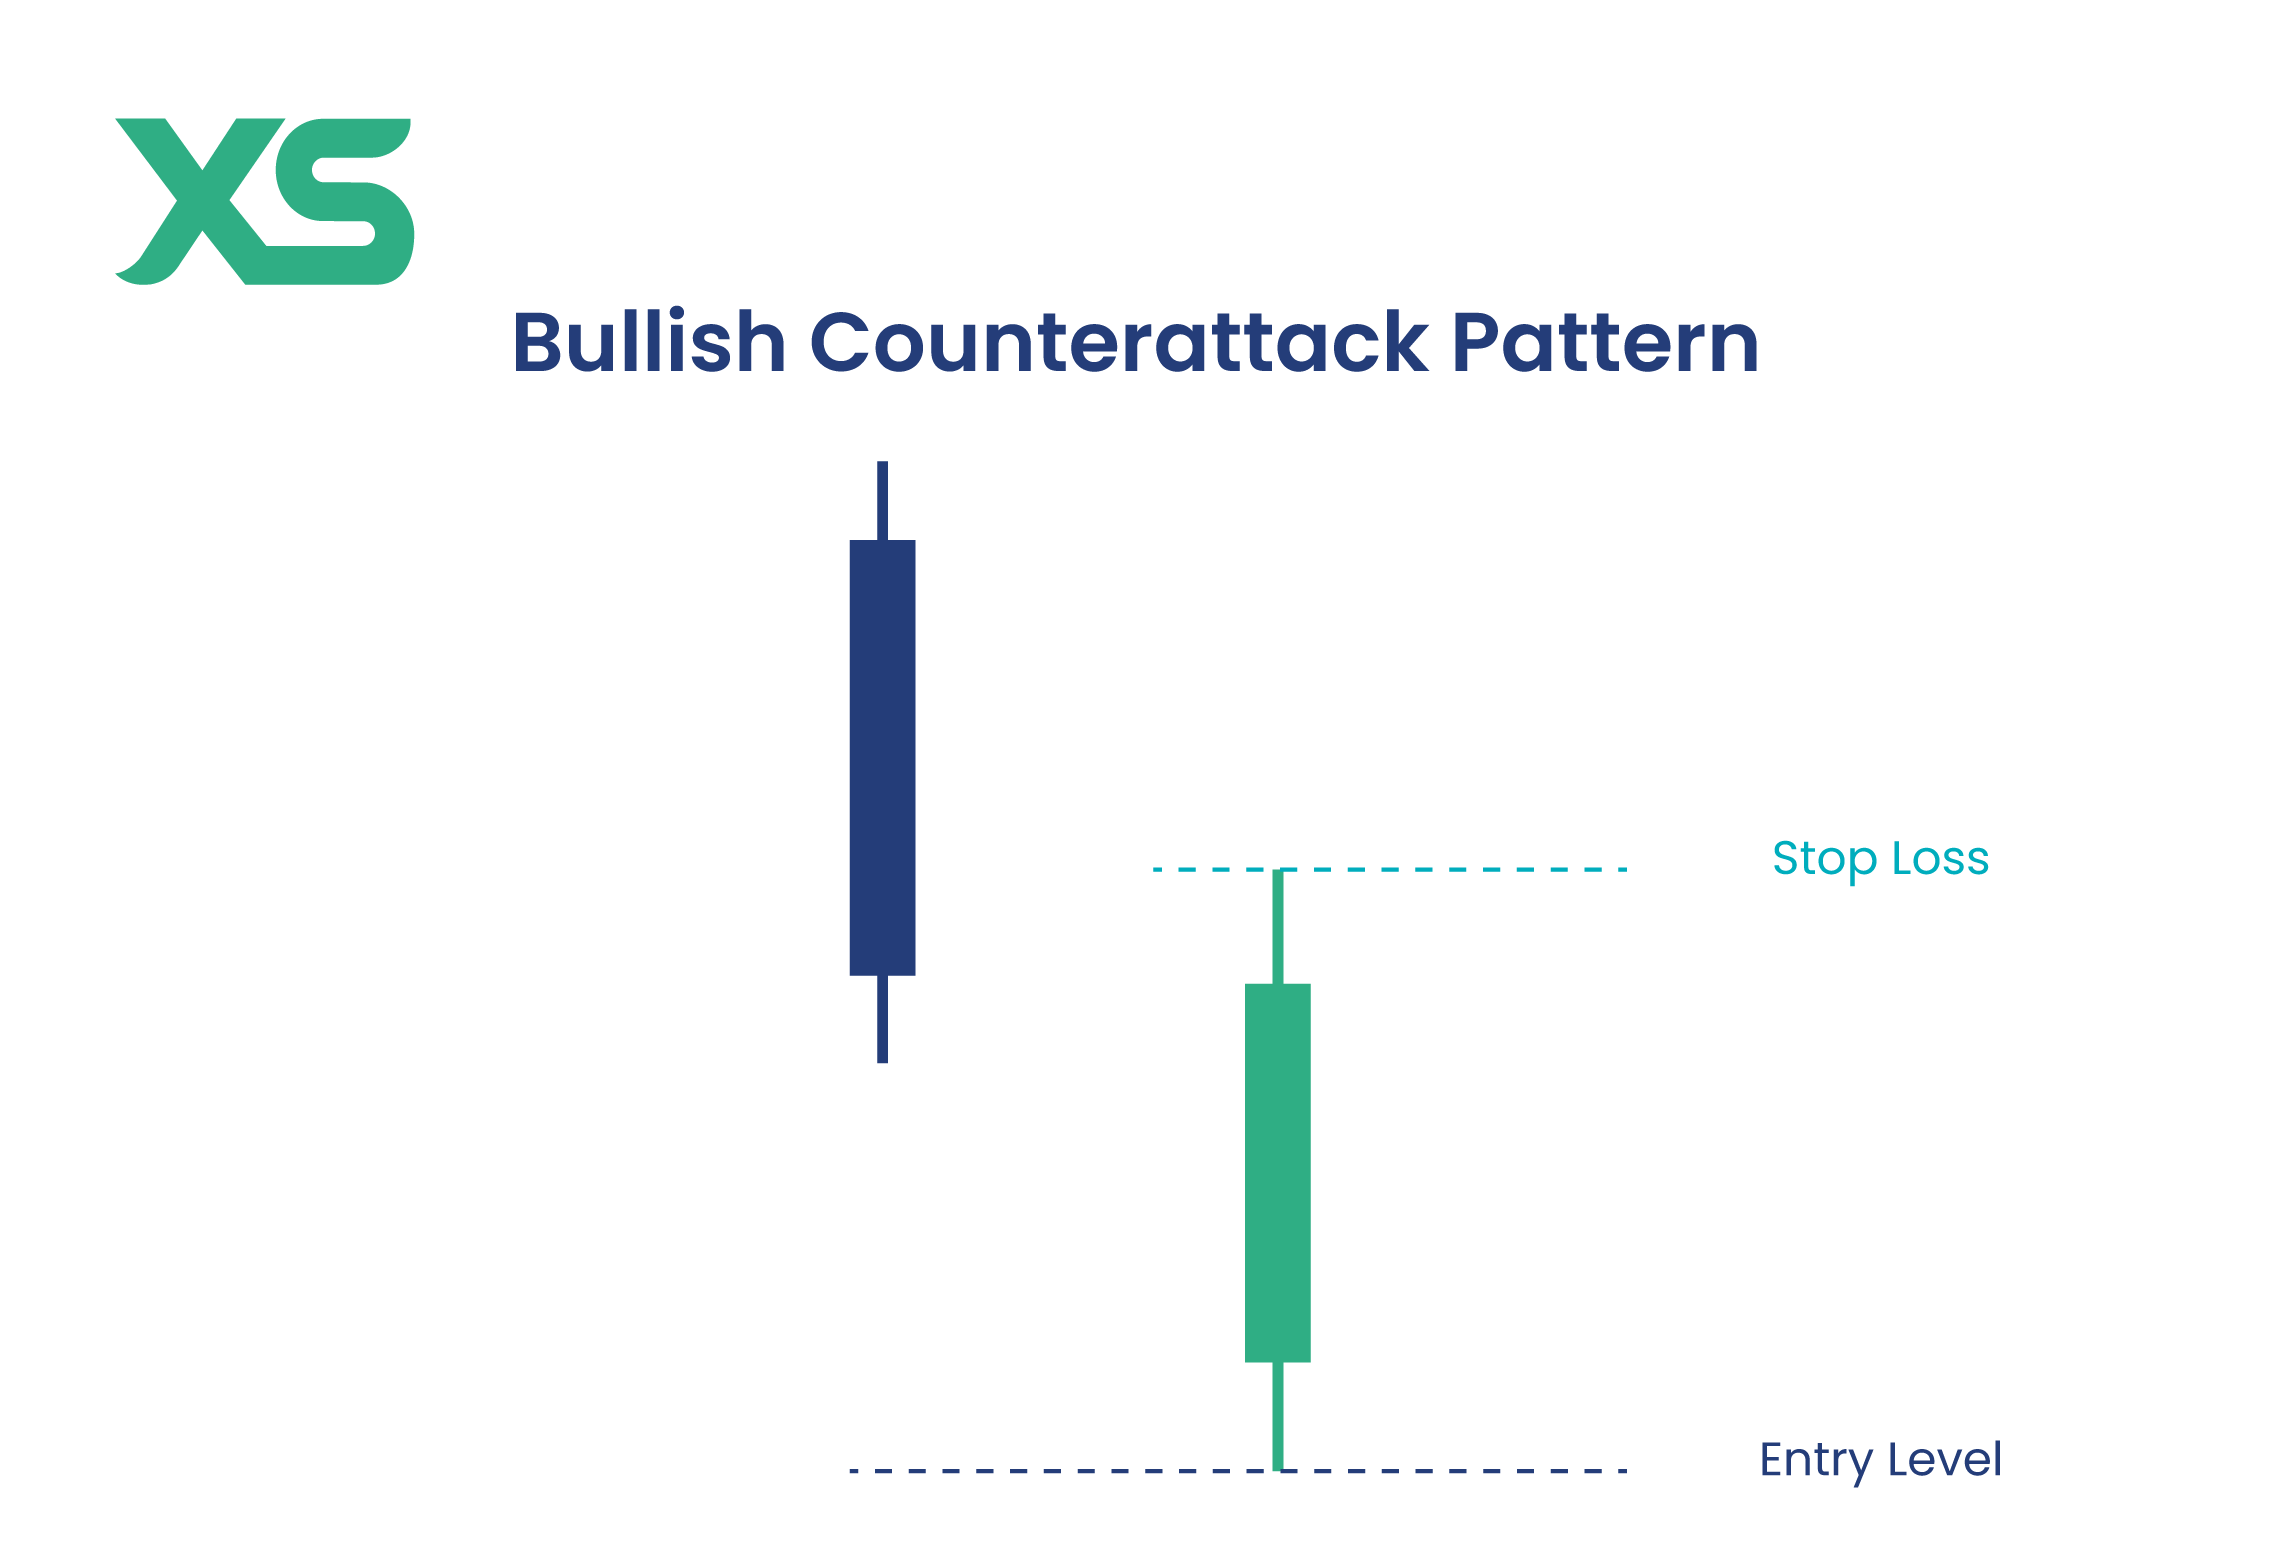
| 11 | Bullish Counterattack Pattern | Bullish Reversal | Bearish followed by a bullish candlestick that closes at the same level as the previous candle, signaling reversal. |
| 12 | Bullish Kicker Pattern | Bullish Reversal | Bullish candle gapping up and continuing upward after a bearish candle, indicating strong reversal to the upside. |
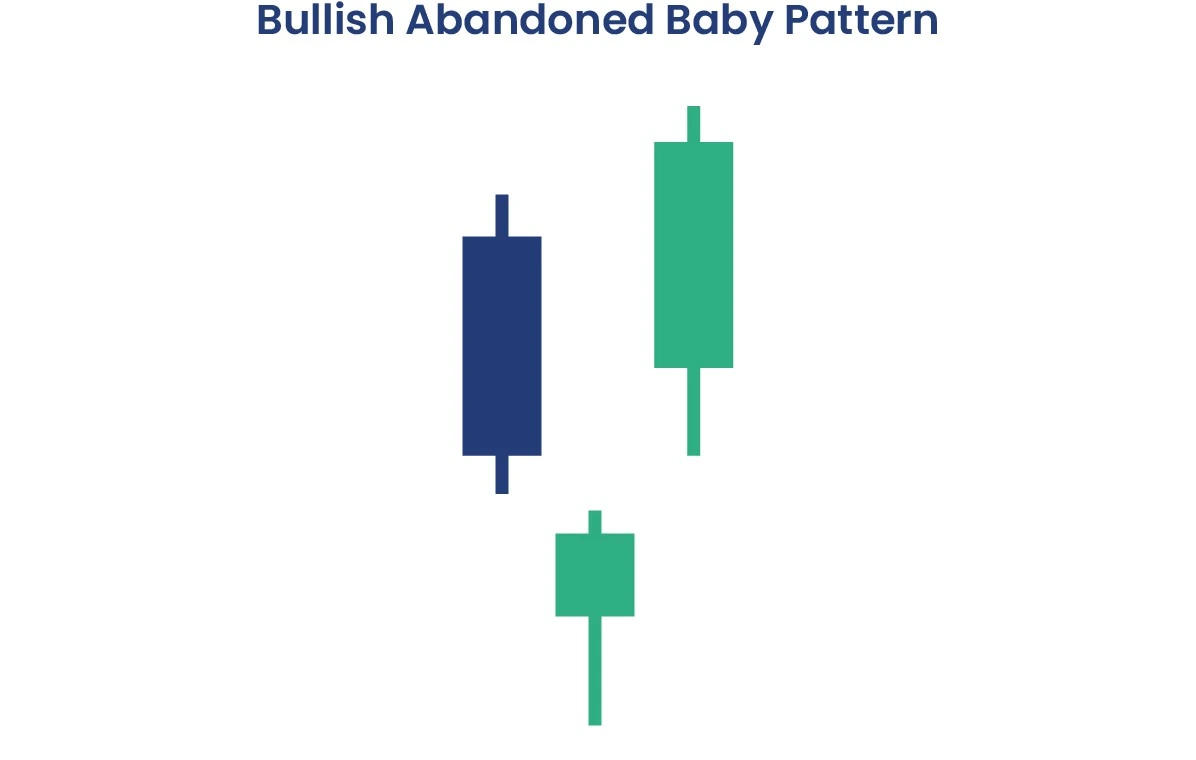
| 13 | Bullish Abandoned Baby Pattern | Bullish Reversal | Three-candle pattern with a long bearish, doji, and bullish candle gapping up, signaling strong reversal. |
| 14 | Morning Star Doji Pattern | Bullish Reversal | Similar to the morning star pattern but includes a doji as the middle candle, indicating indecision before reversal. |
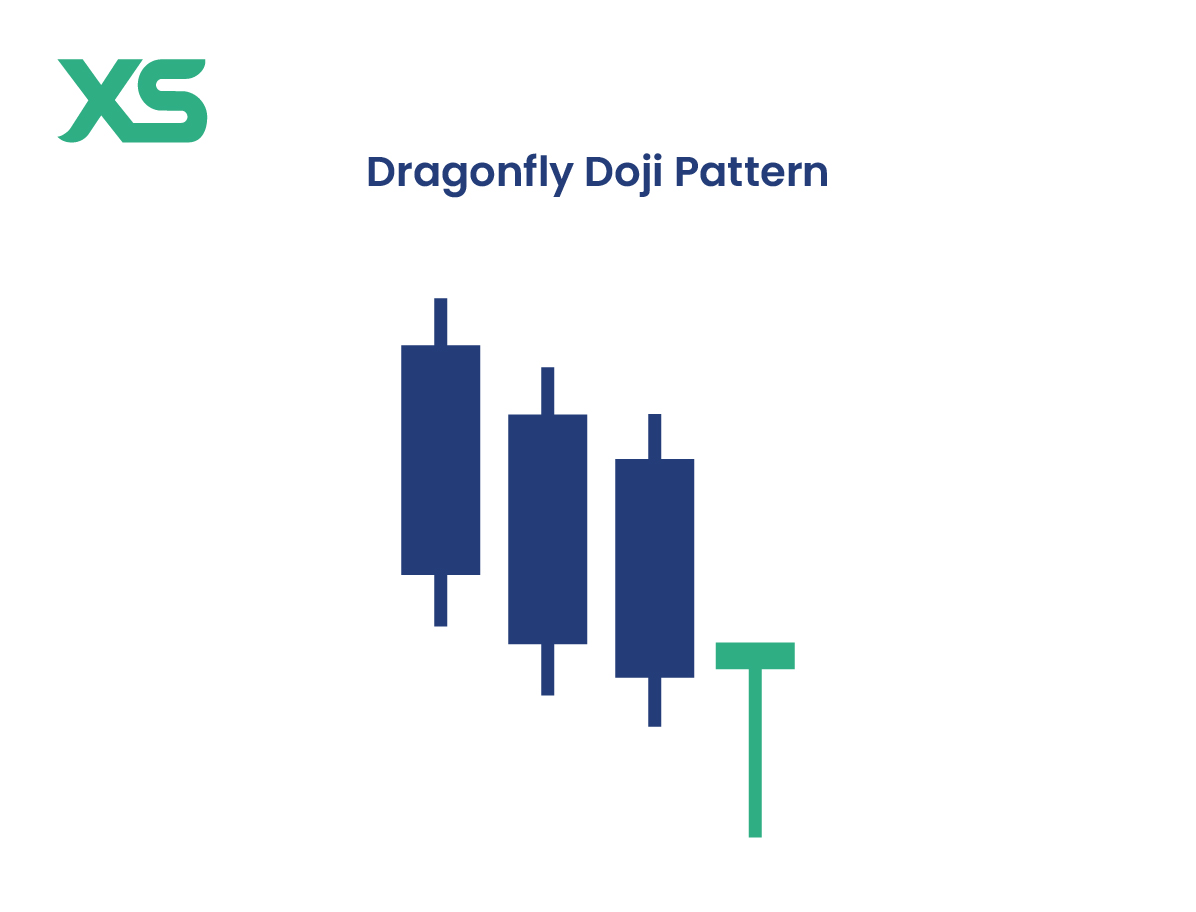
| 15 | Dragonfly Doji Pattern | Bullish Reversal | A doji with a long lower wick, indicating buying pressure overcoming selling pressure at the bottom of a downtrend. |
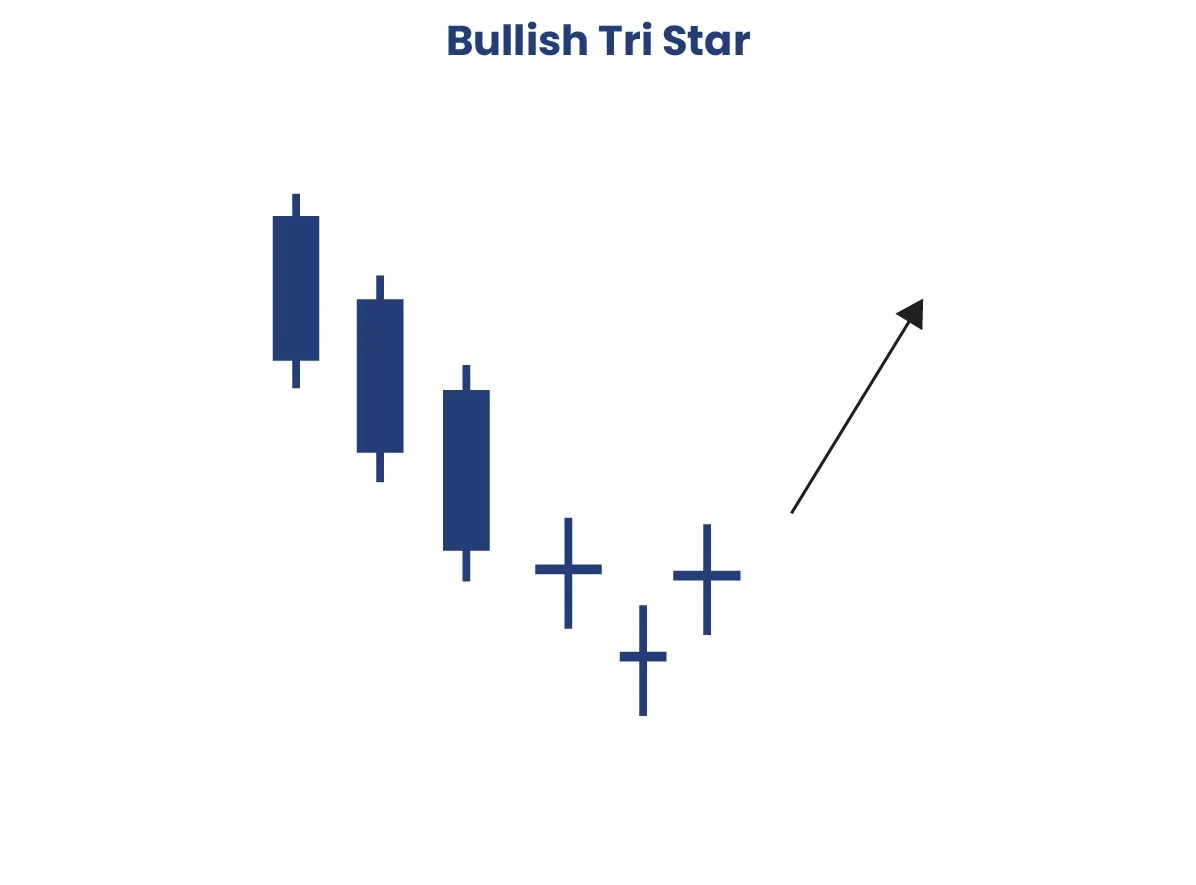
| 16 | Bullish Tri-Star Pattern | Bullish Reversal | Three doji candles in a row, signaling market indecision but potential for reversal at the bottom of a downtrend. |
| 17 | Bullish Hikkake Pattern | Bullish Reversal | Inside bar pattern followed by a bullish breakout, indicating reversal after a period of consolidation or indecision. |
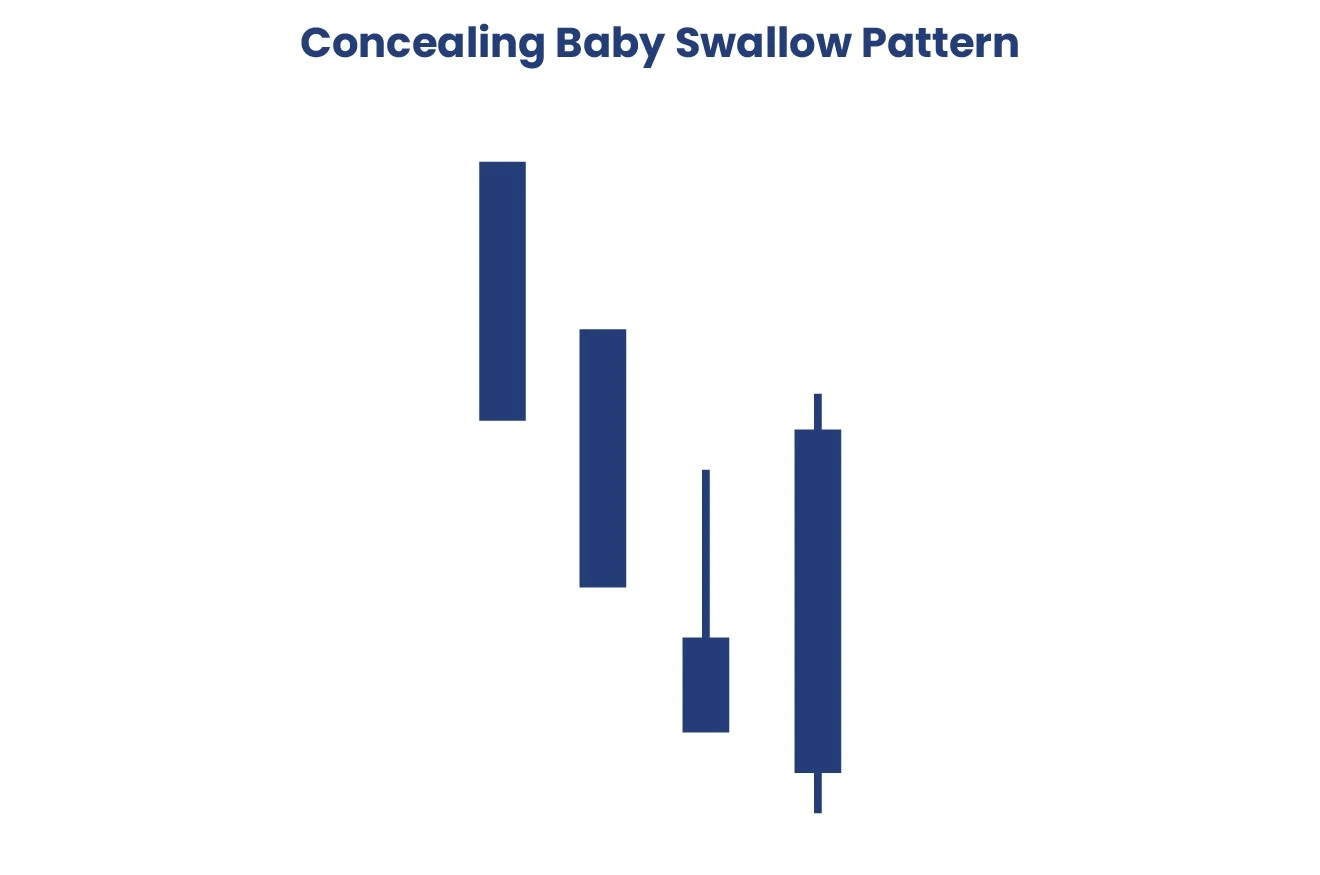
| 18 | Concealing Baby Swallow Pattern | Bullish Reversal | Four bearish candles followed by a bullish candle after exhaustion, indicating a potential reversal to the upside. |
| 19 | Unique Three Rivers Pattern | Bullish Reversal | Three-candlestick pattern indicating buying pressure overcoming selling after a downtrend, signaling potential reversal. |
| 20 | Hanging Man Pattern | Bearish Reversal | Small body at the top of the candlestick with a long lower wick, signaling sellers are gaining control. |
| 21 | Dark Cloud Cover Pattern | Bearish Reversal | Two-candlestick pattern with a bearish candle closing below the midpoint of the previous bullish candle. |
| 22 | Bearish Engulfing Pattern | Bearish Reversal | Small bullish candle followed by a larger bearish candle that completely engulfs the previous one. |
| 23 | The Evening Star Pattern | Bearish Reversal | Three-candlestick pattern with a long bullish, a small-bodied, and a bearish candle signaling reversal. |
| 24 | Three Black Crows Pattern | Bearish Reversal | Three consecutive long bearish candlesticks with small or no wicks, indicating strong selling pressure. |
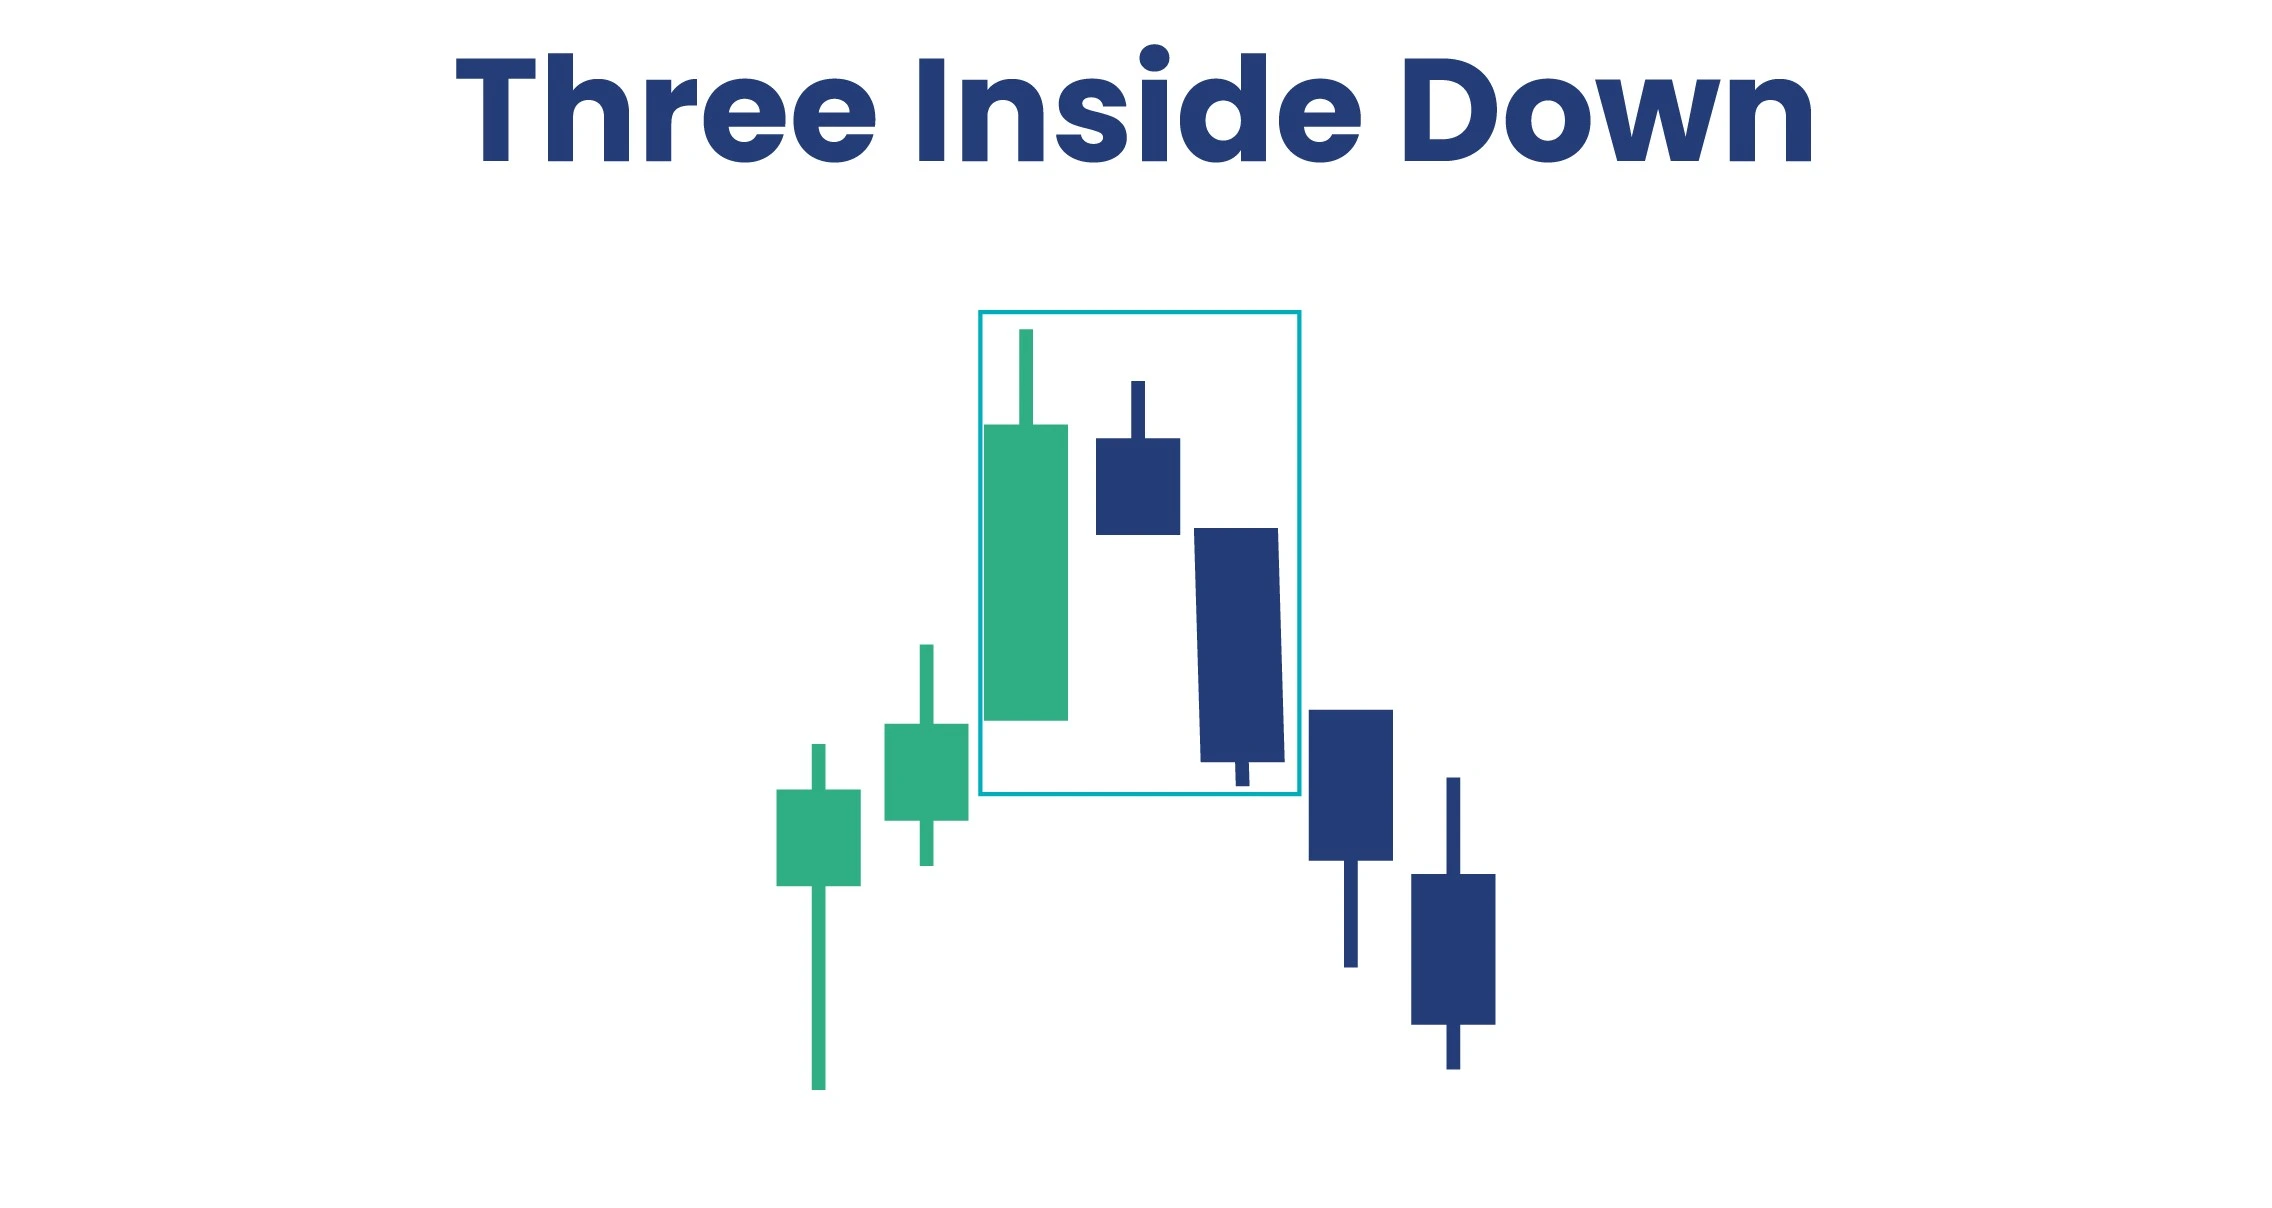
| 25 | Three Inside Down Pattern | Bearish Reversal | Three-candlestick pattern with a long bullish, a smaller bearish, and a third bearish candle signaling reversal. |
| 26 | Bearish Harami Pattern | Bearish Reversal | A small bearish candle forms within the body of a preceding large bullish candle, signaling weakening buying pressure. |
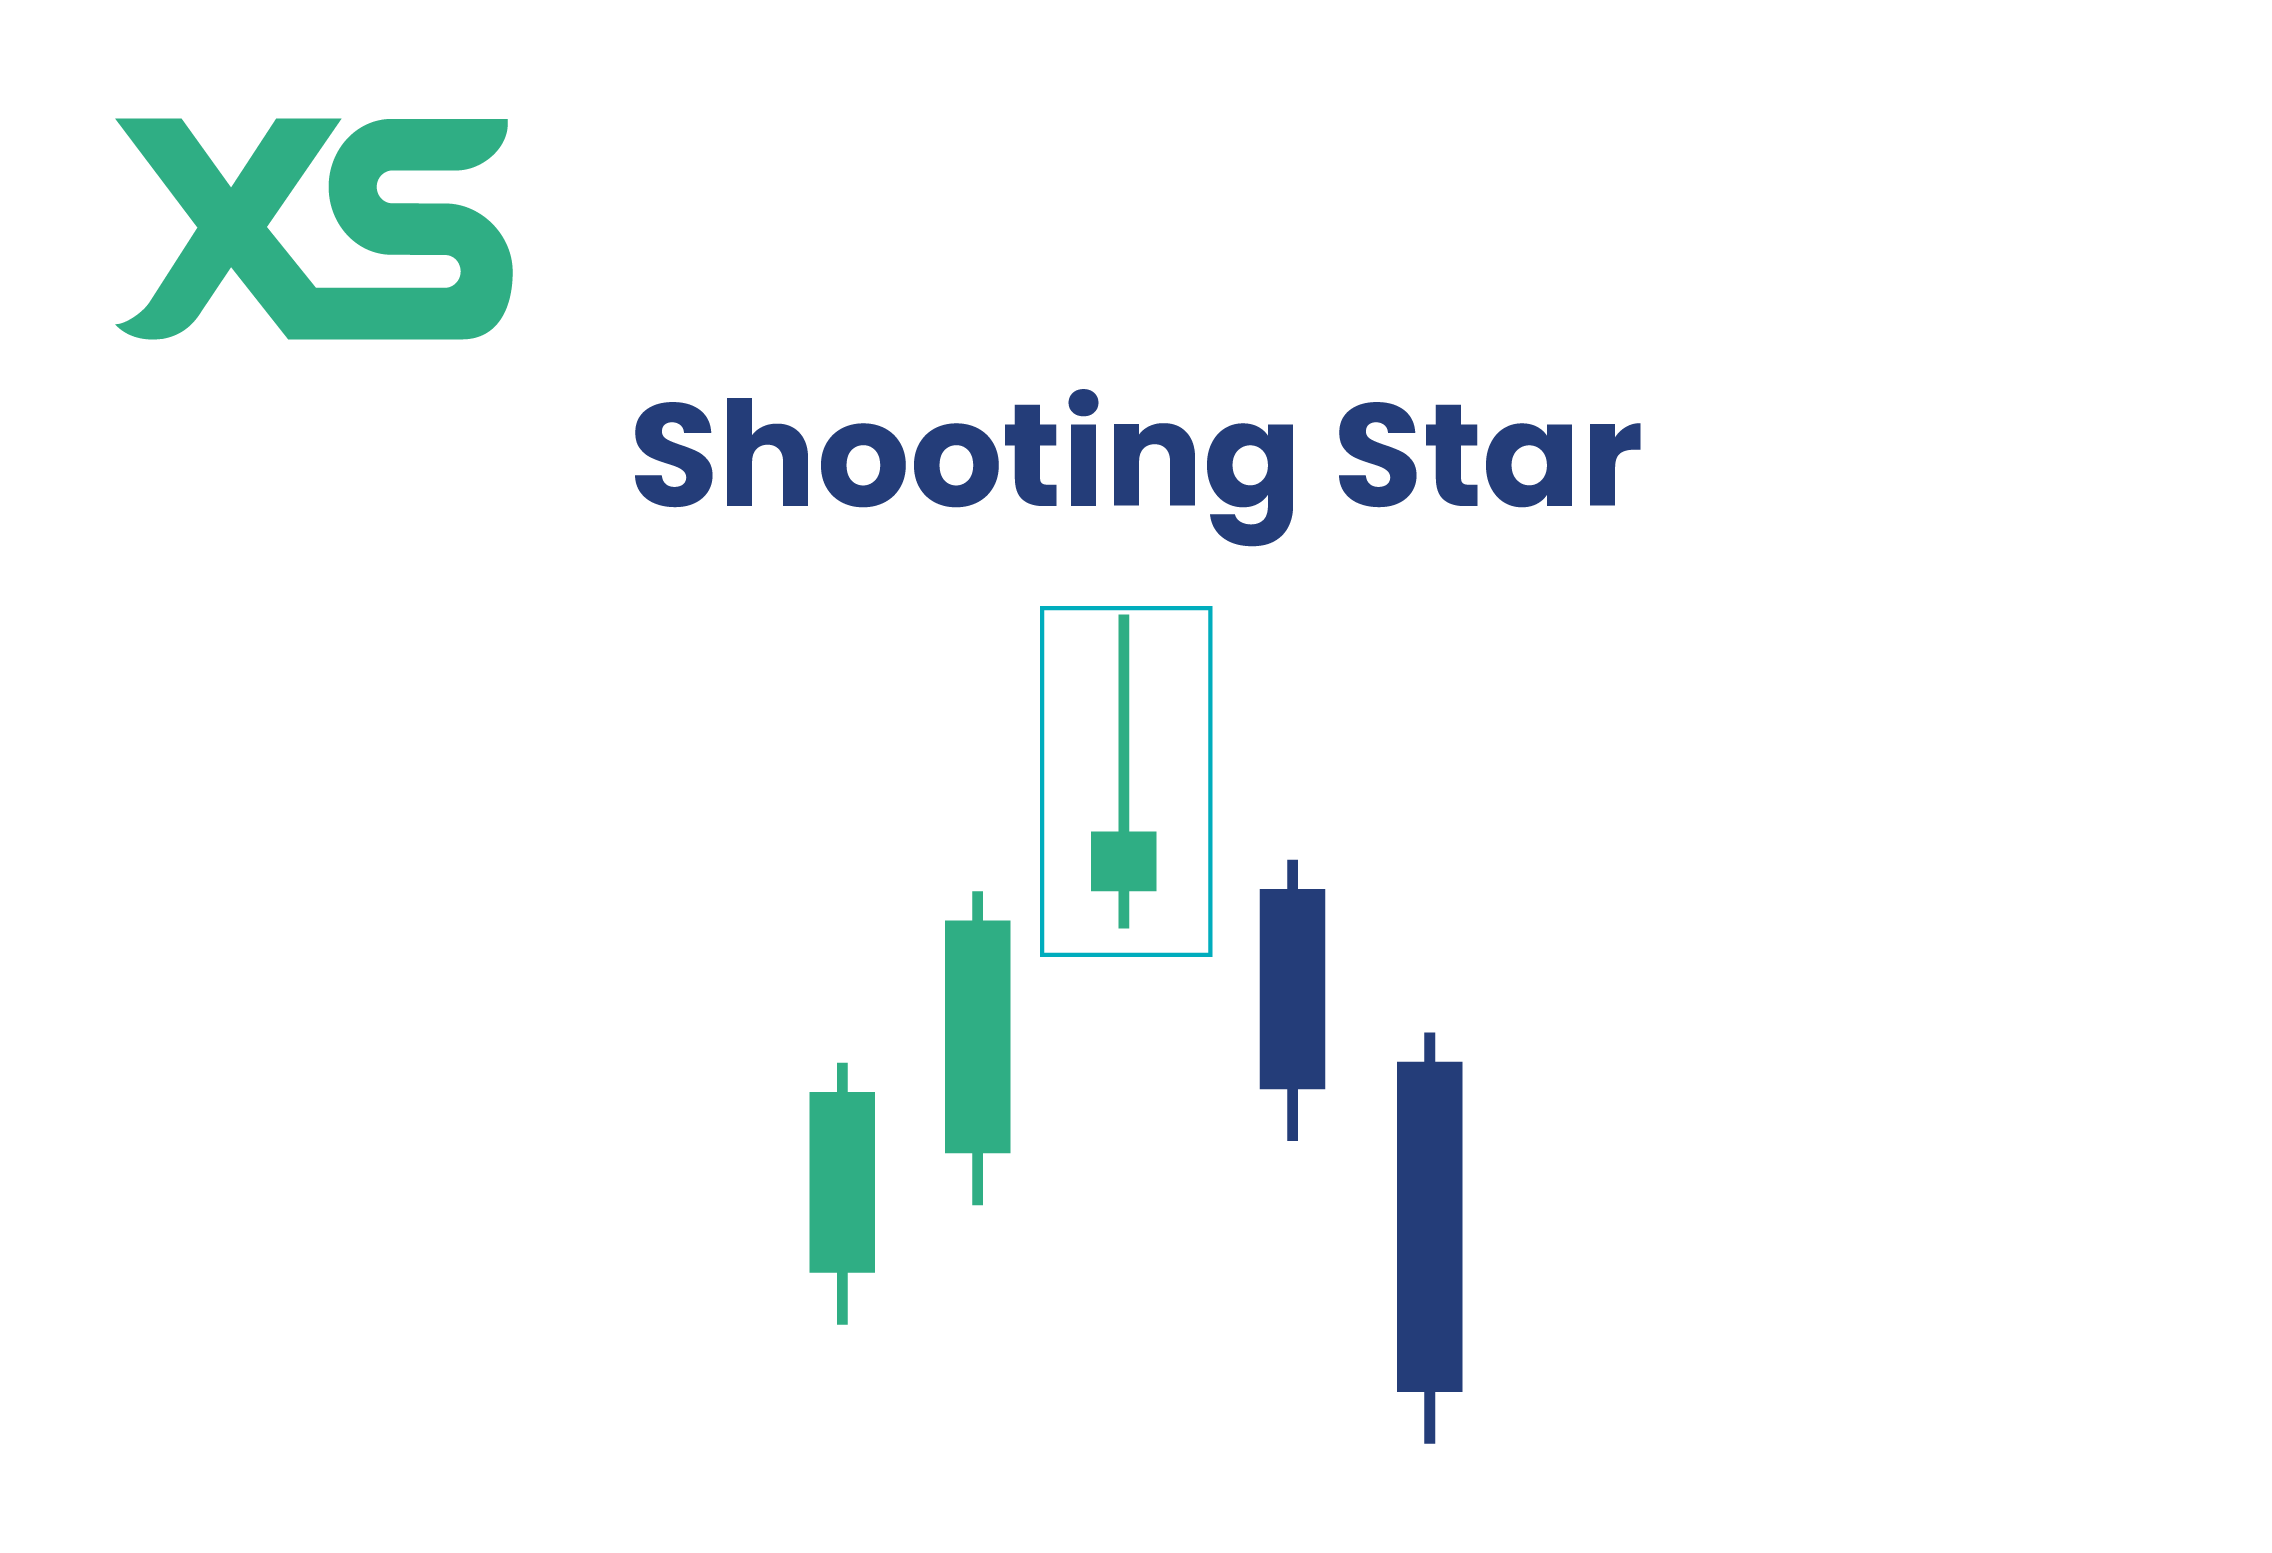
| 27 | Shooting Star Pattern | Bearish Reversal | Small body with a long upper wick, signaling resistance and a potential downward reversal. |
| 28 | Tweezer Top Pattern | Bearish Reversal | Two candlesticks with matching highs, indicating strong resistance and a potential downward reversal. |
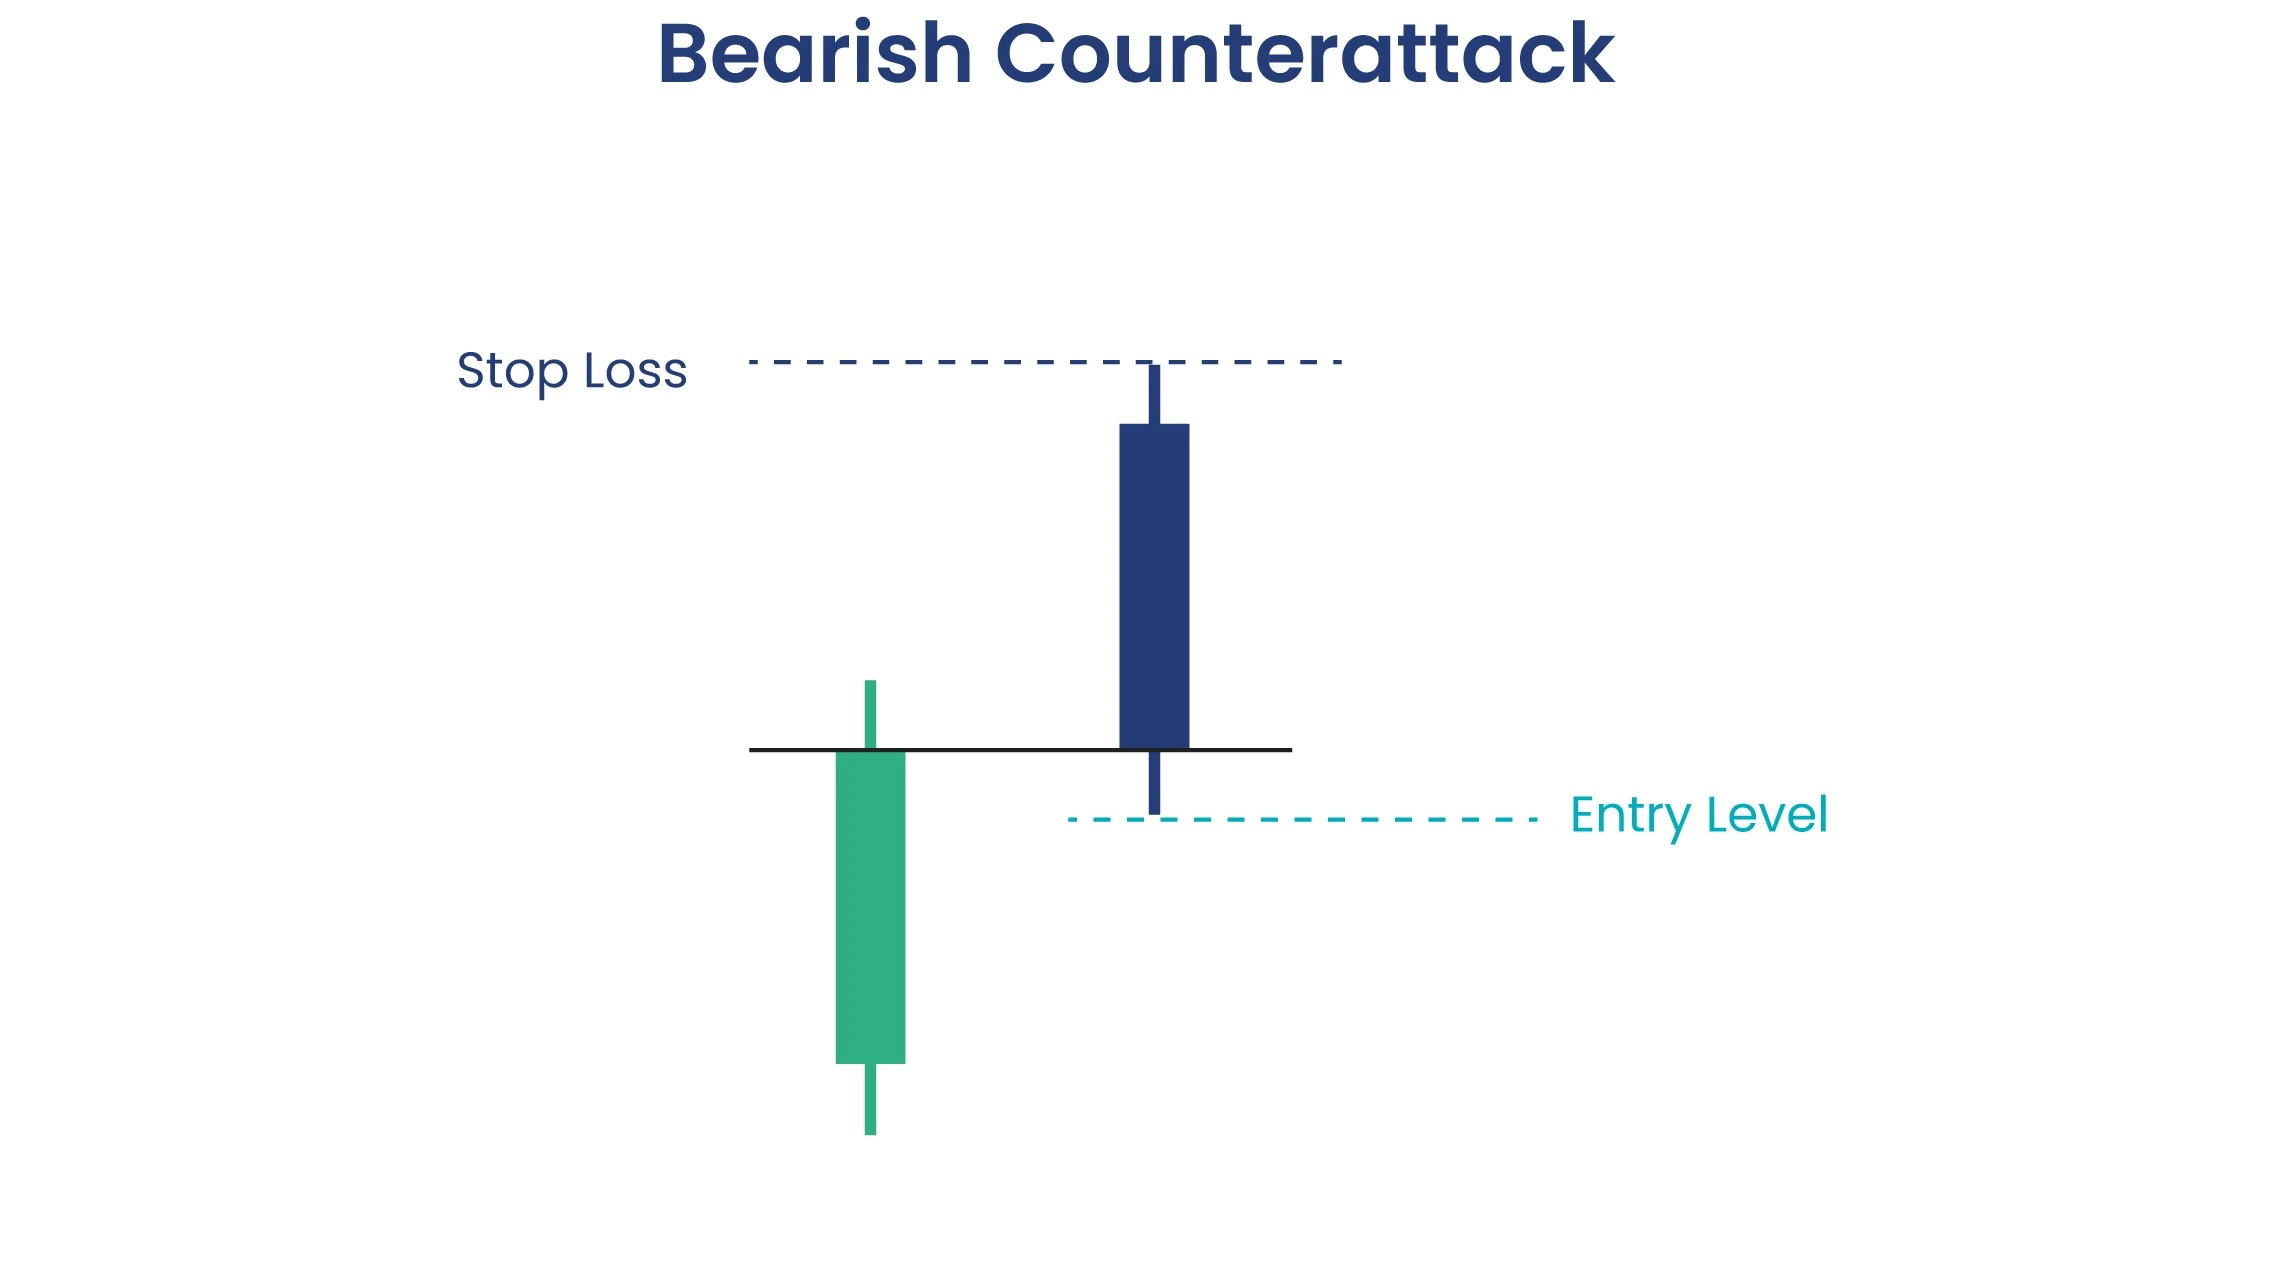
| 29 | Bearish Counterattack Pattern | Bearish Reversal | Bullish candle followed by a bearish candle that closes at the same level, signaling reversal. |
| 30 | Bearish Spinning Top Pattern | Bearish Reversal | Small body with long wicks on both sides, signaling indecision but weakening buying pressure after an uptrend. |
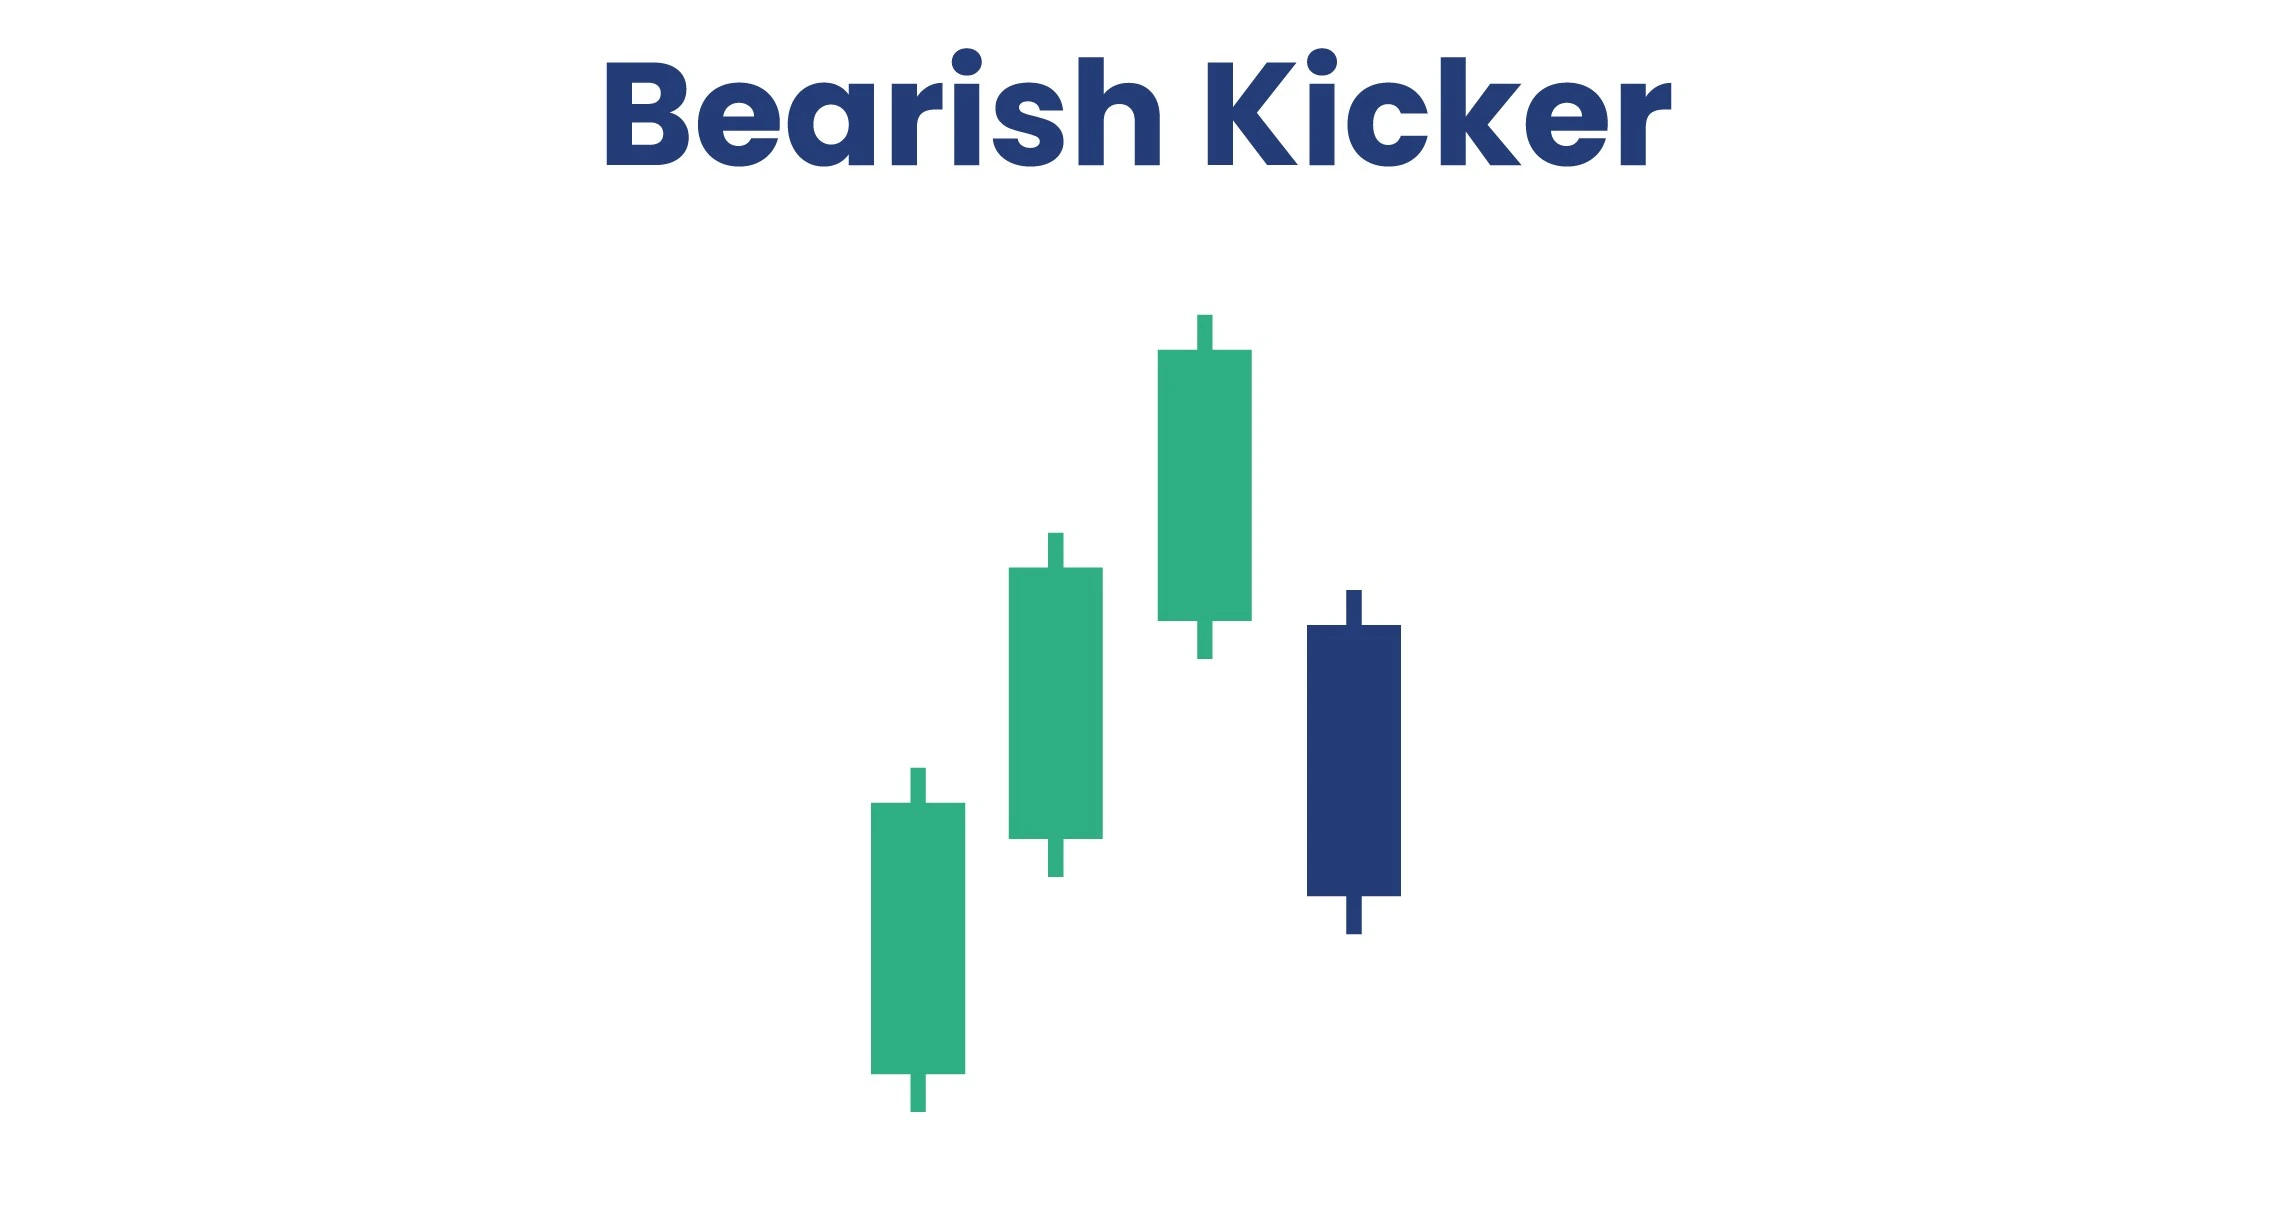
| 31 | Bearish Kicker Pattern | Bearish Reversal | Bullish candle followed by a bearish candle that opens below the previous close, signaling strong reversal. |
| 32 | Evening Star Doji Pattern | Bearish Reversal | Evening star pattern with a doji as the middle candle, signaling indecision before a bearish reversal. |
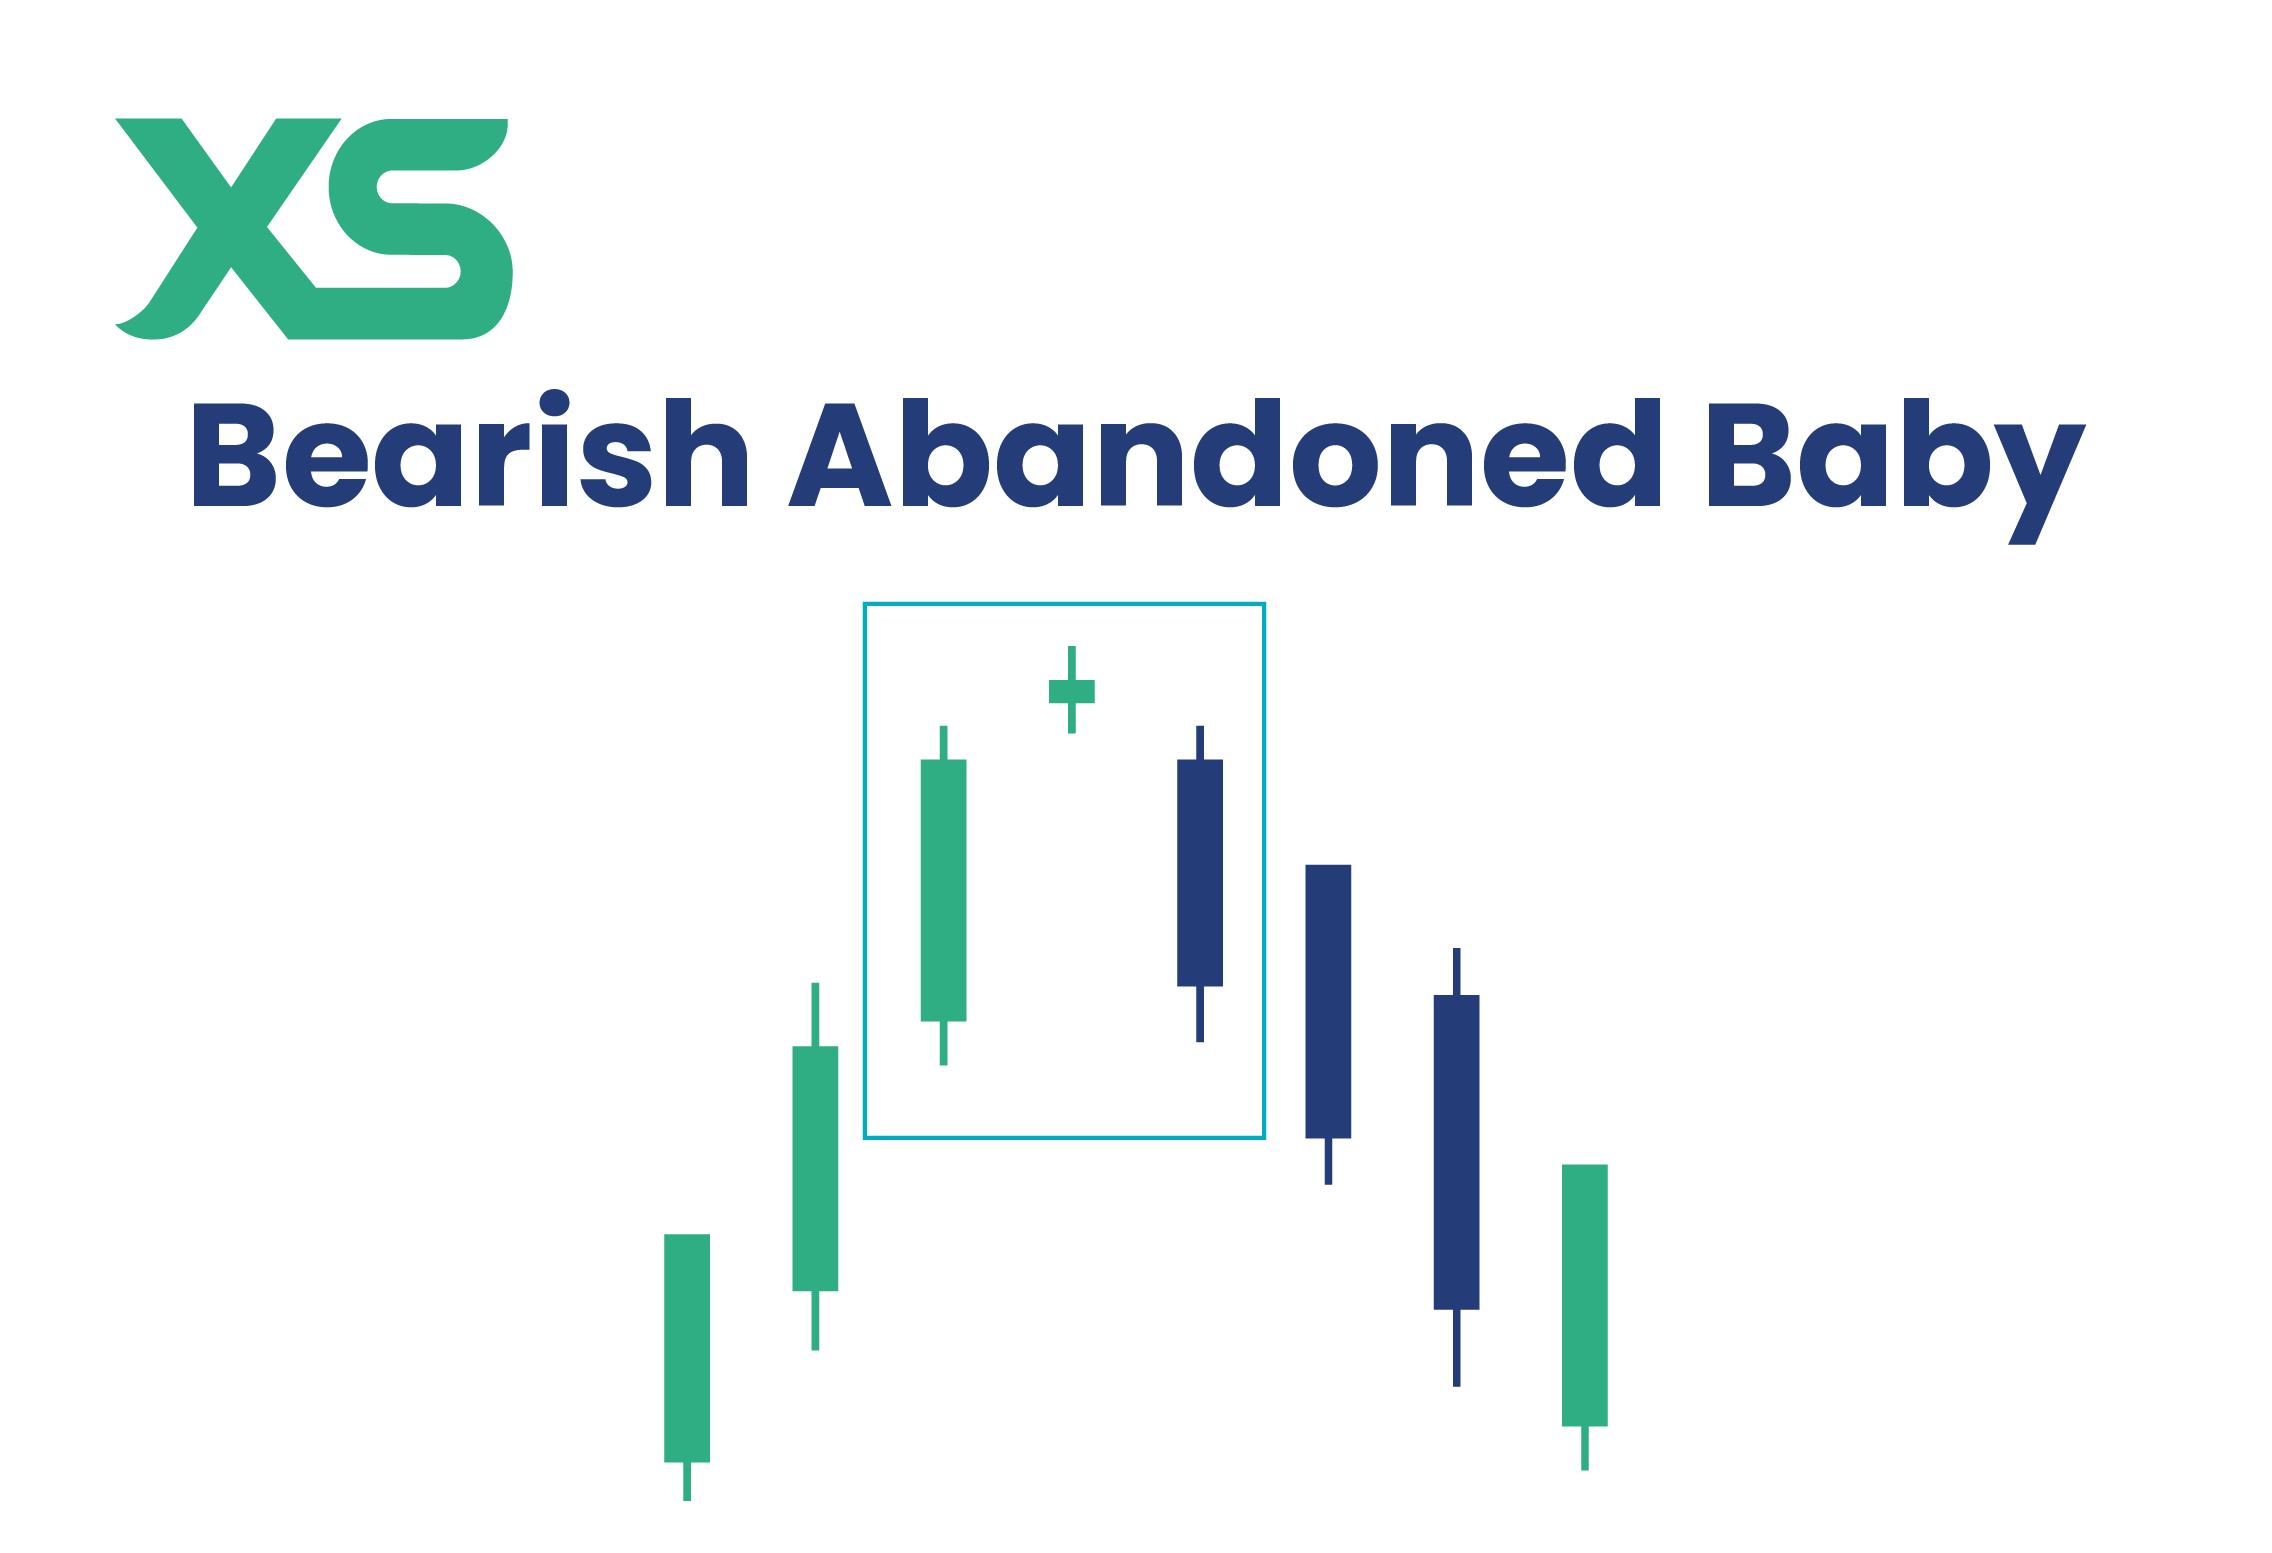
| 33 | Bearish Abandoned Baby Pattern | Bearish Reversal | Three-candle pattern with a long bullish, a doji, and a bearish candle gapping down, signaling strong reversal. |
| 34 | Gravestone Doji Pattern | Bearish Reversal | A doji with a long upper wick, signaling selling pressure overcoming buying at the top of an uptrend. |
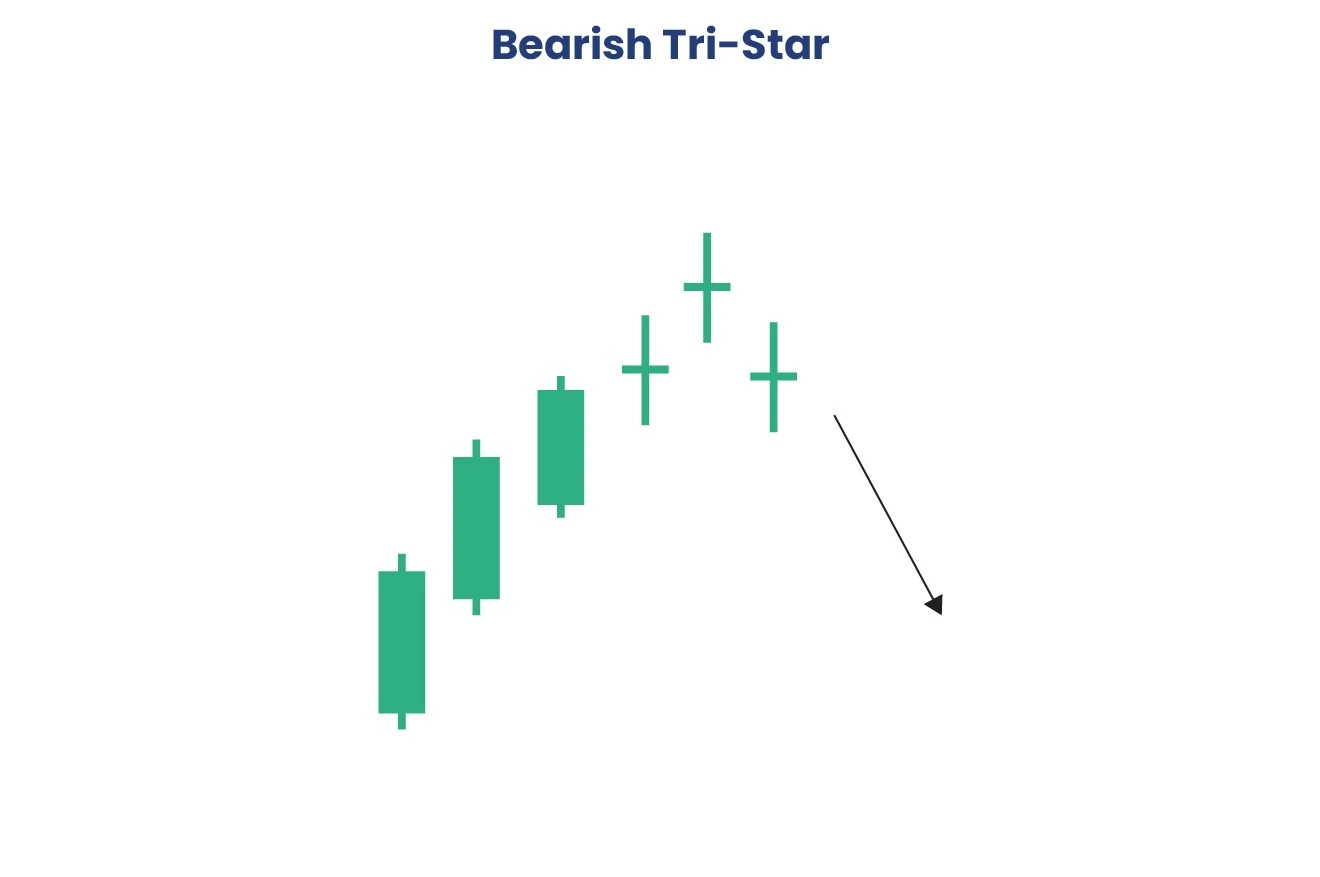
| 35 | Bearish Tri-Star Pattern | Bearish Reversal | Three doji candles in a row, signaling indecision but potential for reversal at the top of an uptrend. |
| 36 | Deliberation Pattern | Bearish Reversal | Three bullish candles progressively getting smaller, signaling weakening buying pressure before a reversal. |
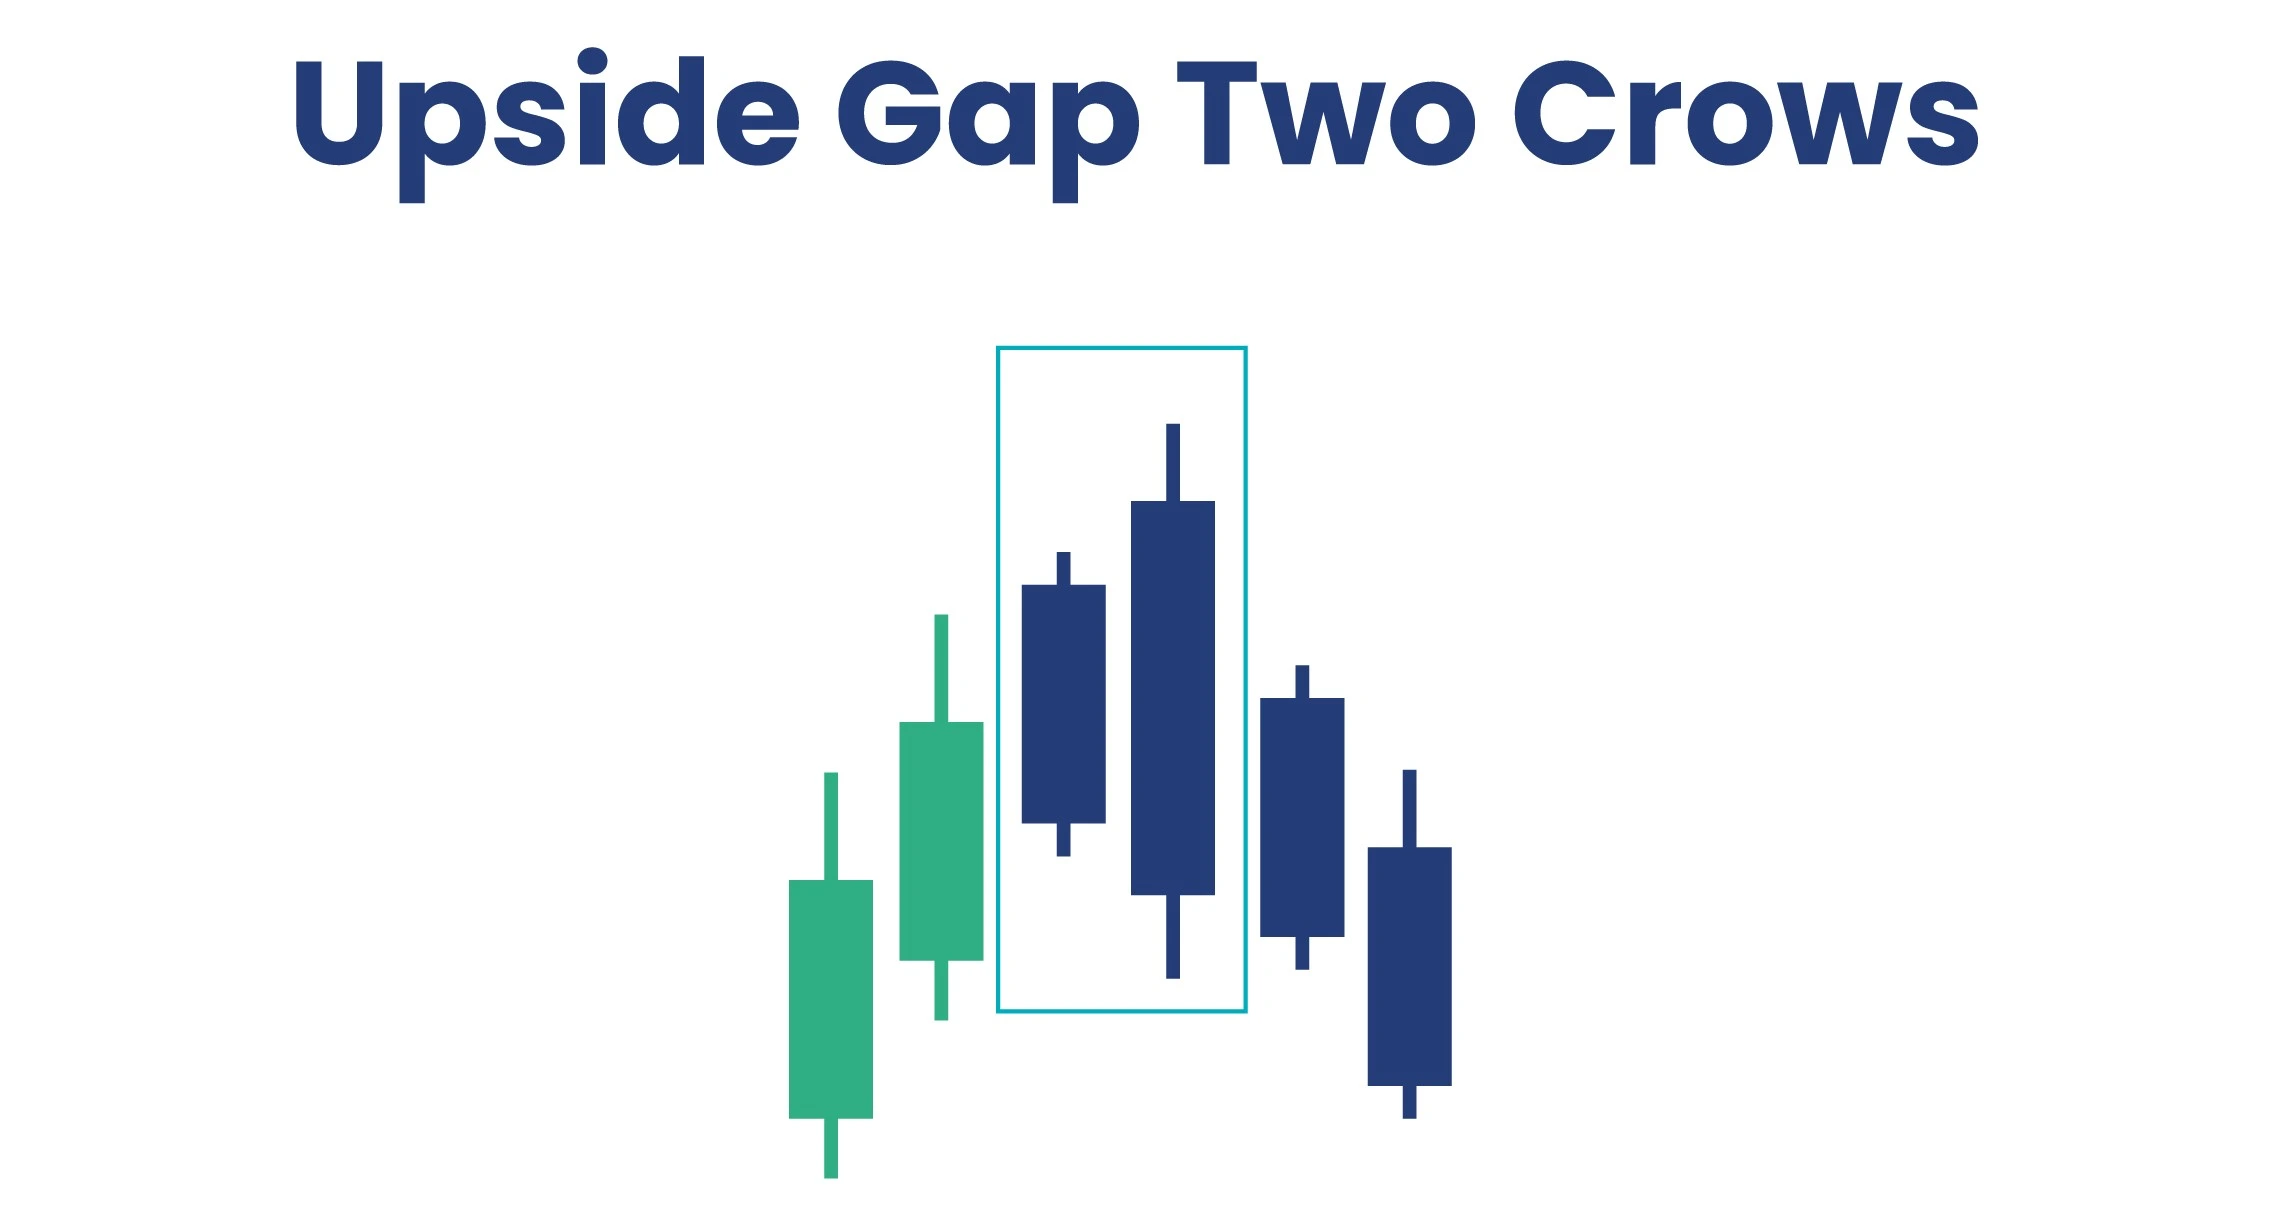
| 37 | Upside Gap Two Crows Pattern | Bearish Reversal | Three-candle bearish pattern with a gap up followed by two bearish candles, signaling trend reversal. |
| 38 | Advance Block Pattern | Bearish Reversal | Three bullish candles progressively getting smaller, signaling weakening buying pressure before reversal. |
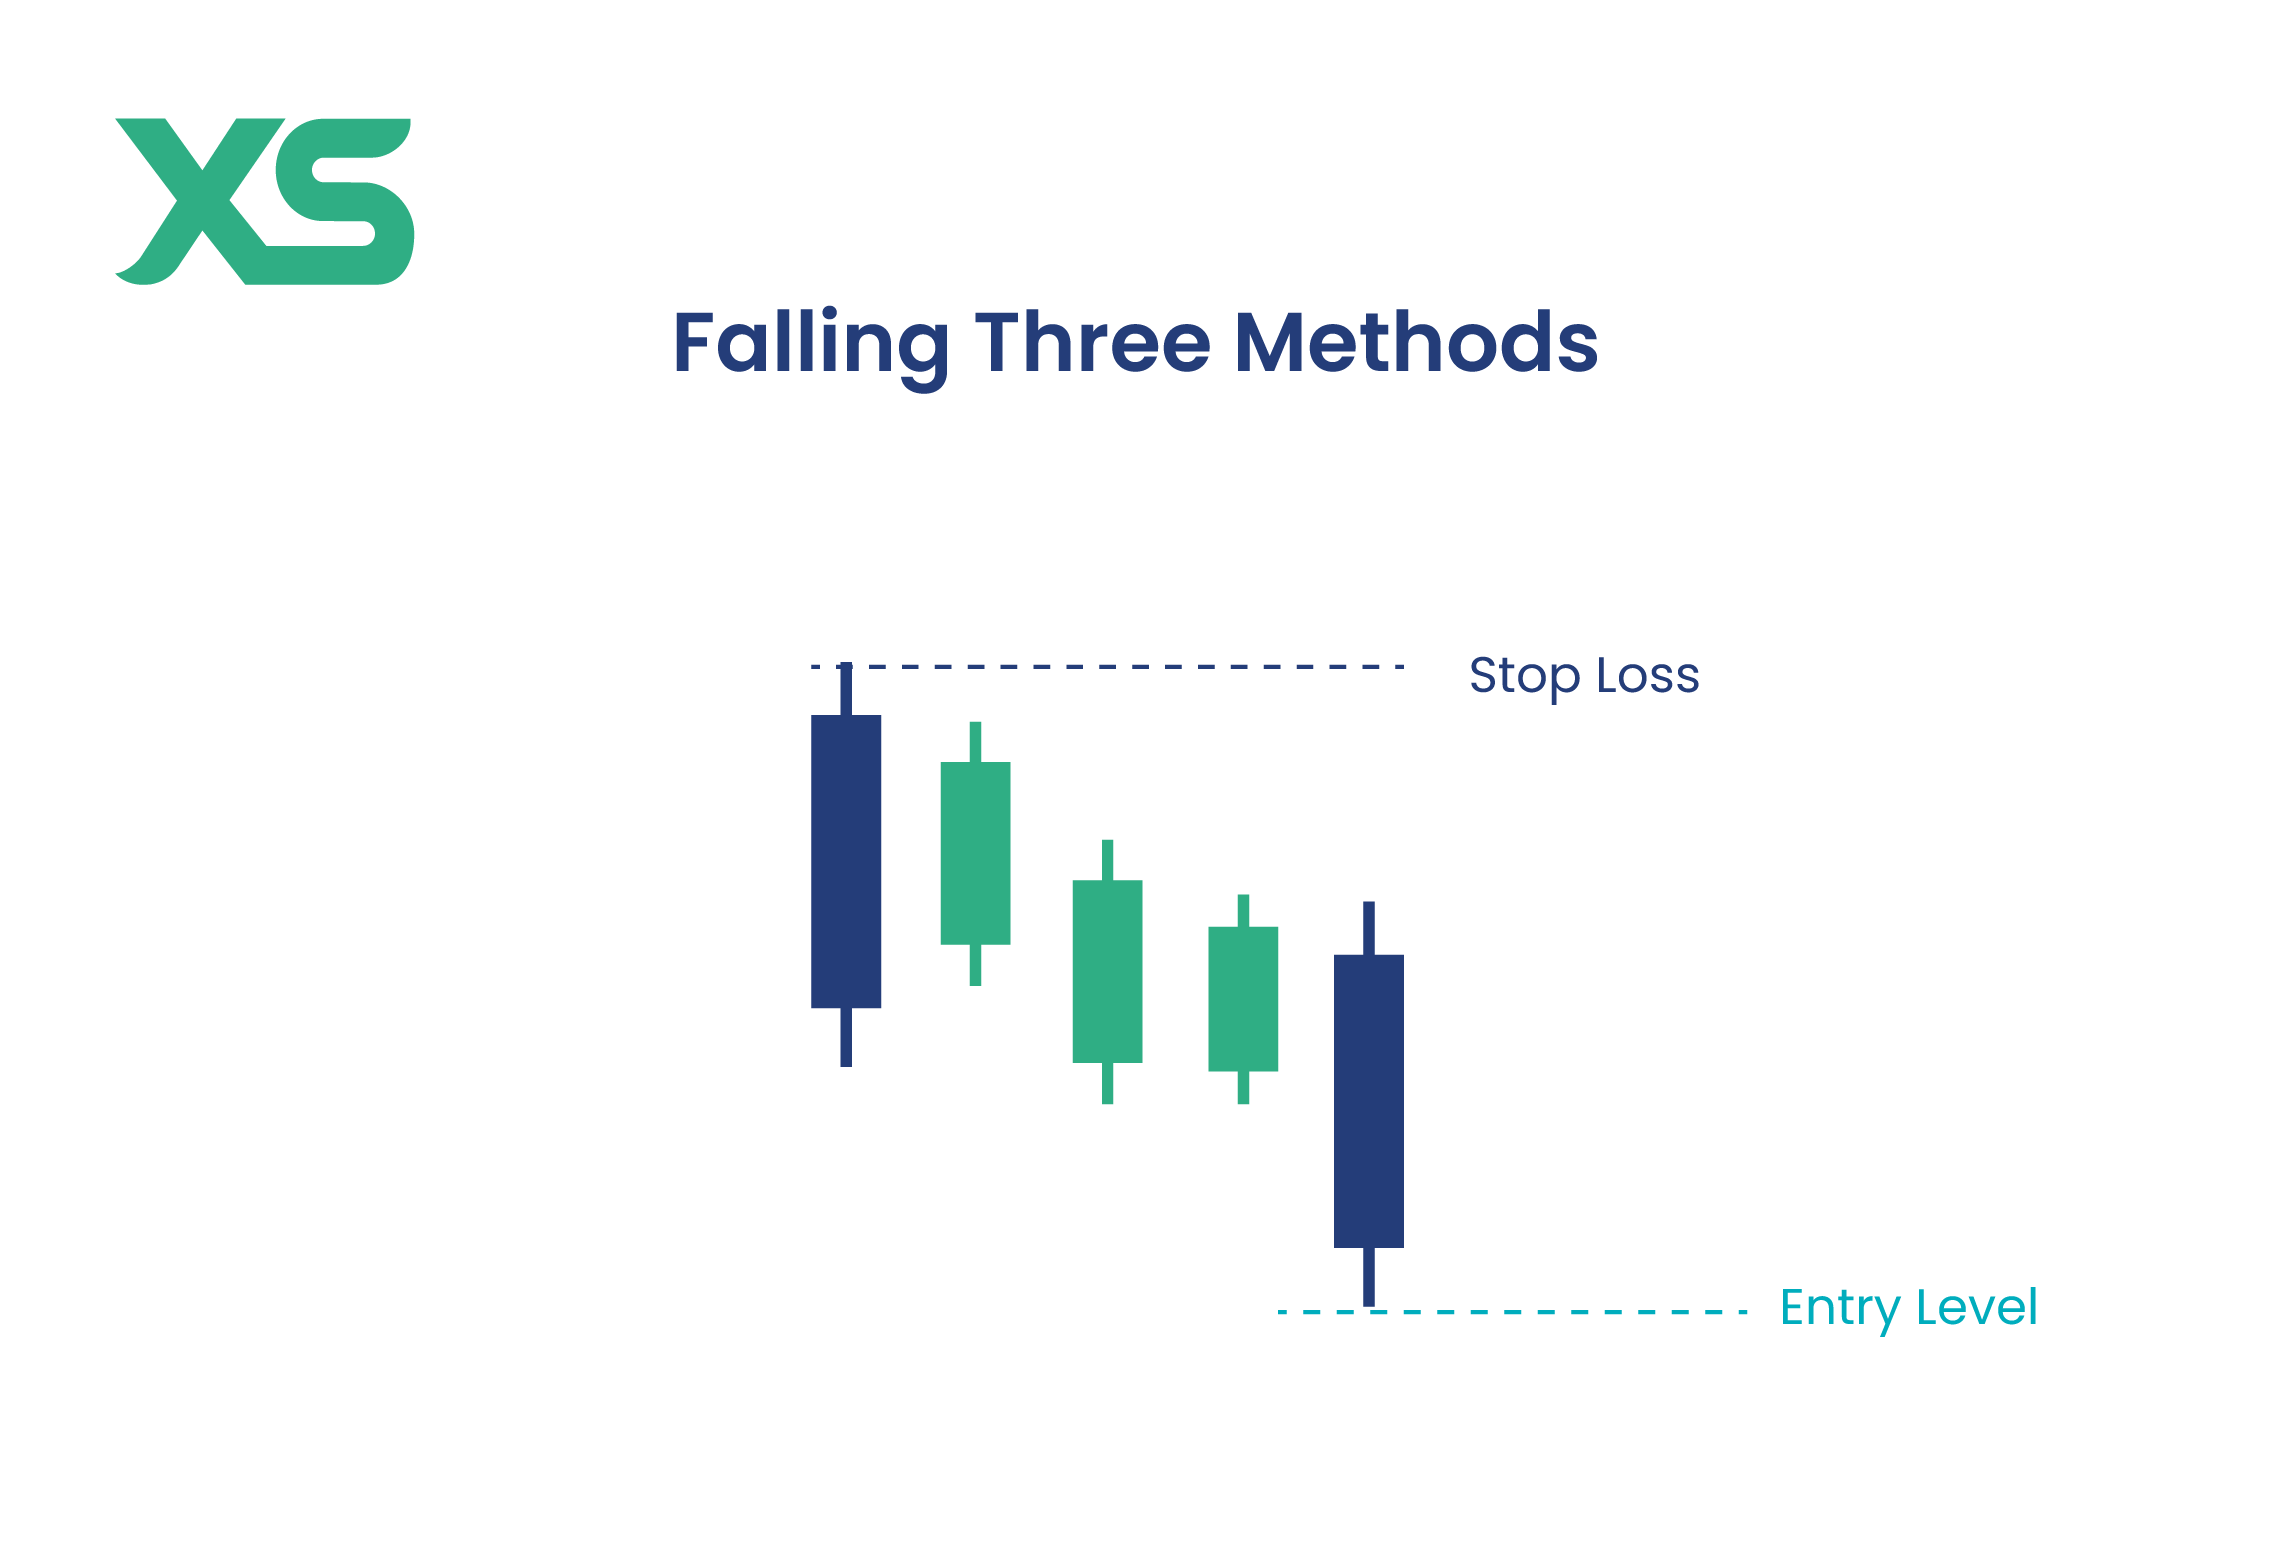
| 39 | Falling Three Methods Pattern | Bearish Continuation | Long bearish candle followed by three smaller bullish candles within its range, and another long bearish candle. |
| 40 | Rising Three Methods Pattern | Bullish Continuation | Long bullish candle followed by three smaller bearish candles within its range, and another long bullish candle. |
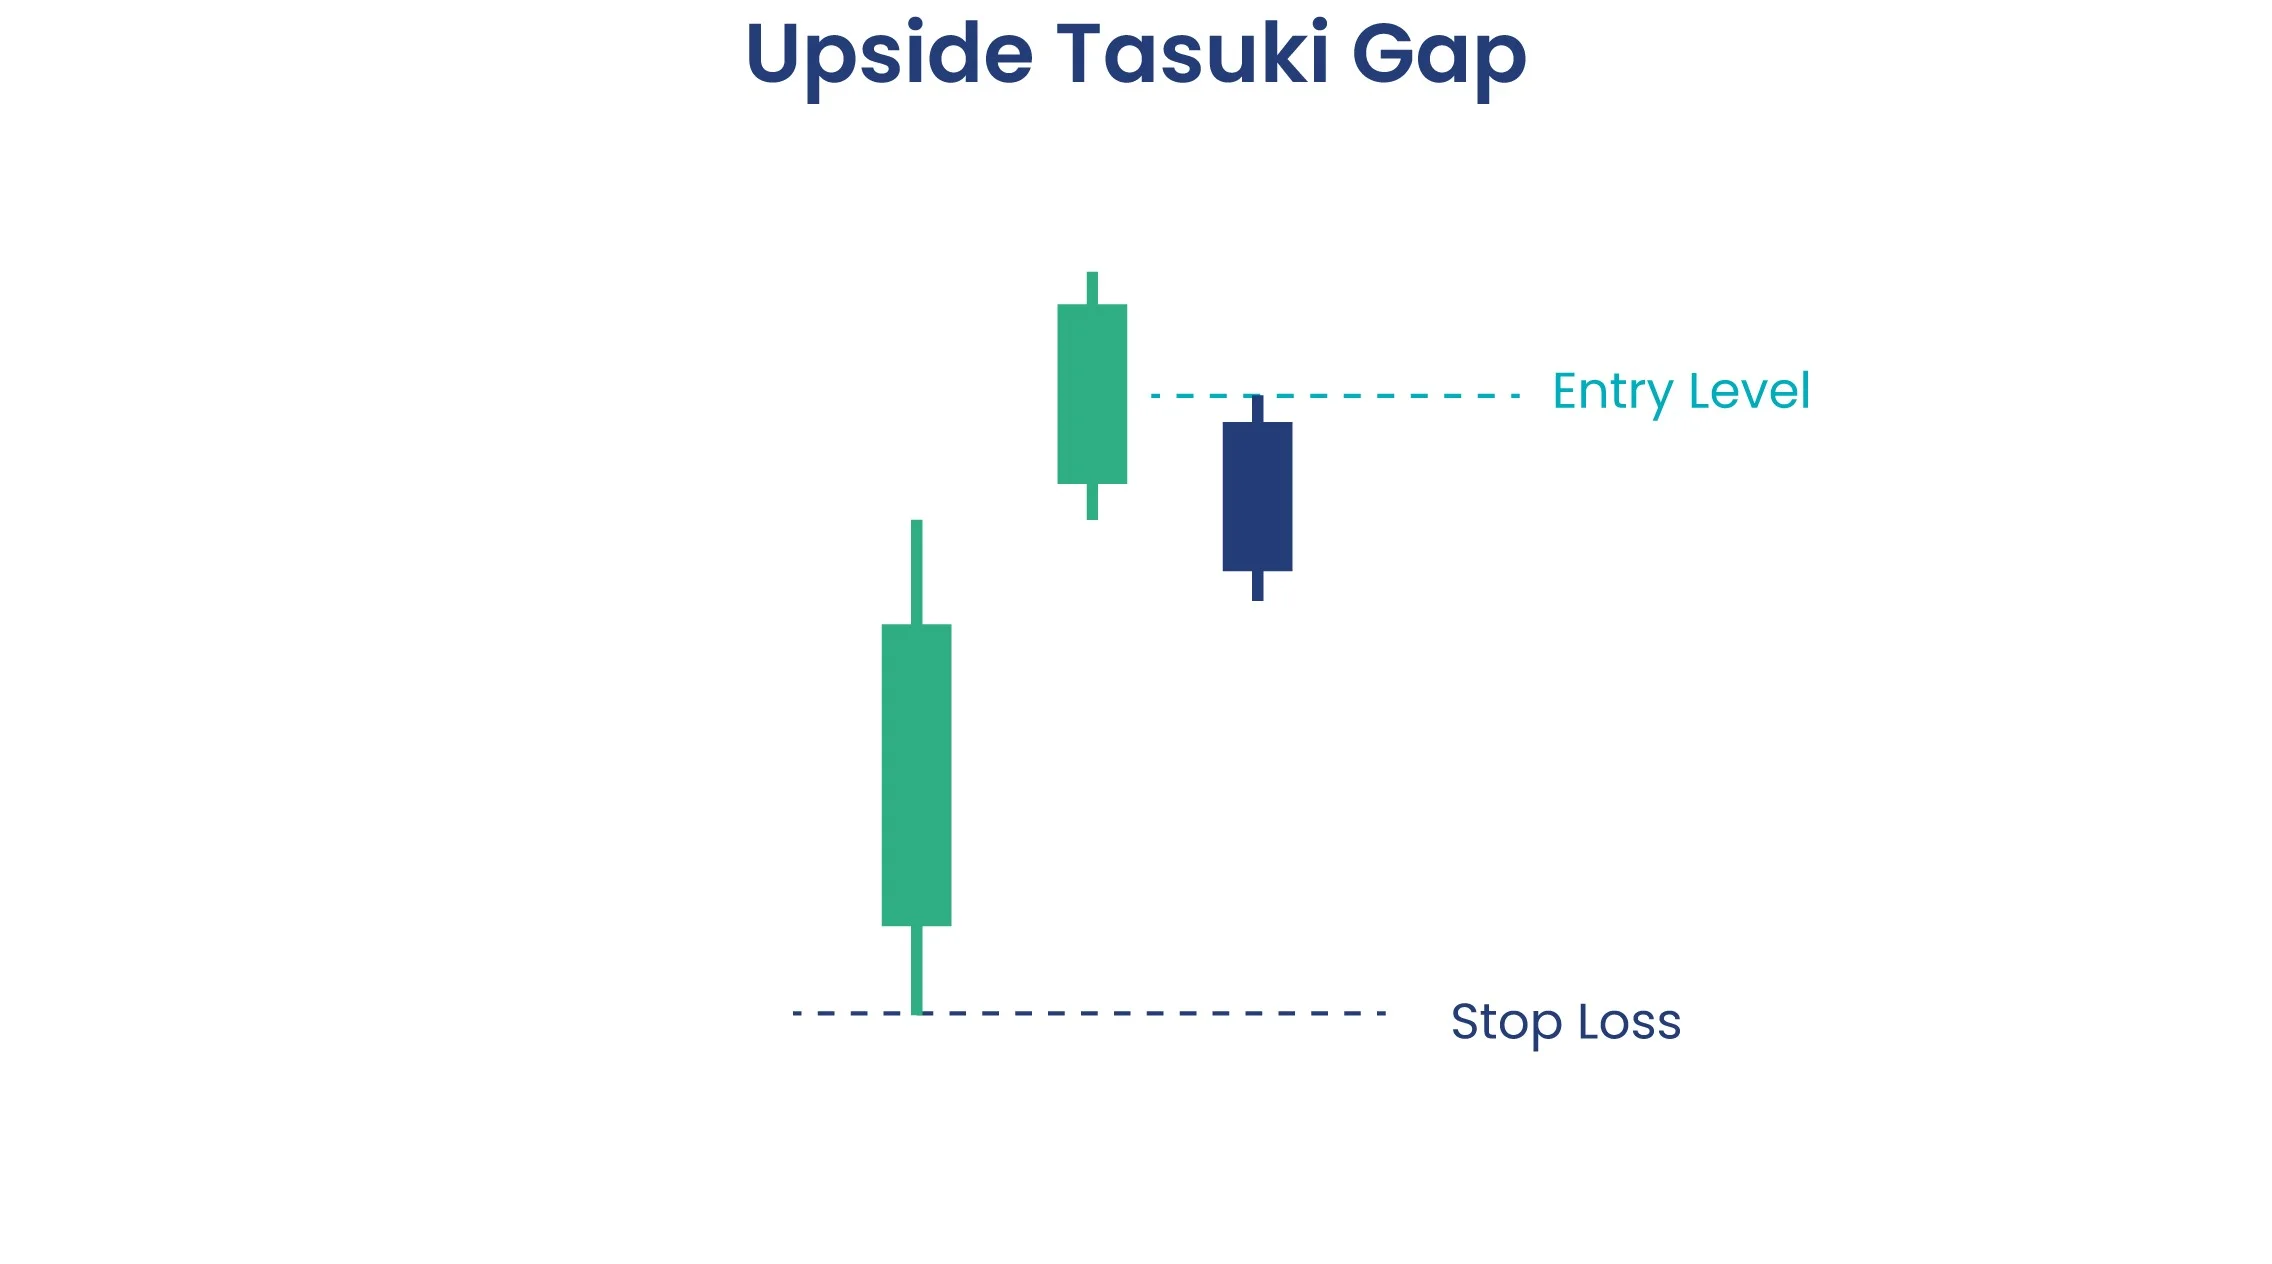
| 41 | Upside Tasuki Gap Pattern | Bullish Continuation | A bullish candlestick gaps up from the previous one, followed by a bearish candlestick that partially fills the gap. |
| 42 | Downside Tasuki Gap Pattern | Bearish Continuation | A bearish candlestick gaps down from the previous one, followed by a bullish candlestick that partially fills the gap. |
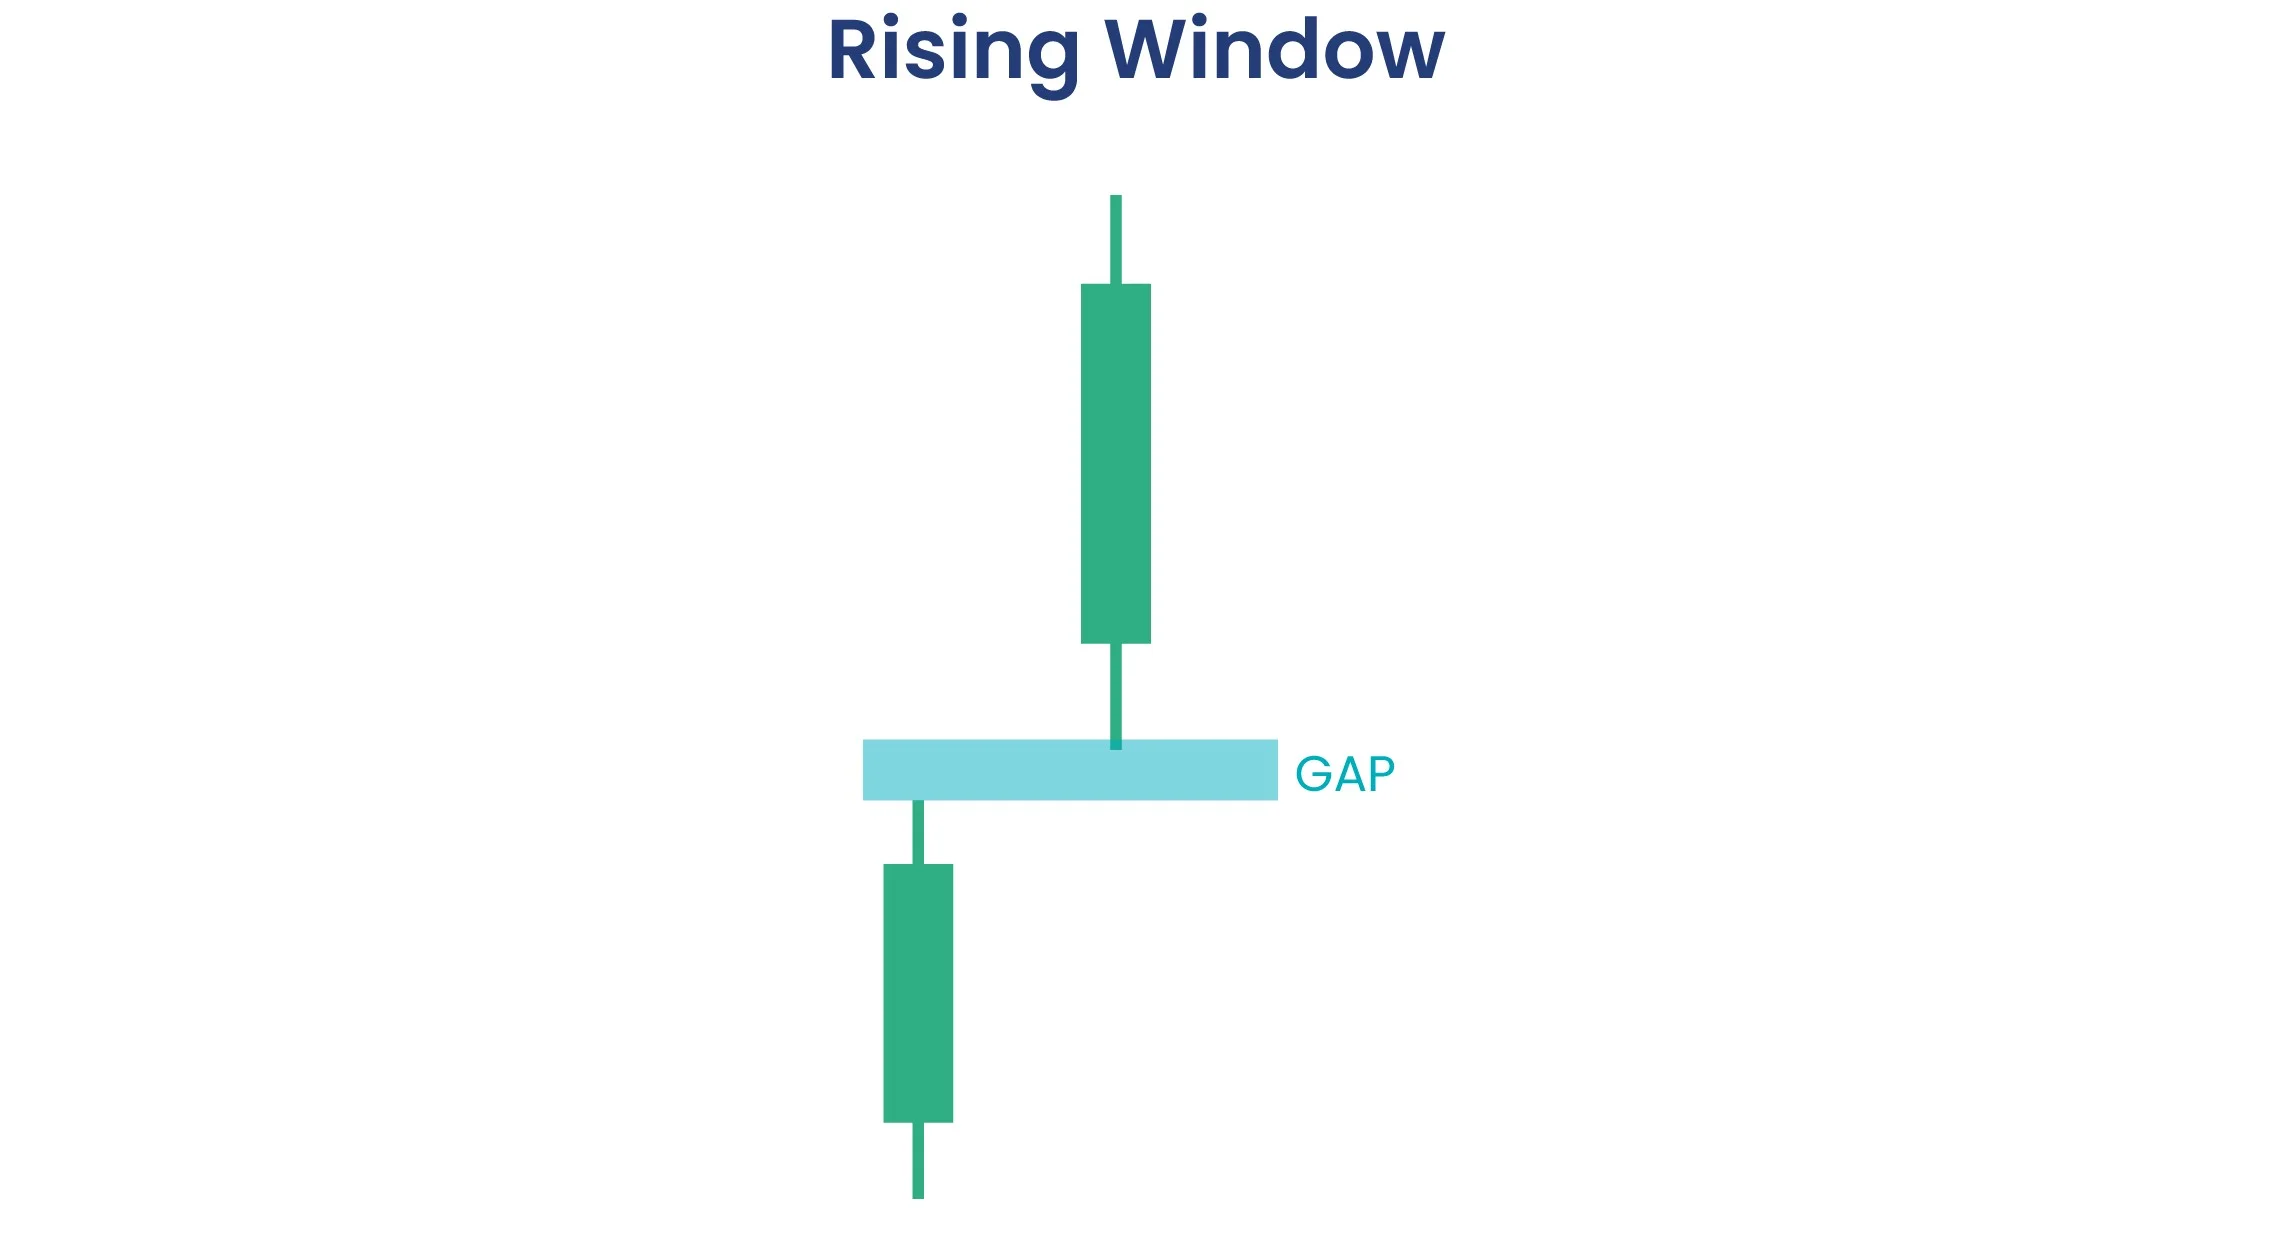
| 43 | Rising Window Pattern | Bullish Continuation | Gap between two bullish candles, indicating strong buying pressure and continuation of the uptrend. |
| 44 | Falling Window Pattern | Bearish Continuation | Gap between two bearish candles, indicating strong selling pressure and continuation of the downtrend. |
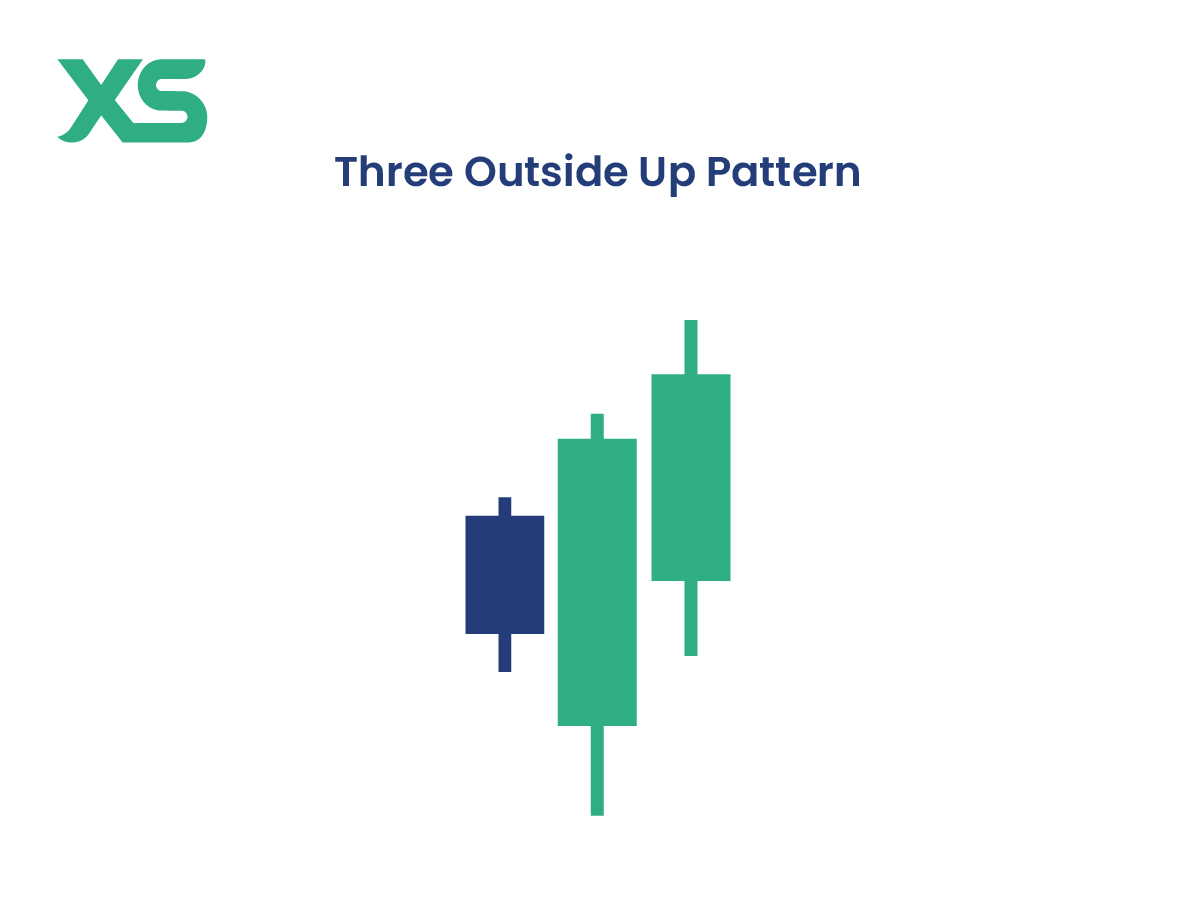
| 45 | Three Outside Up Pattern | Bullish Continuation | A bearish candle followed by a larger bullish candle that engulfs it, and another bullish candle closing higher. |
| 46 | Three Outside Down Pattern | Bearish Continuation | A bullish candle followed by a larger bearish candle that engulfs it, and another bearish candle closing lower. |
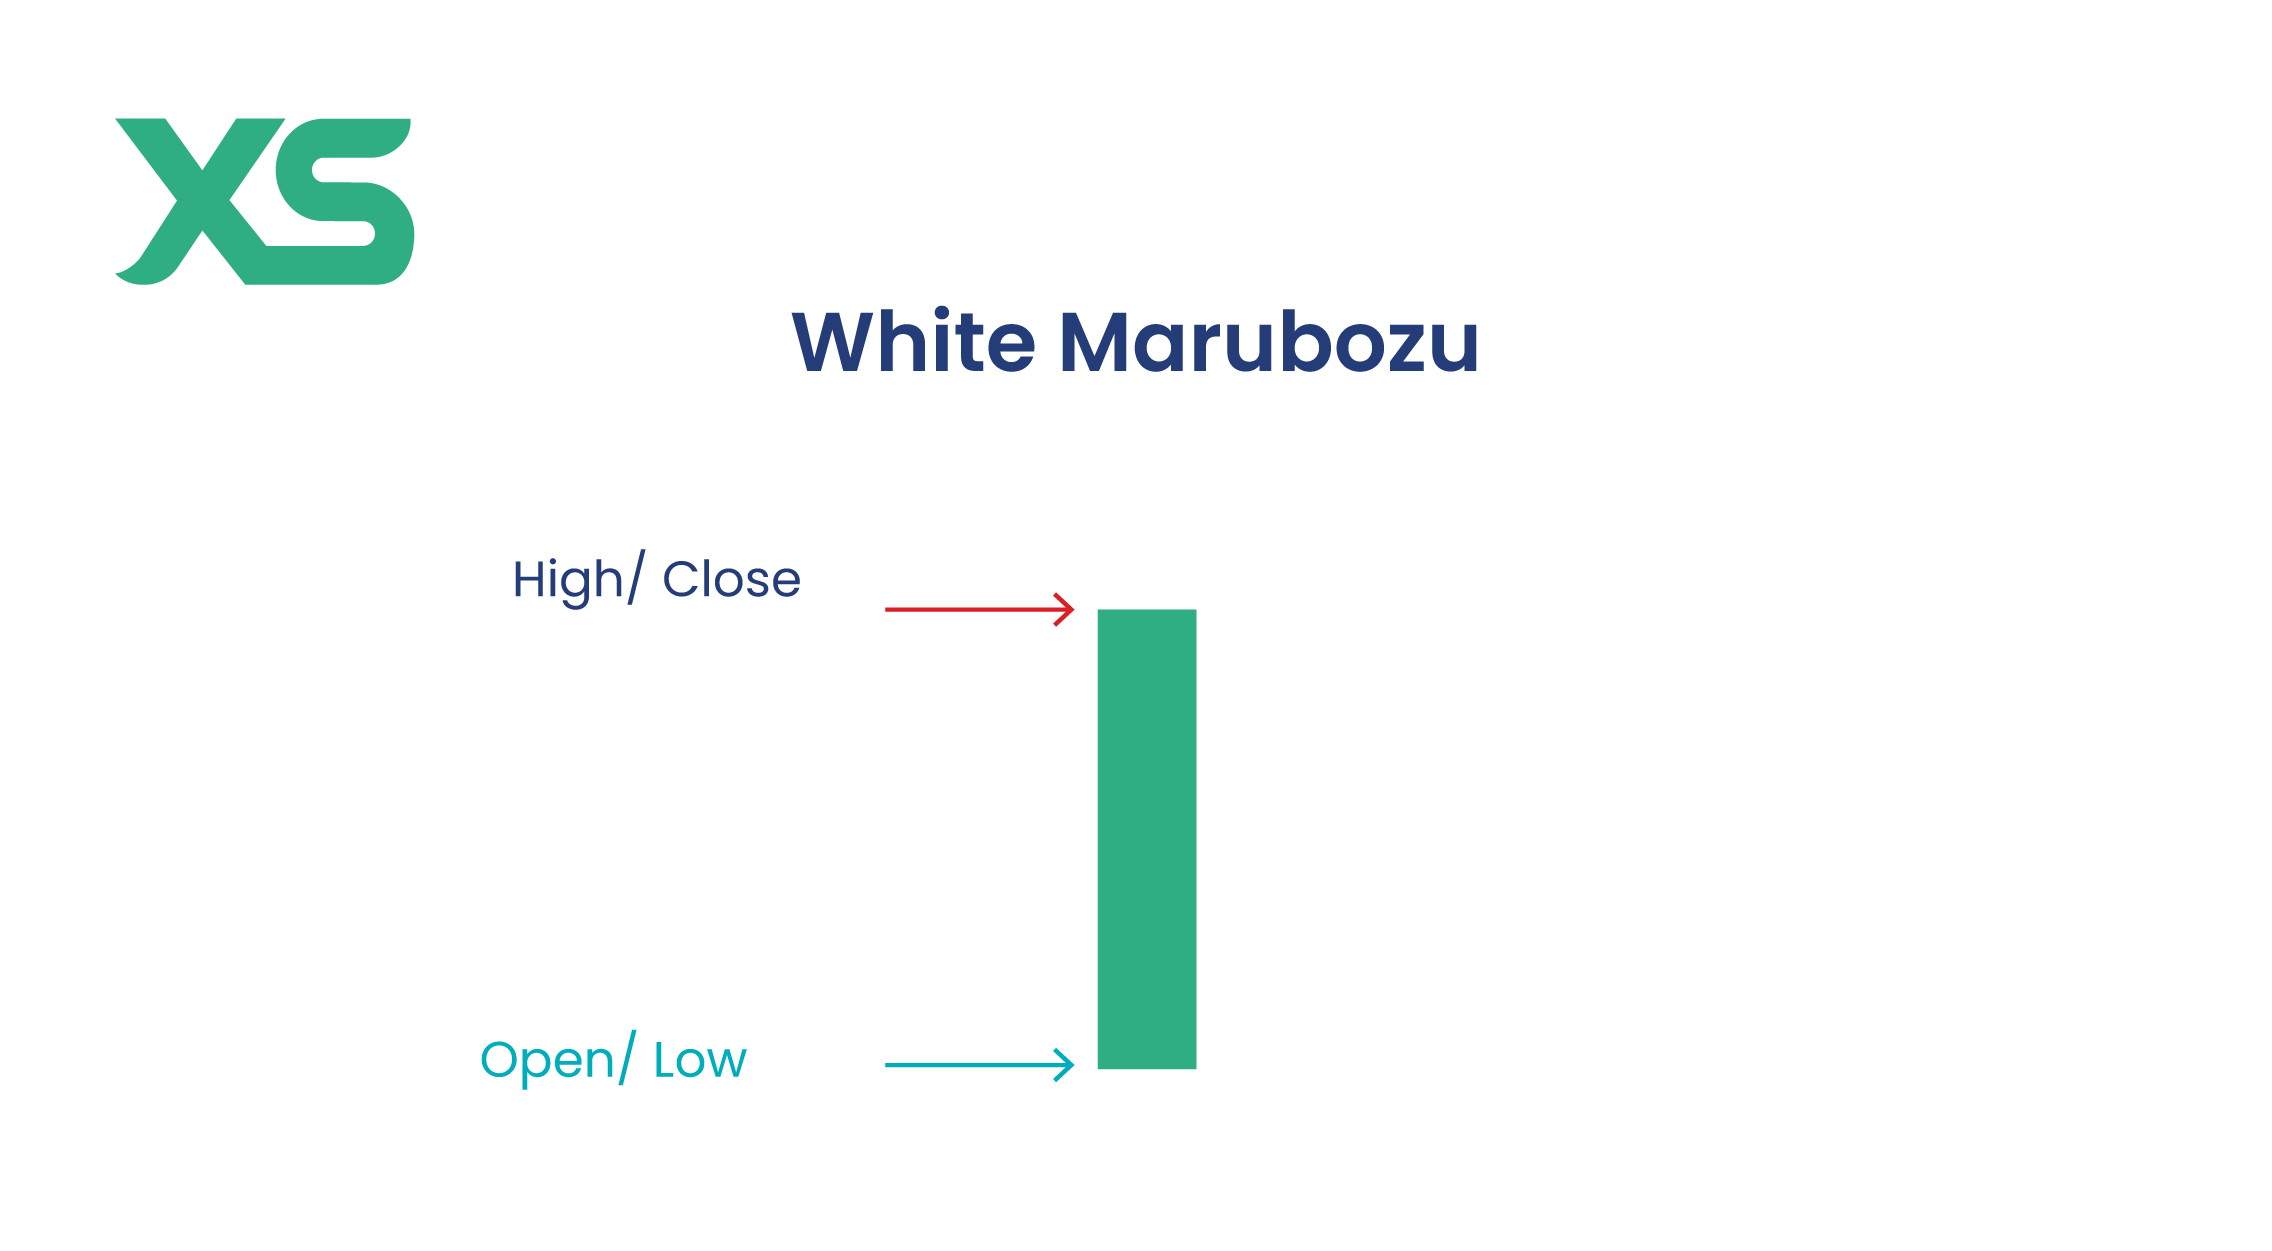
| 47 | White Marubozu Pattern | Bullish Continuation | Bullish candle with no wicks, opening at its low and closing at its high, indicating strong buying pressure. |
| 48 | Black Marubozu Pattern | Bearish Continuation | Bearish candle with no wicks, opening at its high and closing at its low, indicating strong selling pressure. |
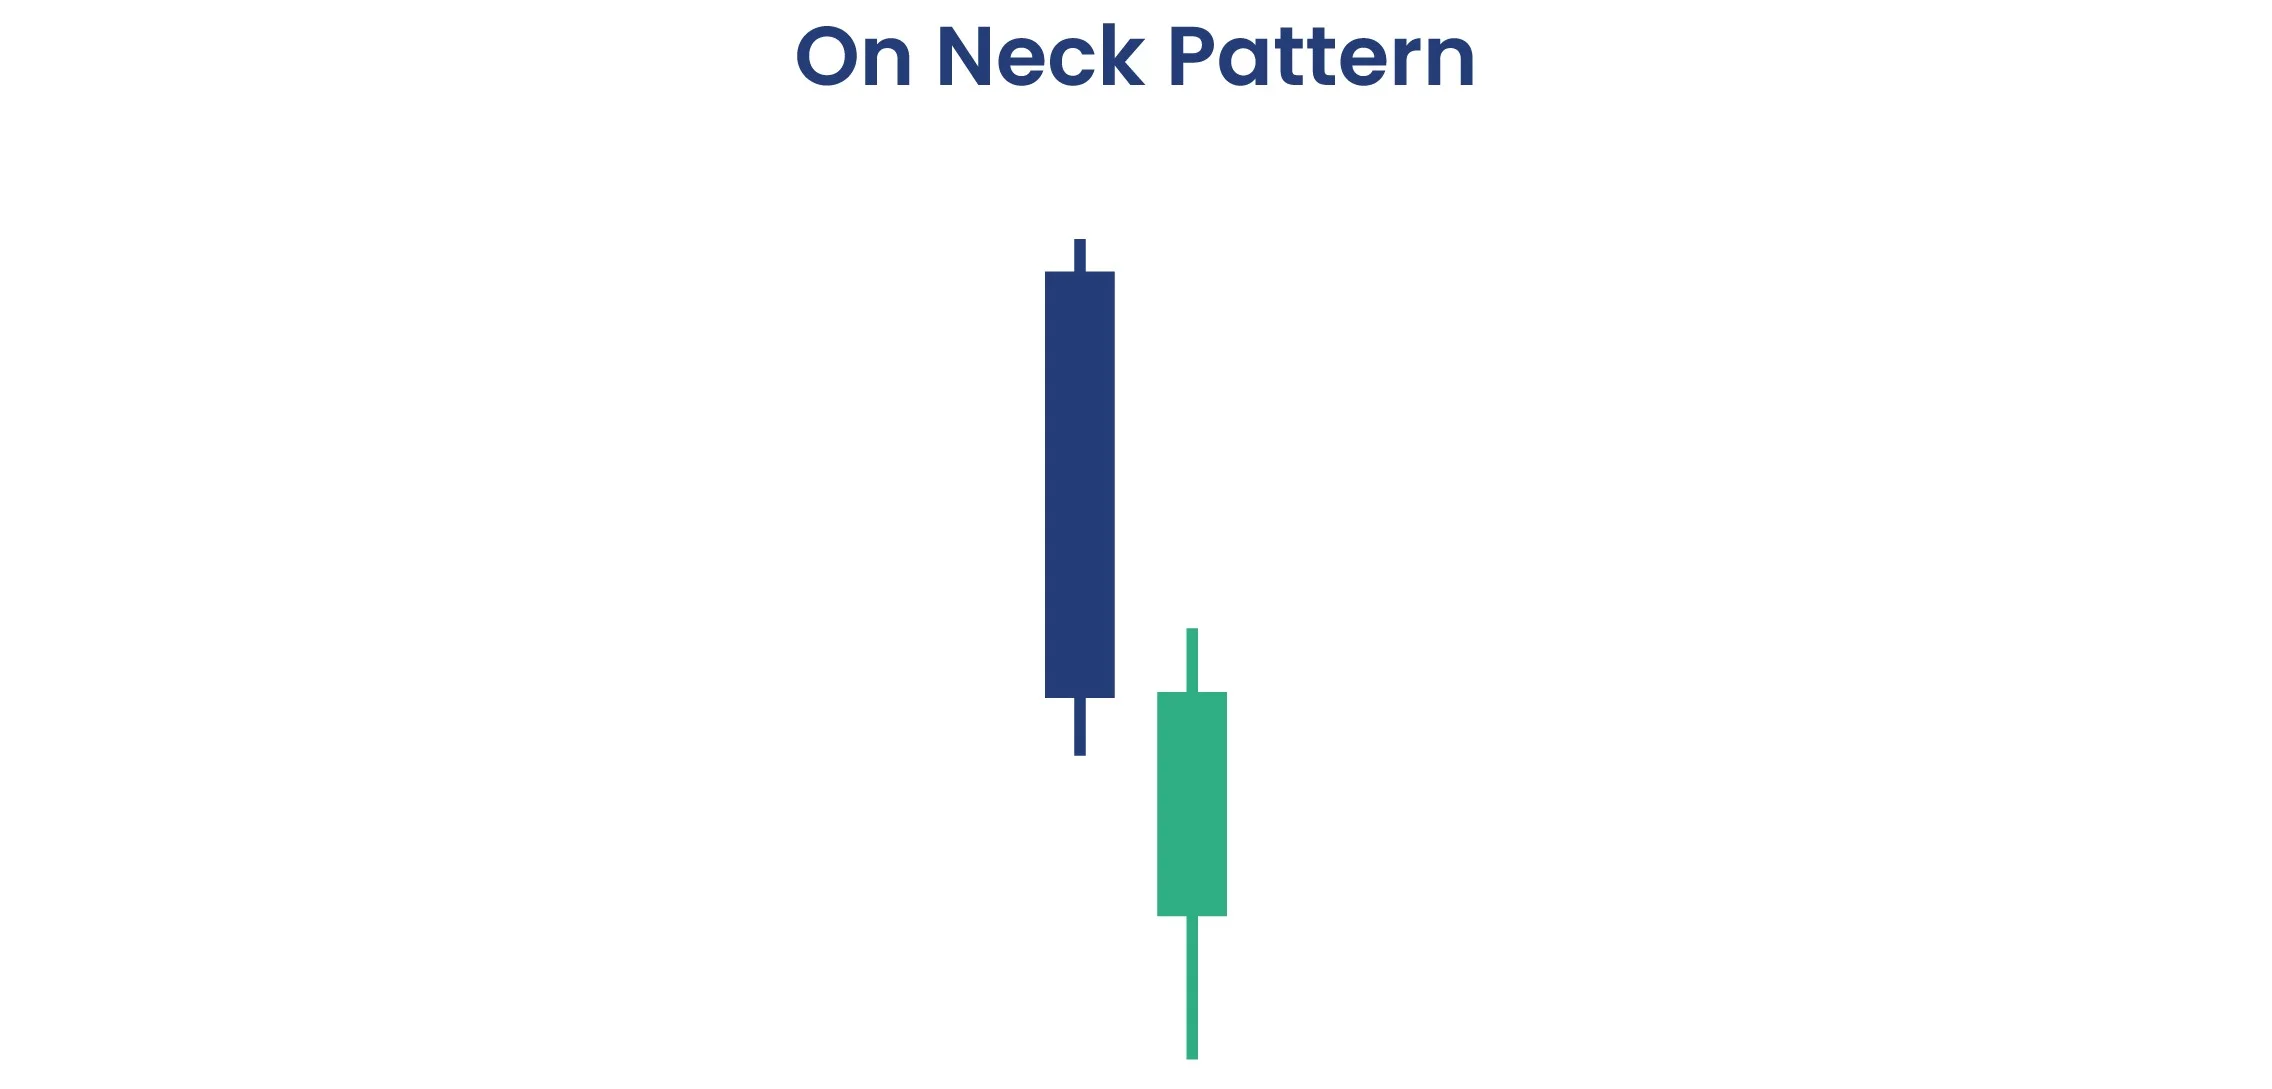
| 49 | On-Neck Pattern | Bearish Continuation | A bearish candle followed by a smaller bullish candle closing near the low of the previous candle. |
| 50 | Mat-Hold Pattern | Bullish Continuation | A long bullish candle followed by three smaller bearish candles, and then another bullish candle closing higher. |
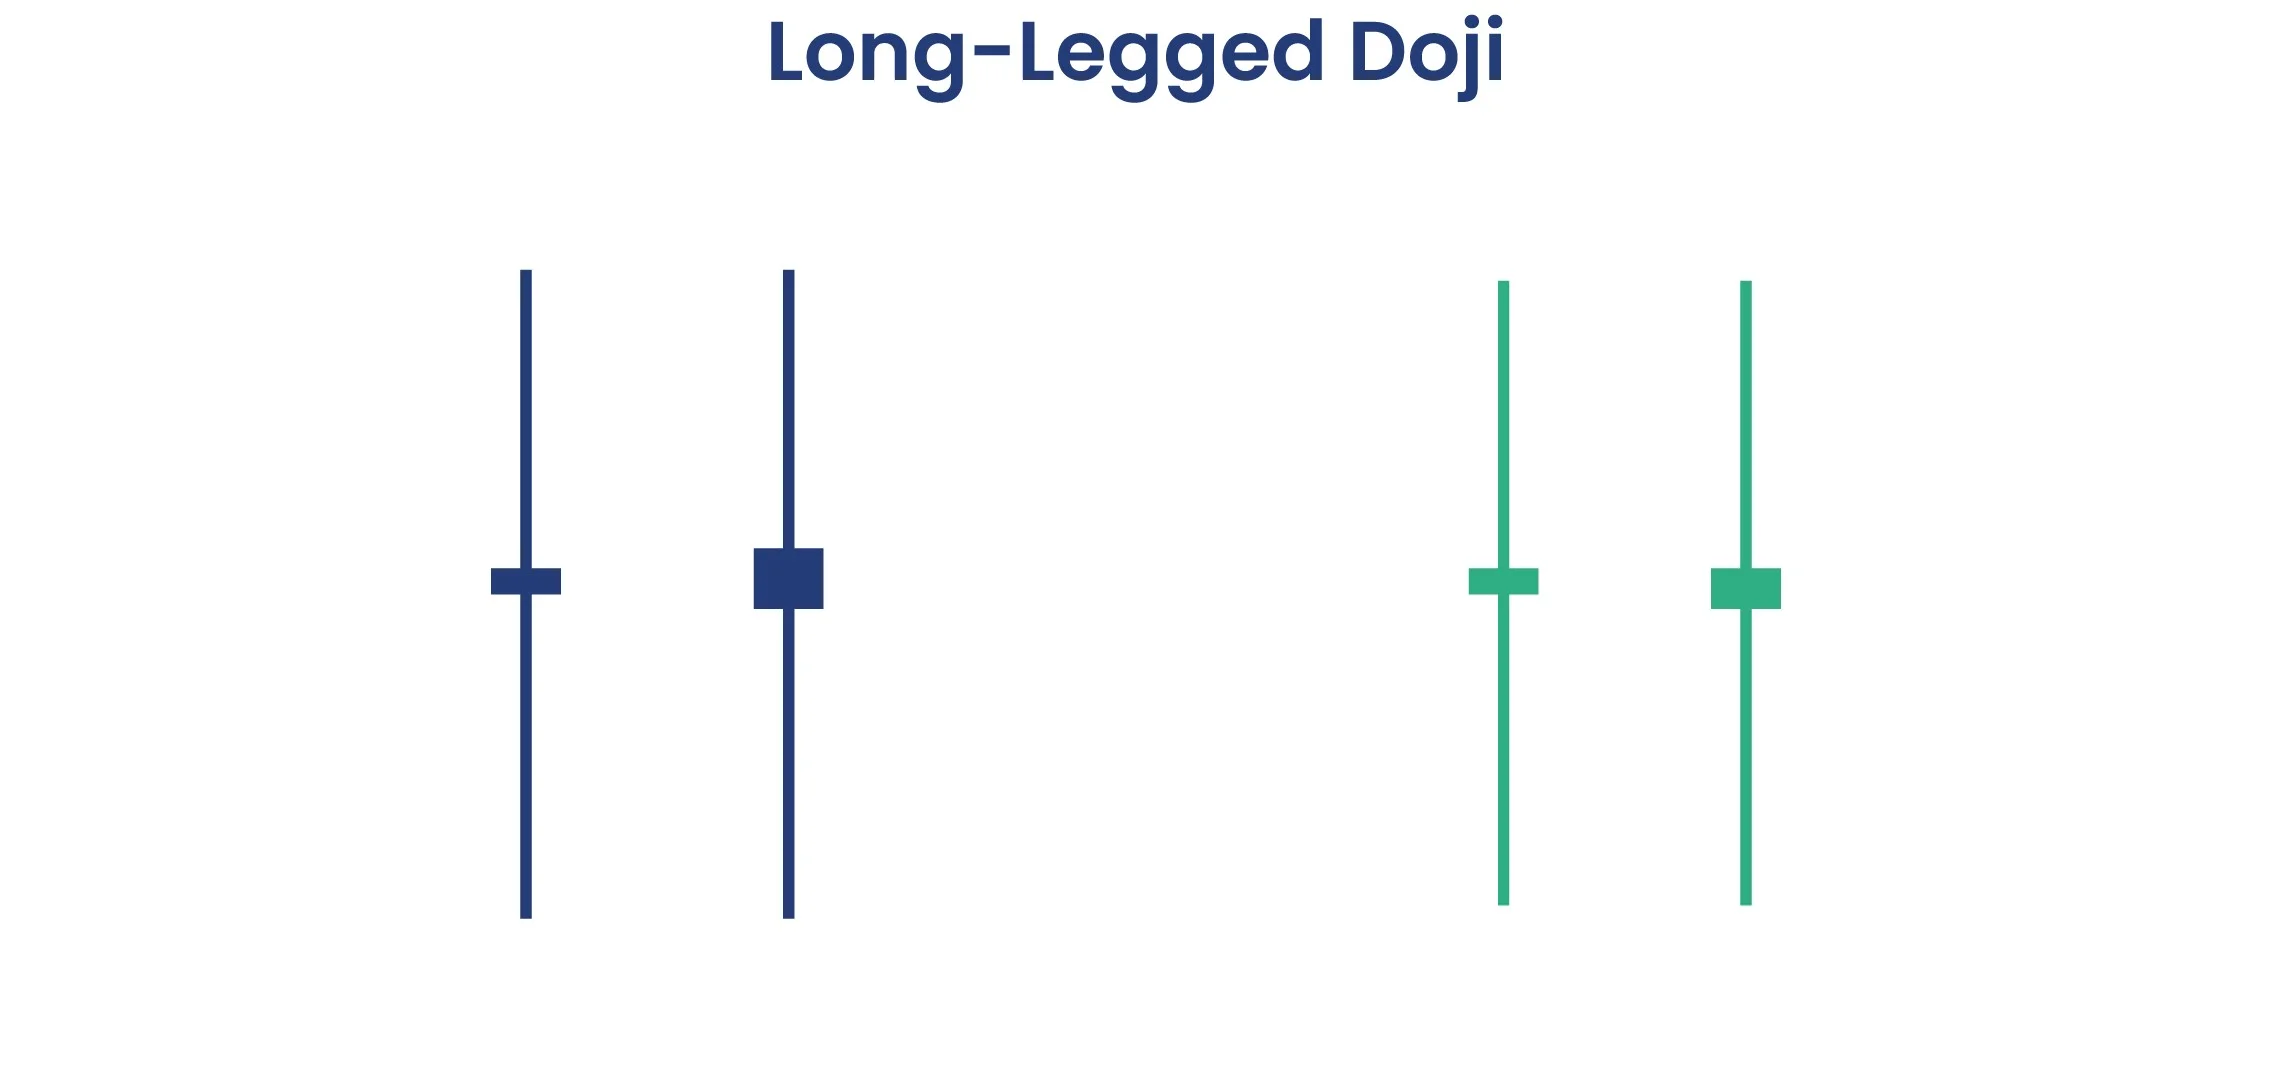
| 51 | Long Legged Doji Pattern | Neutral | A small body with long wicks on both sides, signaling volatility and indecision in the market. |
| 52 | Cup and Handle Pattern | Bullish | Indicates a continuation of an uptrend; shaped like a teacup with a handle. |
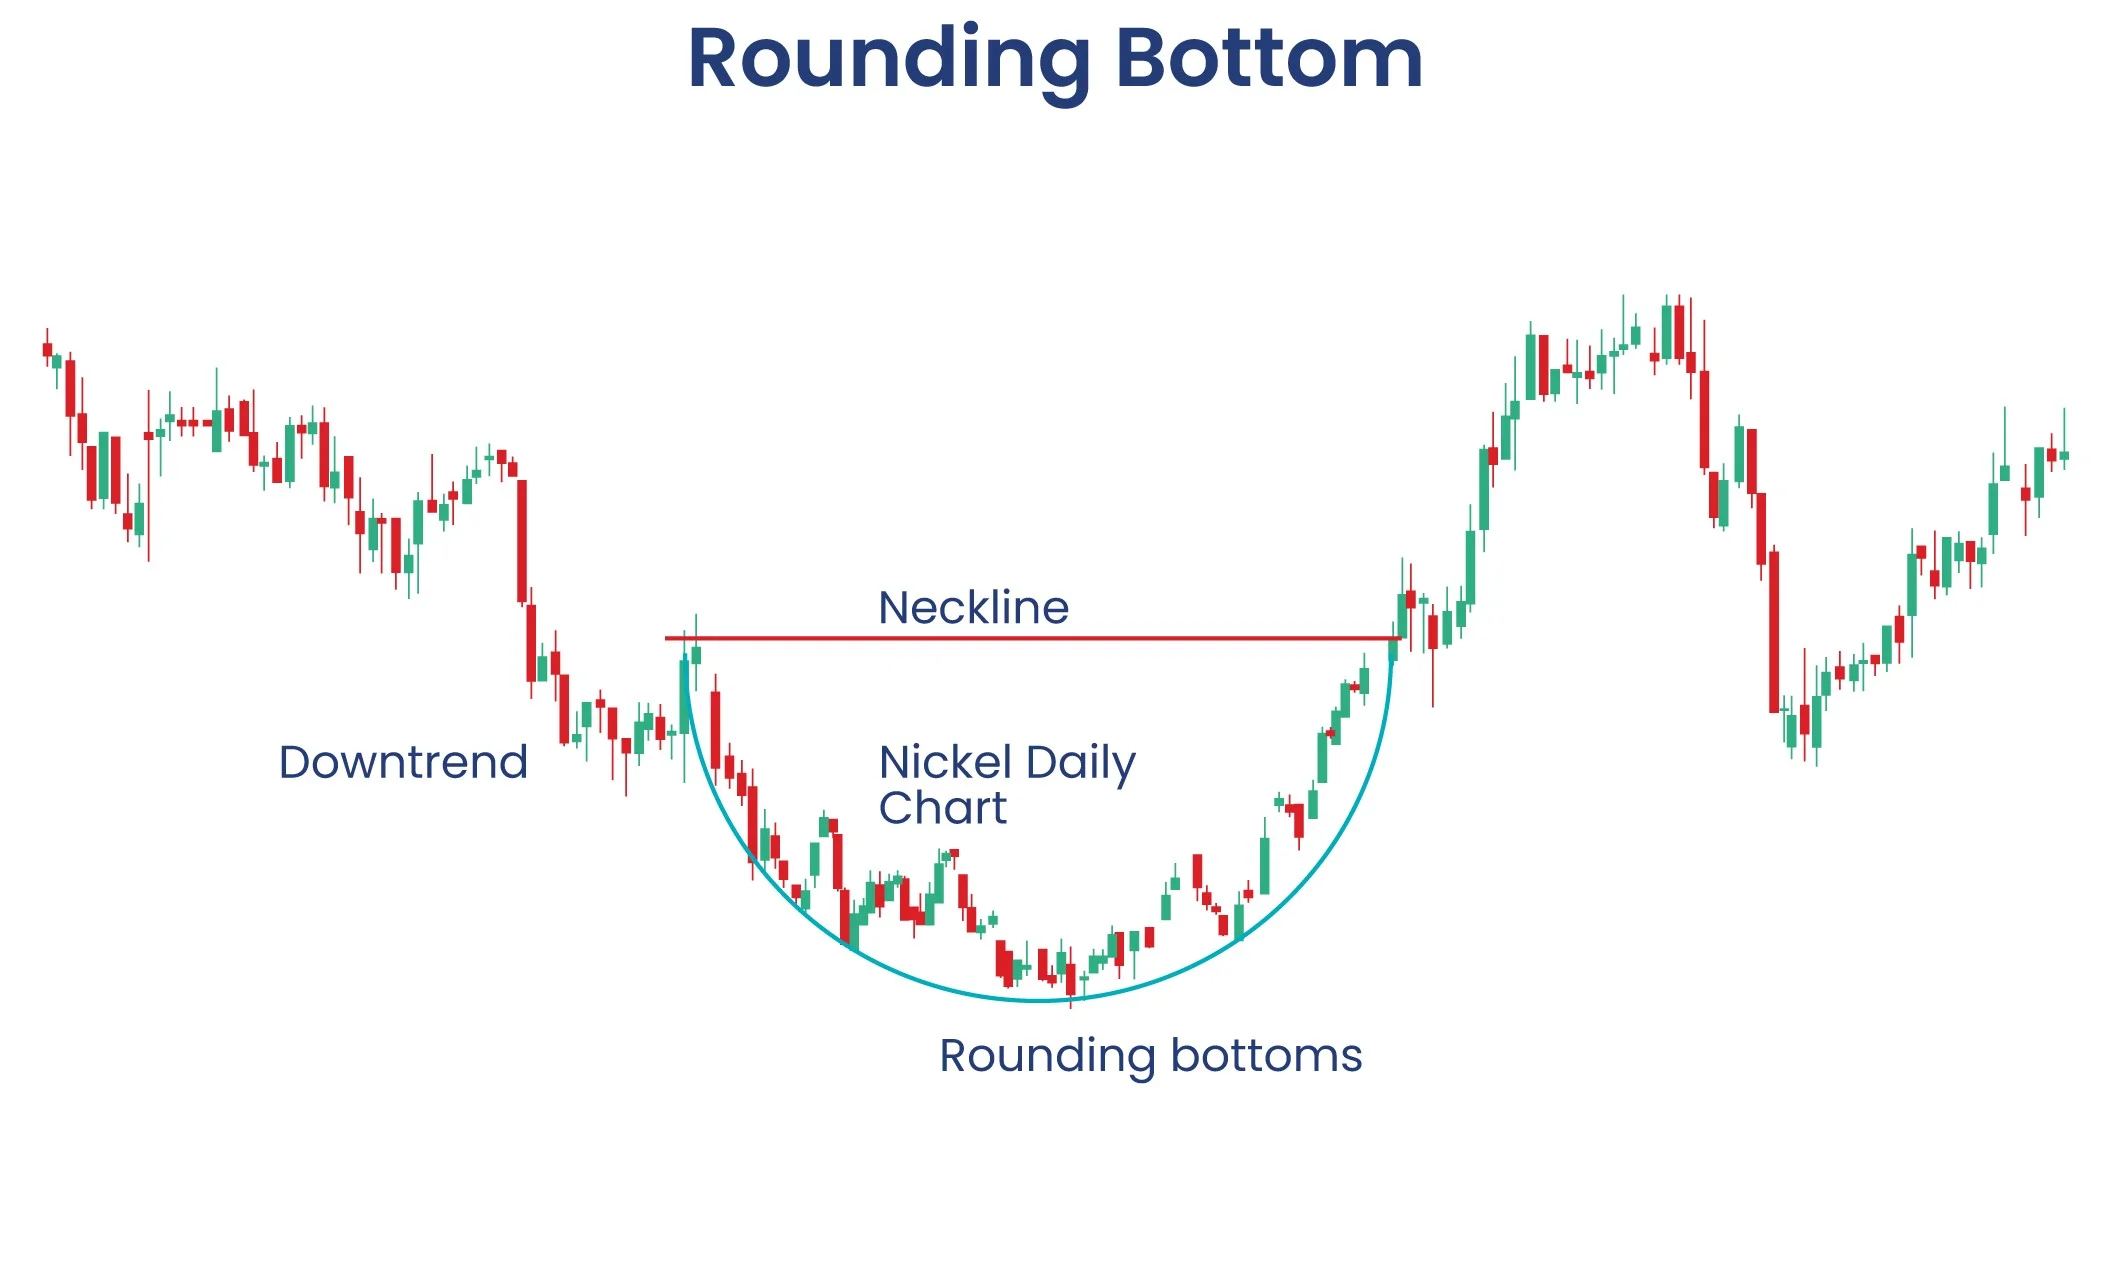
| 53 | Rounding Bottom Pattern | Bullish | Suggests a gradual reversal from a downtrend to an uptrend, forming a "U" shape. |
| 54 | Rounding Top Pattern | Bearish | Signals a potential reversal from an uptrend to a downtrend, forming an "n" shape. |
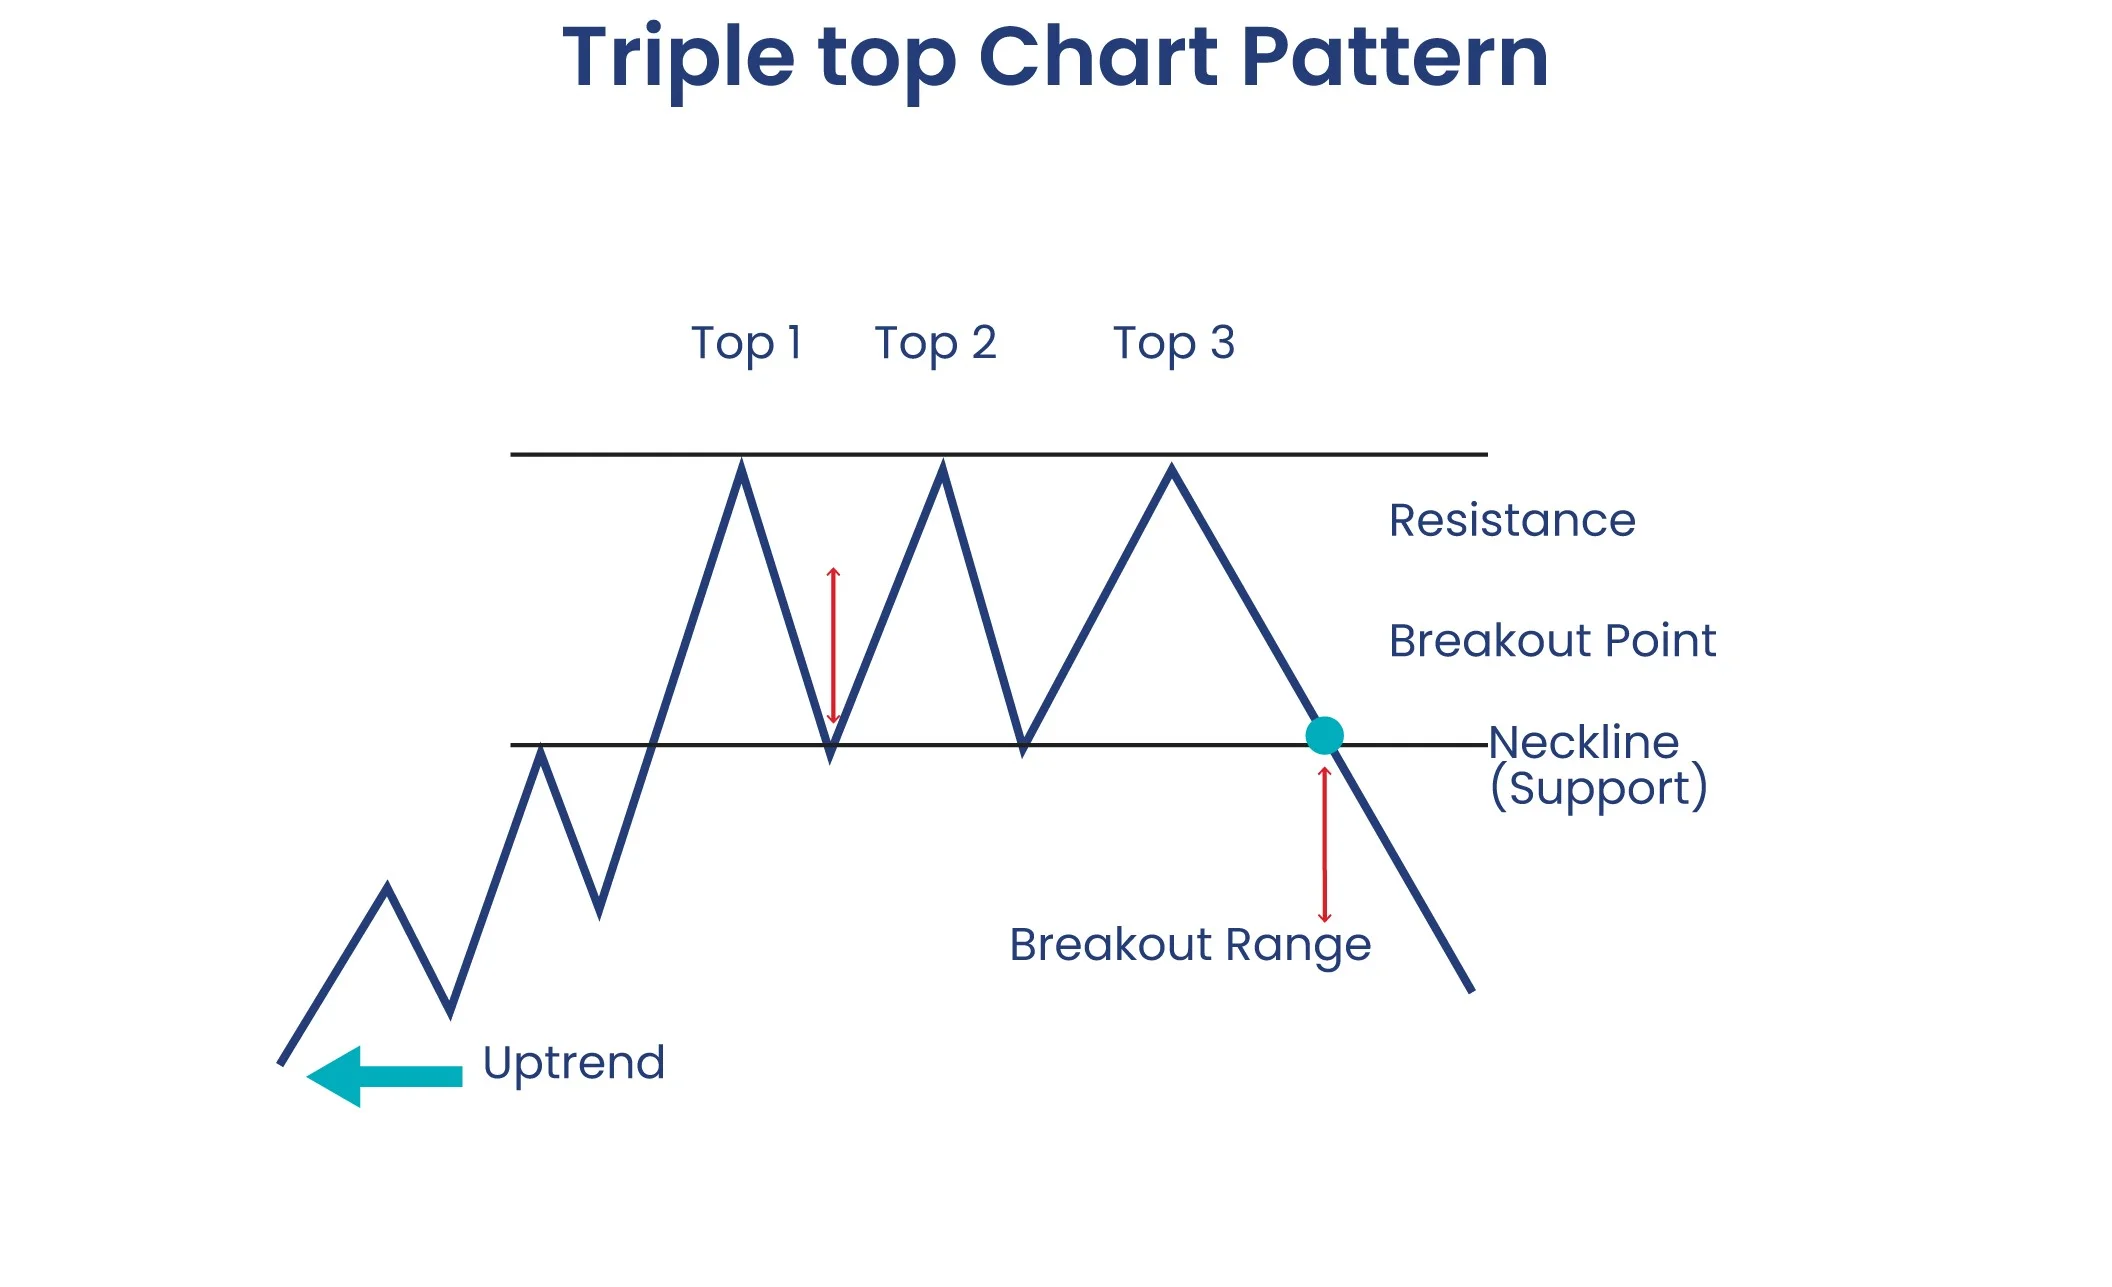
| 55 | Triple Top Pattern | Bearish | Represents three failed attempts to break resistance, often leading to a reversal downward. |
| 56 | Bullish Stick Sandwich Pattern | Bullish | Signals a potential reversal from a downtrend to an uptrend, as two bearish candles enclose a bullish candle at the same closing level. |
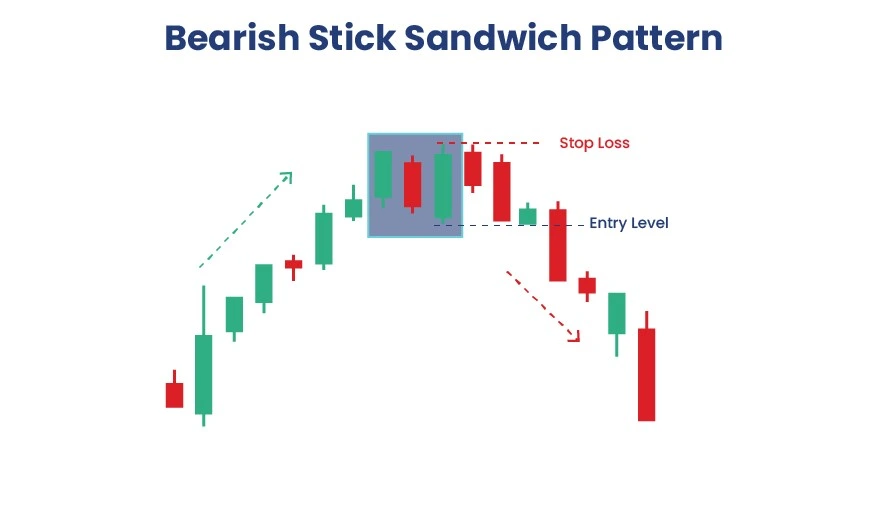
| 57 | Bearish Stick Sandwich Pattern | Bearish | Suggests a reversal from an uptrend to a downtrend, where two bullish candles enclose a bearish candle at the same closing level. |
| 58 | Bullish Breakaway Pattern | Bullish | Indicates a shift from a downtrend to an uptrend, with a strong bullish breakout after a series of smaller bearish candles. |
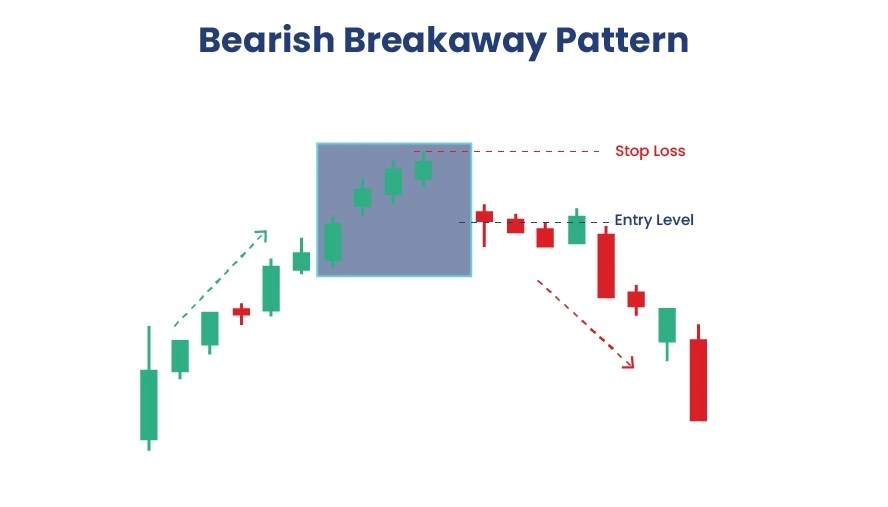
| 59 | Bearish Breakaway Pattern | Bearish | Marks a transition from an uptrend to a downtrend, with a strong bearish breakout following a sequence of smaller bullish candles. |
Complete Candlestick Pattern Analysis
Bullish Reversal Patterns (1-19)
1Hammer Pattern
The hammer pattern appears at the bottom of downtrends and signals potential bullish reversal. It shows that despite initial selling pressure, buyers managed to push the price back up significantly.
Formation:
Small body near the top with a long lower wick (at least 2x the body size)
Market Psychology:
Sellers initially drove price down, but buyers strongly recovered, showing potential trend reversal
Trading Strategy:
Enter long positions after confirmation from next bullish candle, especially at support levels
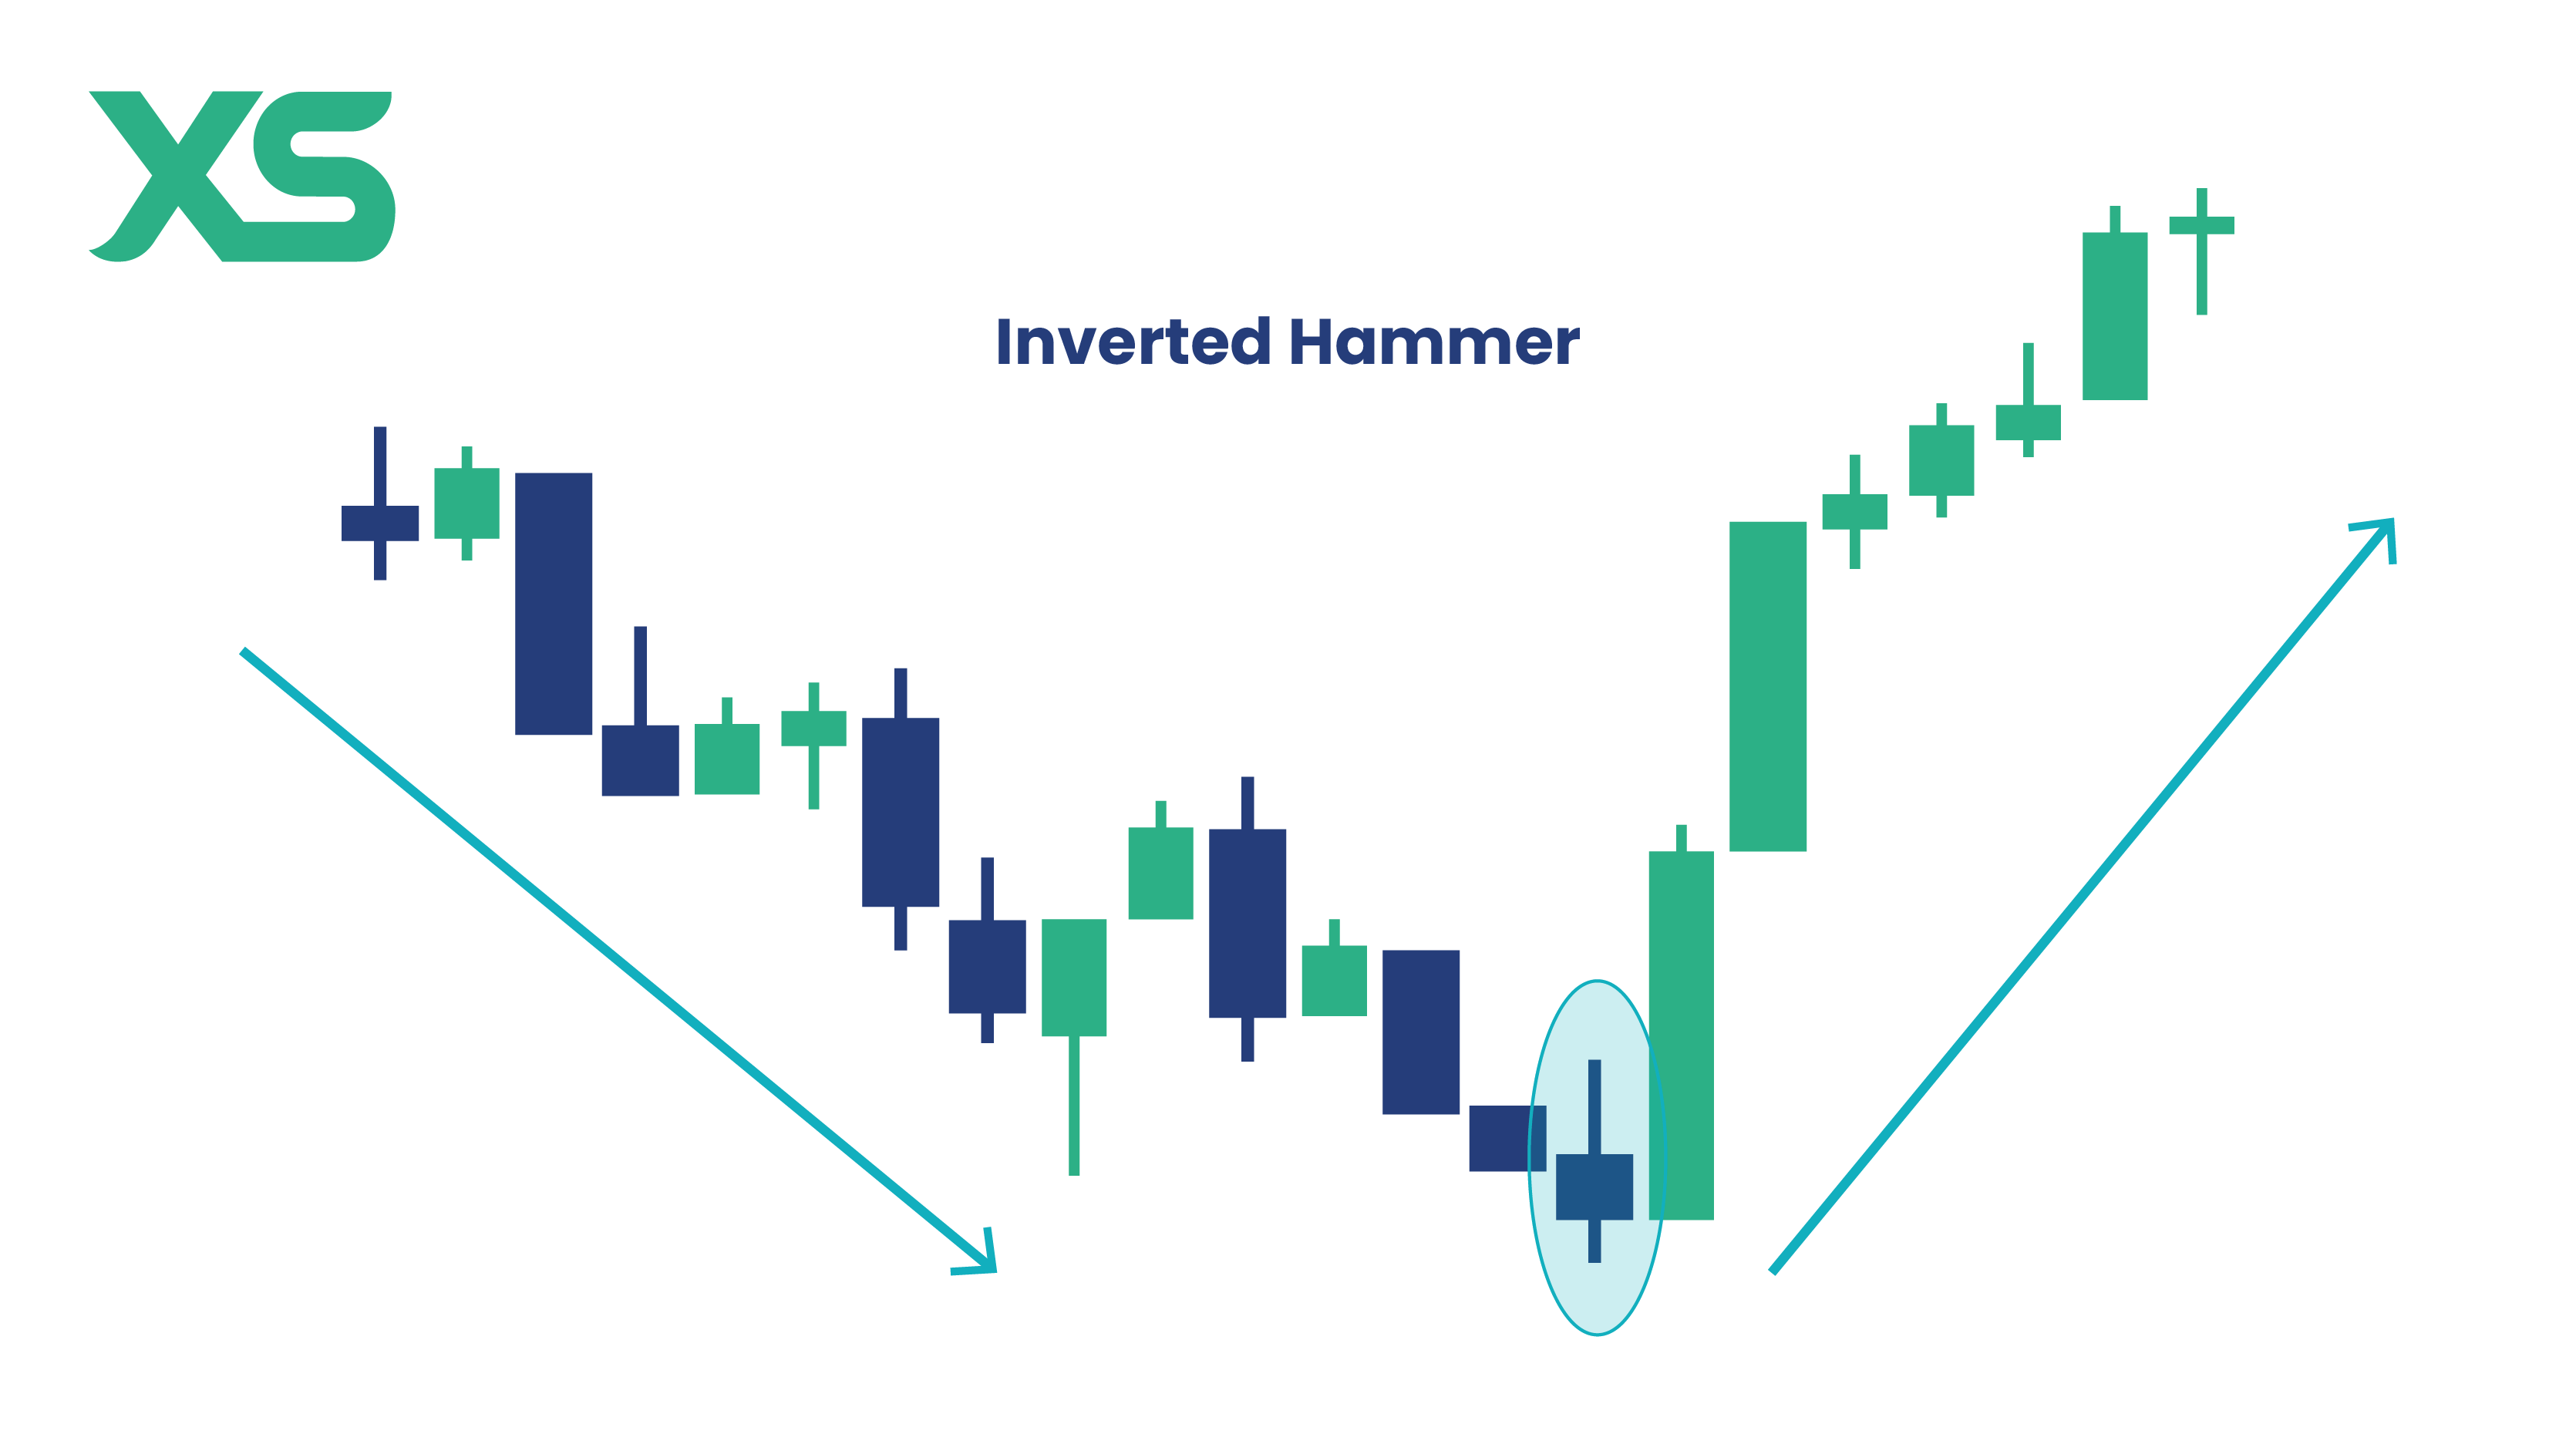
2Inverted Hammer Pattern
The inverted hammer appears after a downtrend and suggests potential bullish reversal. Despite the long upper wick showing resistance, it indicates buying interest.
Formation:
Small body with long upper wick, appearing after a downtrend
Market Psychology:
Buyers attempted to push price higher but met resistance, indicating potential upward movement
Trading Strategy:
Wait for confirmation from subsequent bullish candle before entering long positions
Bullish Reversal Patterns (1-19)
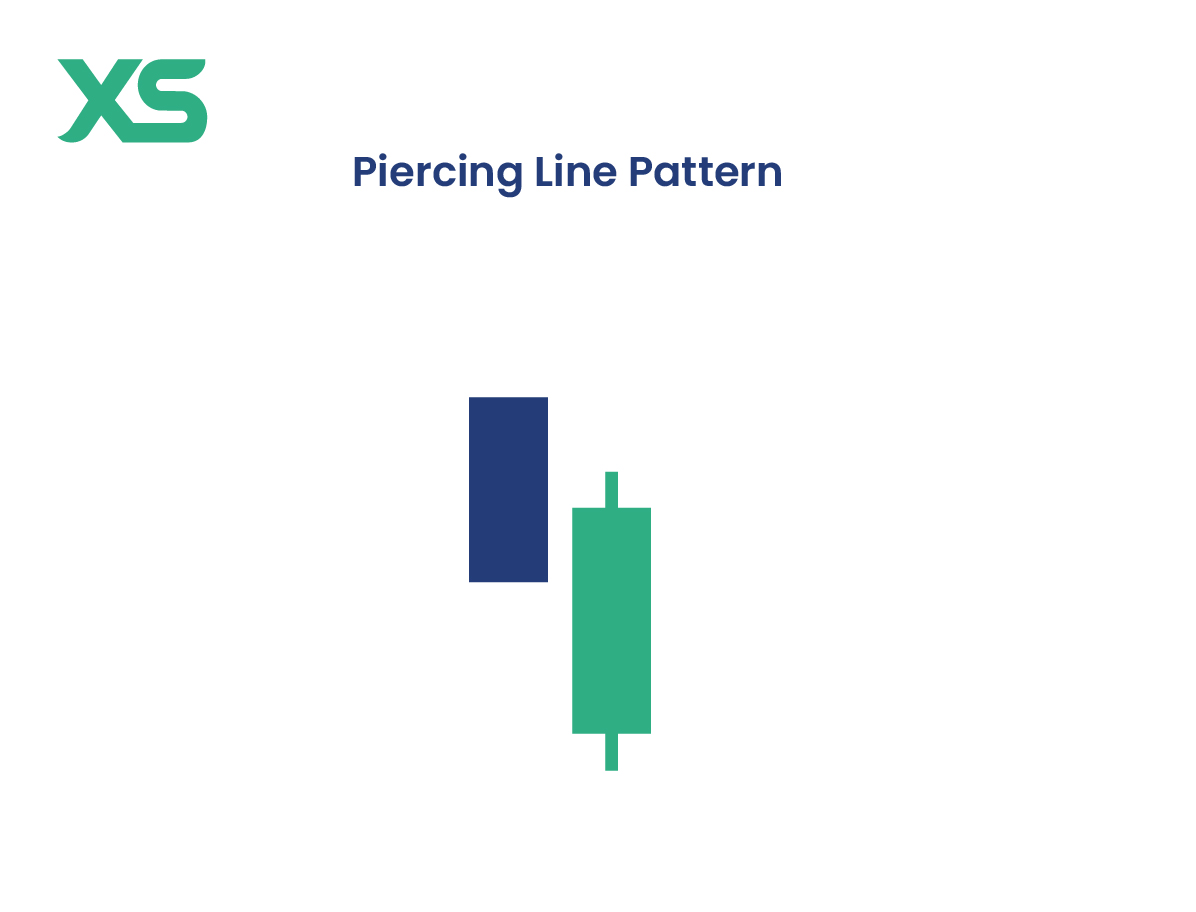
3Piercing Line Pattern
A two-candlestick formation signaling a potential bullish reversal. The second candlestick opens lower but closes above the midpoint of the previous bearish candlestick.
Formation:
First candlestick is bearish, second opens lower but closes above 50% of first candle
Market Psychology:
Suggests a strong shift in market sentiment from bearish to bullish
Trading Strategy:
Look for this pattern after a clear downtrend for best results
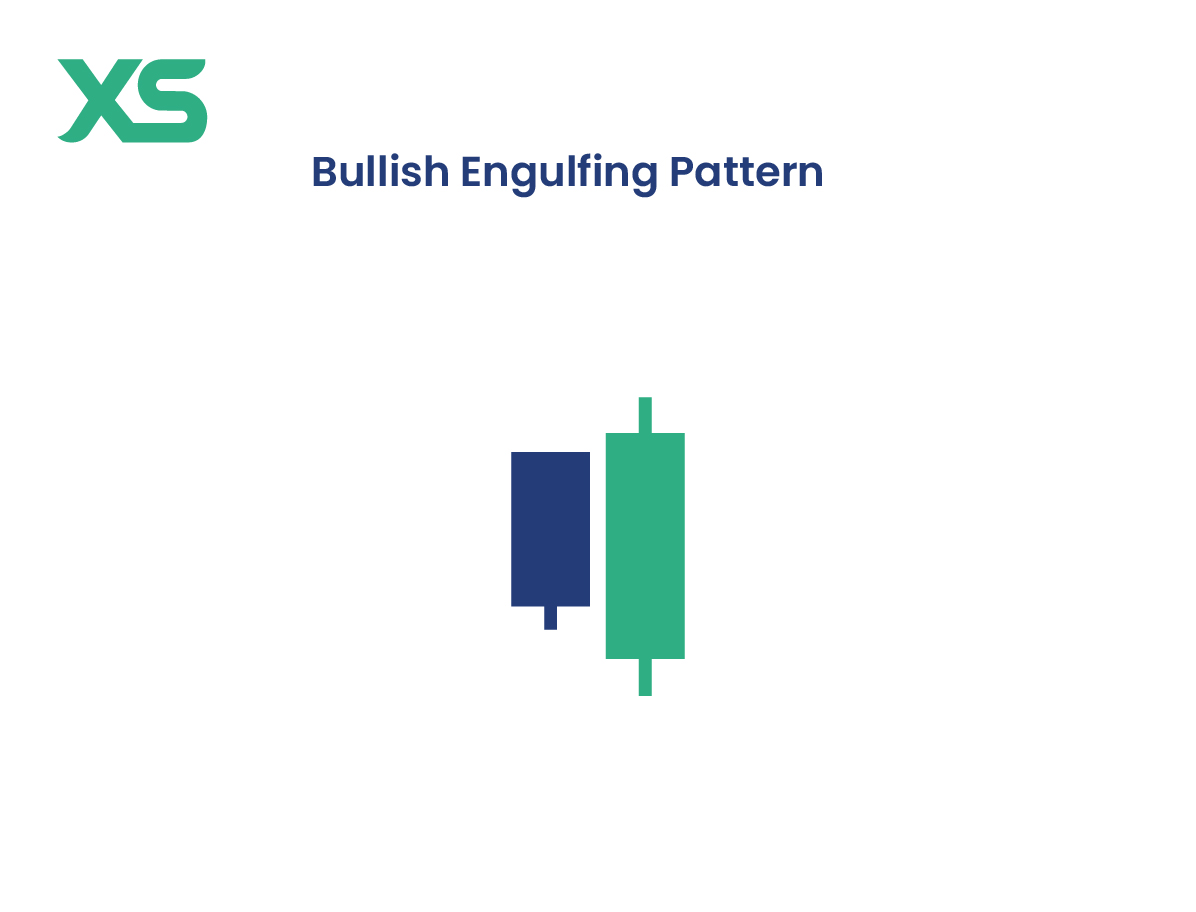
4Bullish Engulfing Pattern
A reversal signal with a small bearish candlestick followed by a larger bullish candlestick that completely engulfs the previous one.
Formation:
Small bearish candle completely engulfed by larger bullish candle
Market Psychology:
Indicates that buyers have taken control, overpowering the sellers
Trading Strategy:
Strong signal suggesting potential upward movement
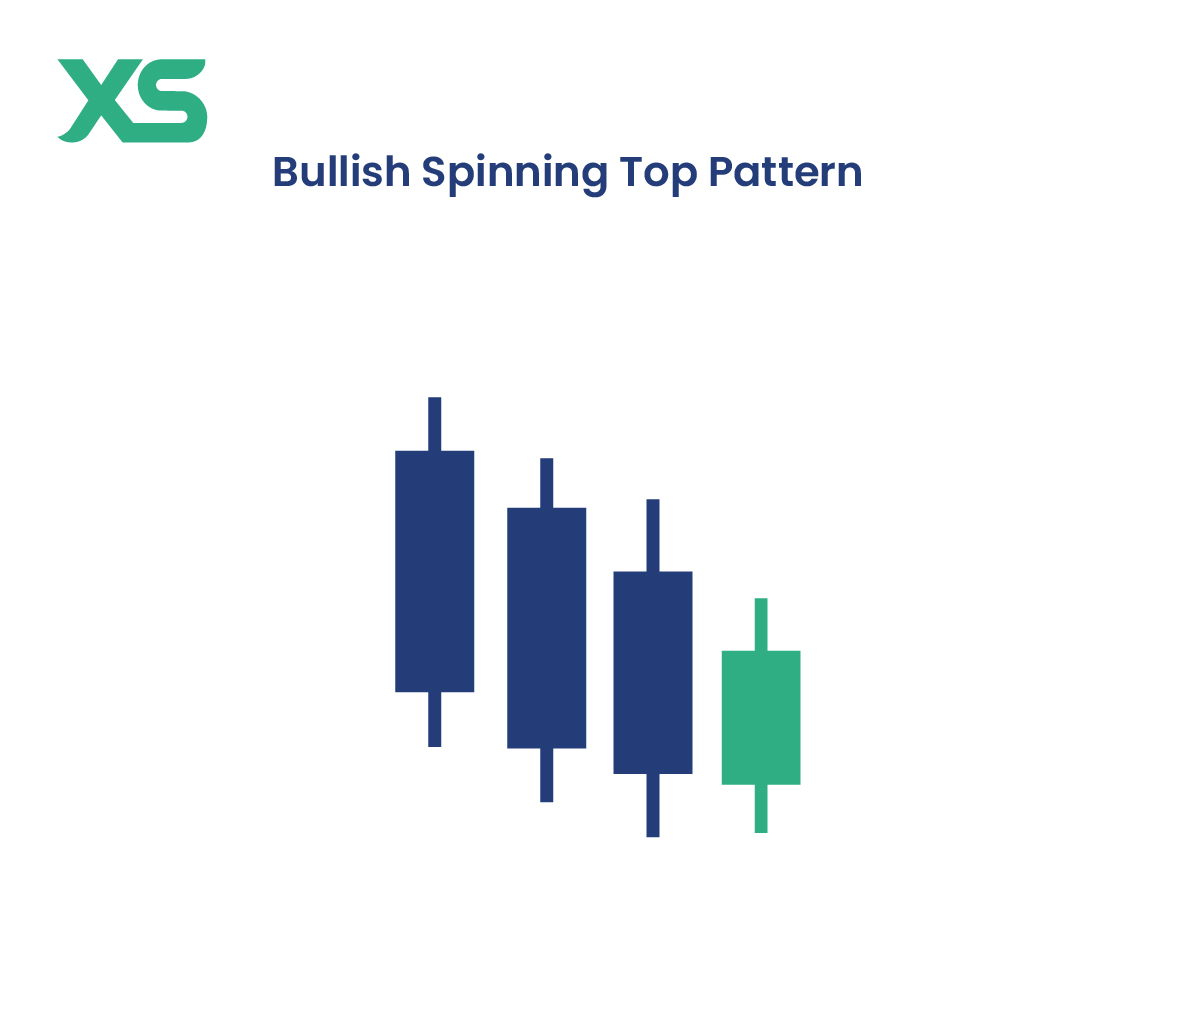
5Bullish Spinning Top Pattern
Small body with long wicks on both sides appearing after a downtrend. Indicates market indecision with weakening selling pressure.
Formation:
Small body with long upper and lower wicks of similar length
Market Psychology:
Shows indecision but selling pressure is weakening
Trading Strategy:
Suggests potential bullish reversal is imminent, wait for confirmation
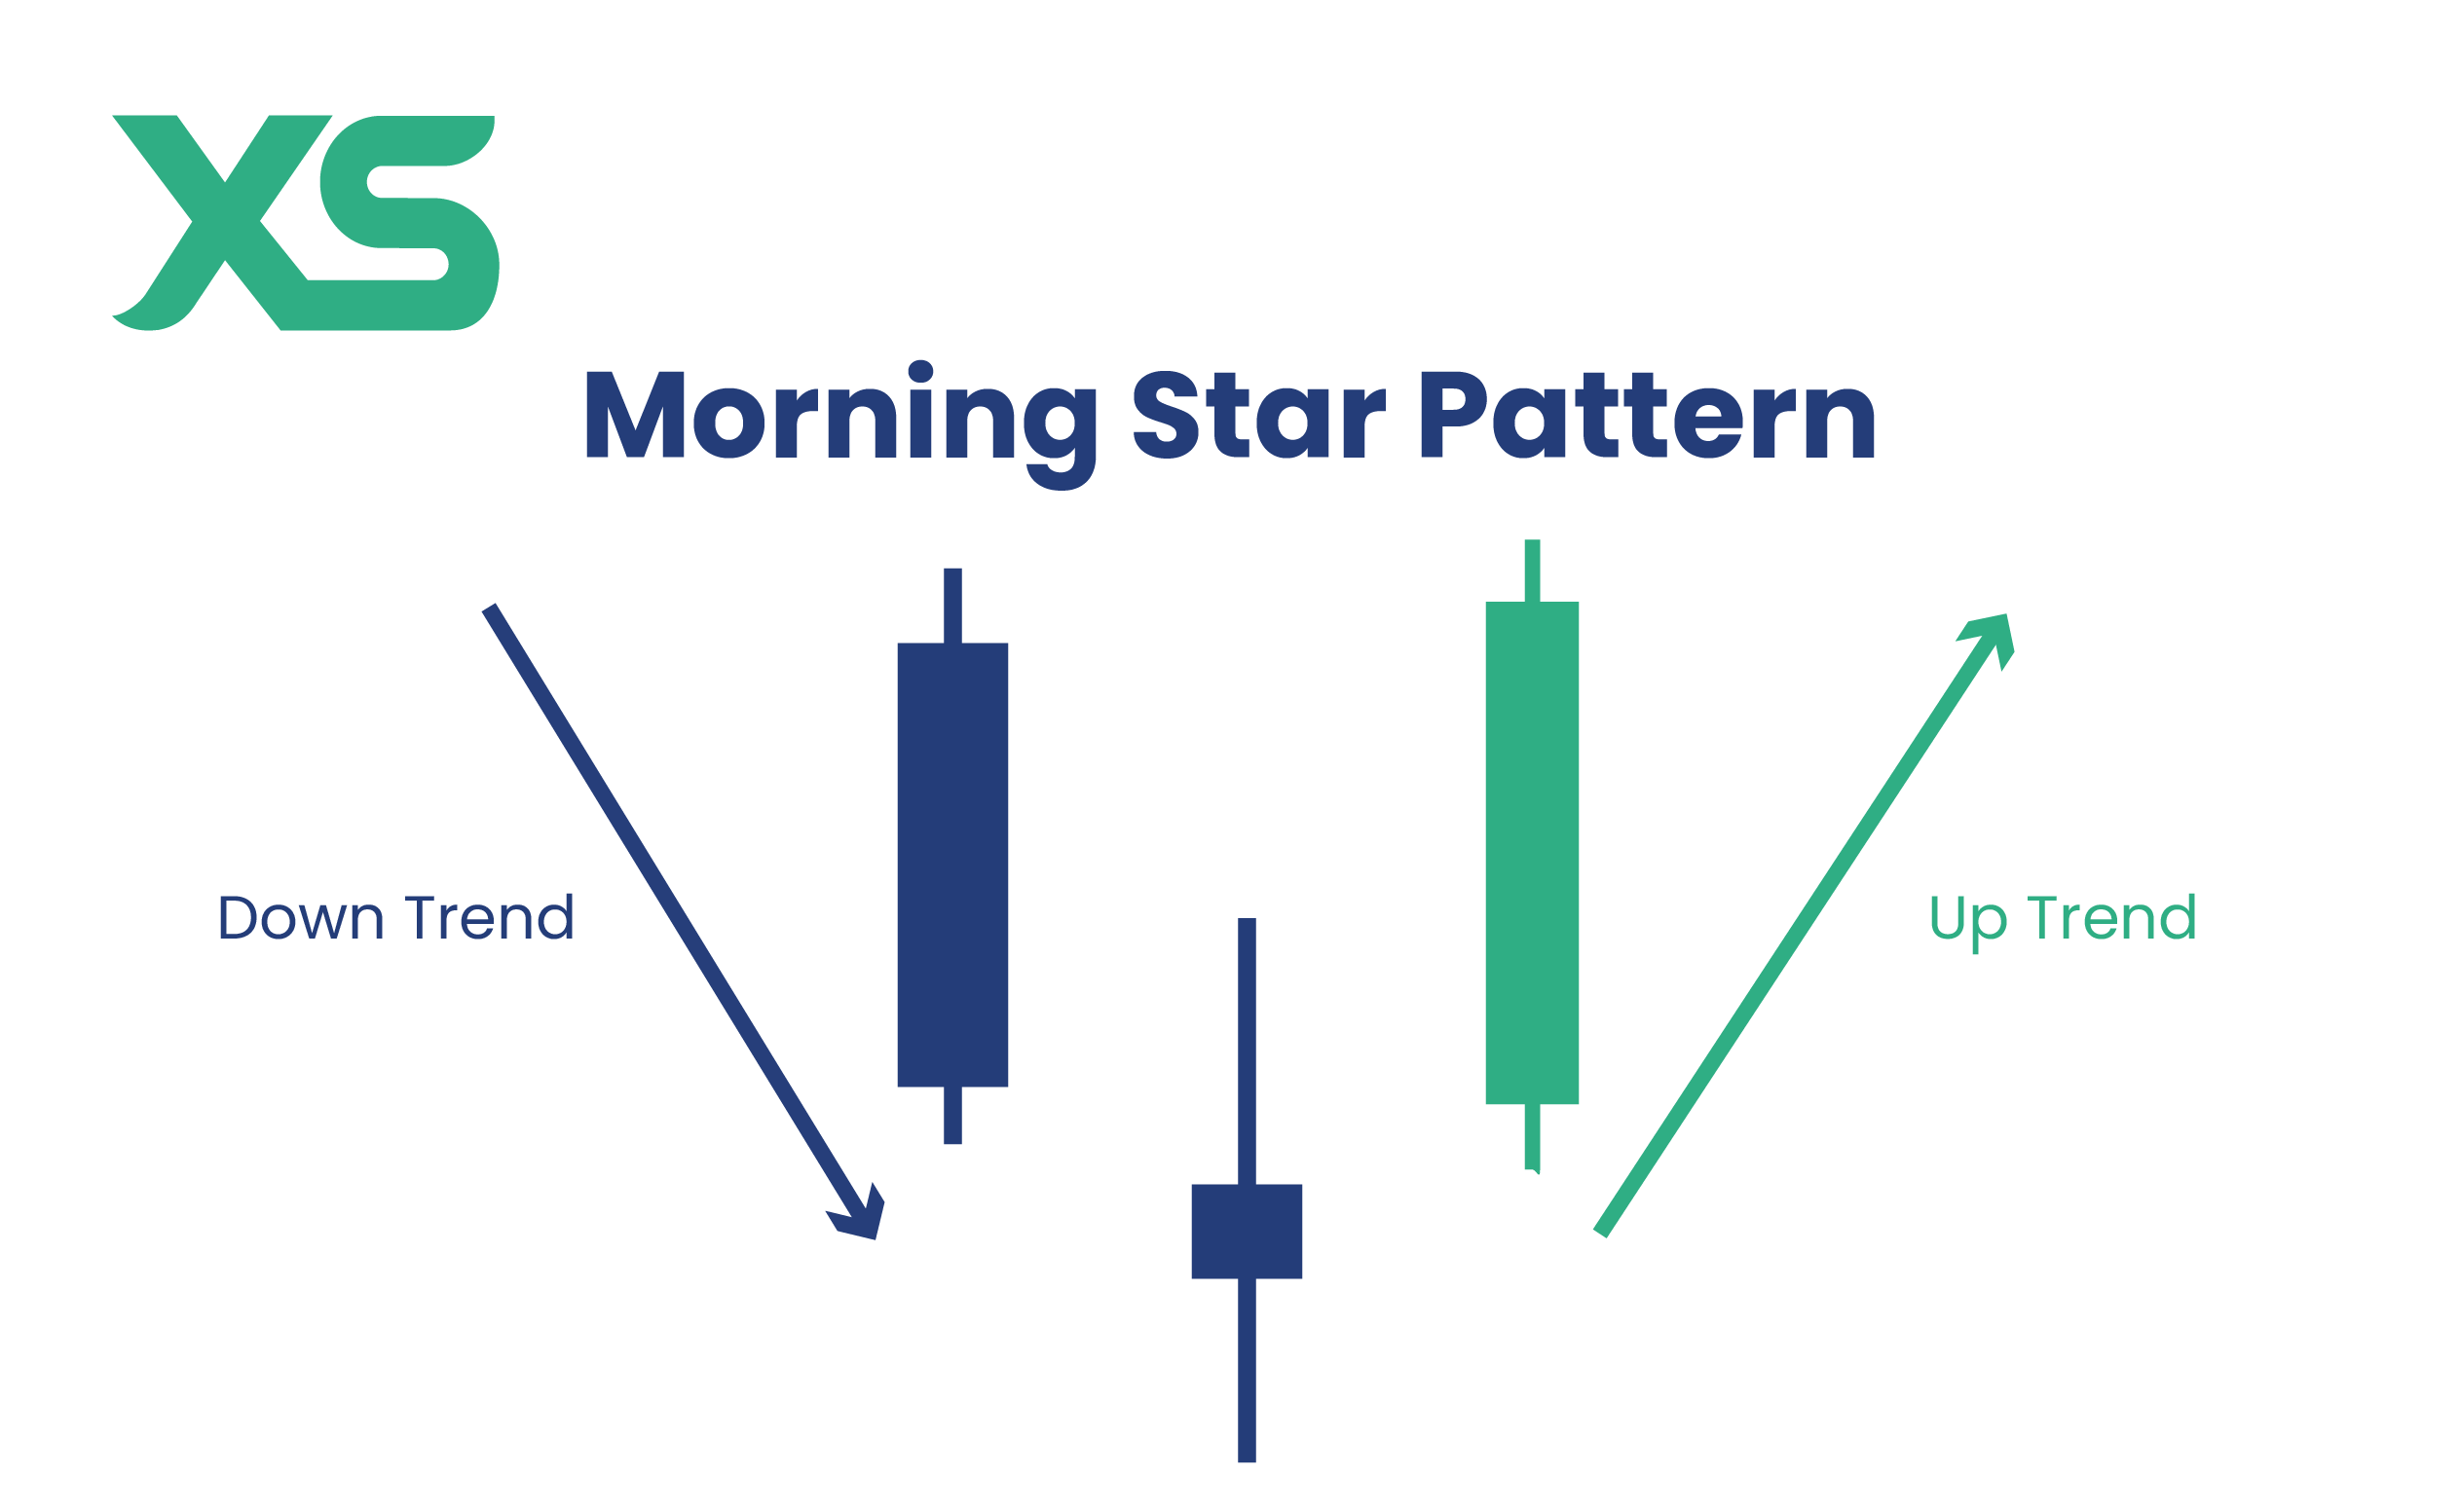
6Morning Star Pattern
Three-candlestick bullish reversal pattern consisting of a long bearish candle, small-bodied star, and long bullish candle.
Formation:
Long bearish candle, small star that gaps down, long bullish candle closing near midpoint of first
Market Psychology:
Indicates a shift from selling to buying pressure
Trading Strategy:
Strong reversal signal, enter long after pattern completion
7Three White Soldiers Pattern
Three consecutive long bullish candlesticks with each opening within the previous body and closing near its high.
Formation:
Three consecutive long bullish candles with small wicks
Market Psychology:
Indicates strong buying pressure and bullish momentum
Trading Strategy:
Suggests potential start of sustained uptrend
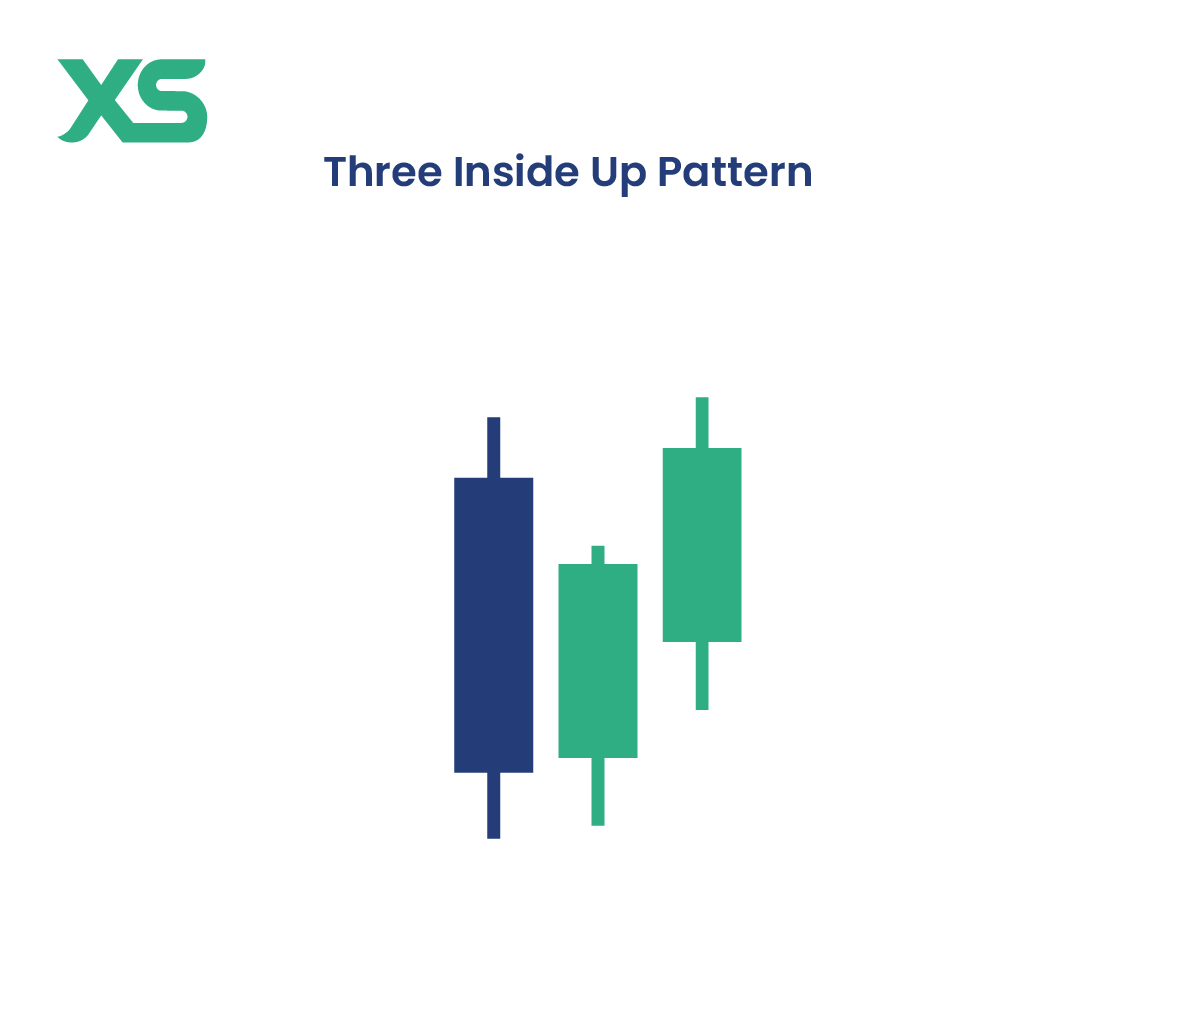
8Three Inside Up Pattern
Bullish reversal signal with long bearish candlestick, smaller bullish within first body, and third bullish closing above first.
Formation:
Long bearish, smaller bullish inside, third bullish above first close
Market Psychology:
Shows gradual shift from bearish to bullish sentiment
Trading Strategy:
Confirms bullish reversal, enter long positions
9Bullish Harami Pattern
A small bullish candle within the body of a preceding large bearish candle, suggesting weakening selling pressure.
Formation:
Small bullish candle completely contained within large bearish candle body
Market Psychology:
Selling pressure weakening, buyers may be gaining control
Trading Strategy:
Potential trend reversal from bearish to bullish
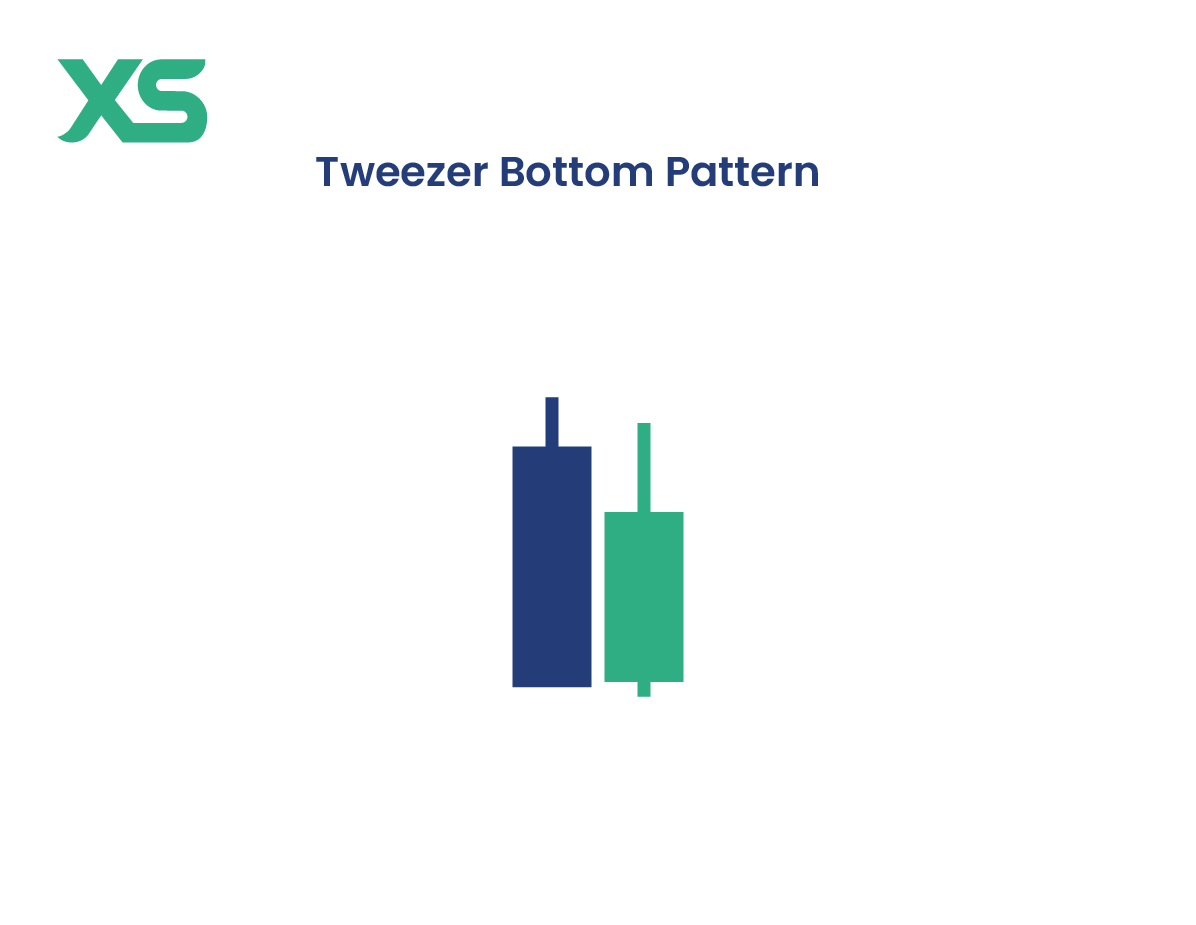
10Tweezer Bottom Pattern
Two candlesticks with matching lows, indicating the downtrend has found a strong support level.
Formation:
Two consecutive candlesticks touching the same low point
Market Psychology:
Strong support level found, potential buying interest emerging
Trading Strategy:
Potential upward price reversal from support level
11Bullish Counterattack Pattern
Bearish candle followed by a bullish candlestick that closes at the same level as the previous candle.
Formation:
Bearish candle followed by bullish candle closing at identical level
Market Psychology:
Buyers have countered the selling pressure effectively
Trading Strategy:
Potential trend reversal signal, consider long positions
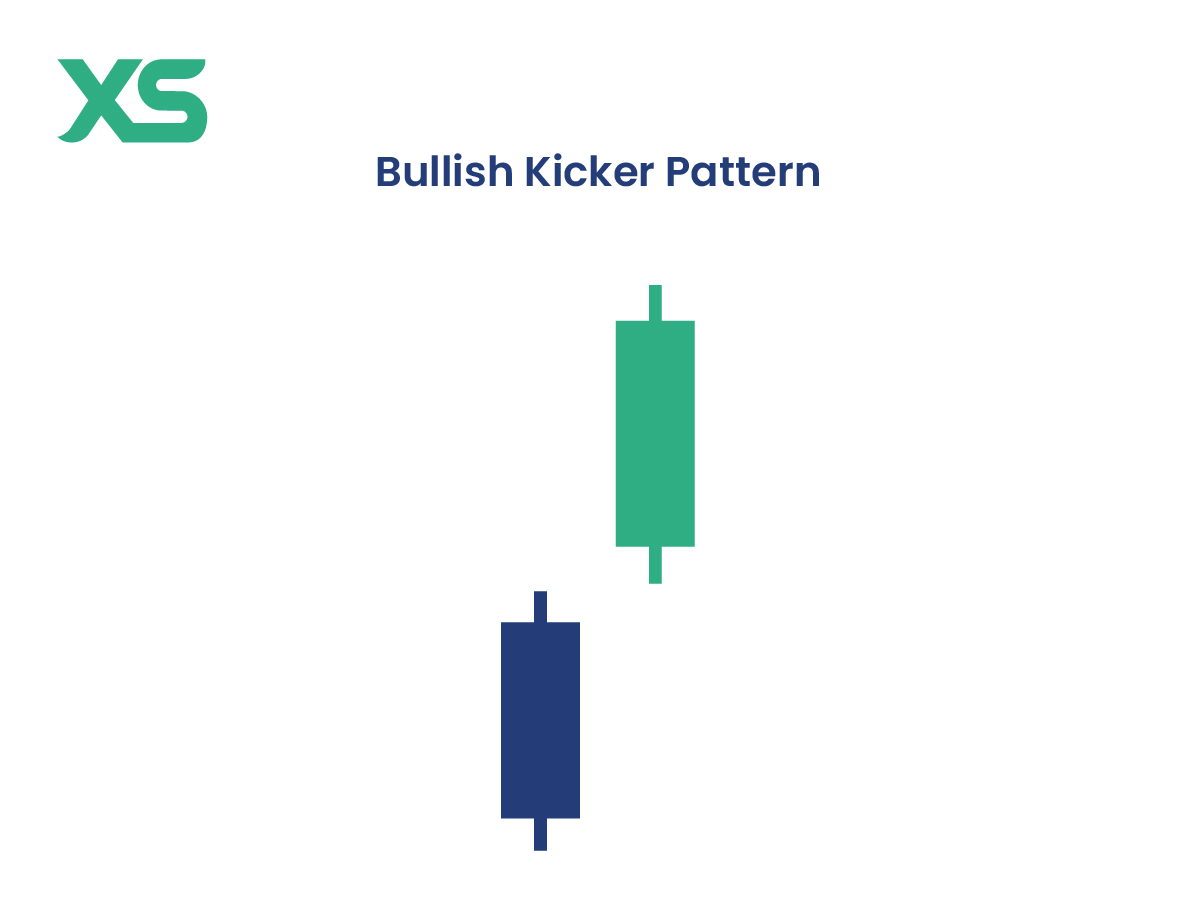
12Bullish Kicker Pattern
Bullish candle gapping up and continuing upward after a bearish candle, indicating strong sentiment shift.
Formation:
Bearish candle followed by bullish candle that gaps up and moves higher
Market Psychology:
Significant shift in market sentiment from bearish to bullish
Trading Strategy:
Strong potential for upward trend continuation
13Bullish Abandoned Baby Pattern
Three-candle pattern with long bearish, doji, and bullish candle gapping up, signaling strong sentiment shift.
Formation:
Long bearish candle, doji gapping down, bullish candle gapping up
Market Psychology:
Strong shift in market sentiment from bearish to bullish
Trading Strategy:
Potential significant trend reversal signal
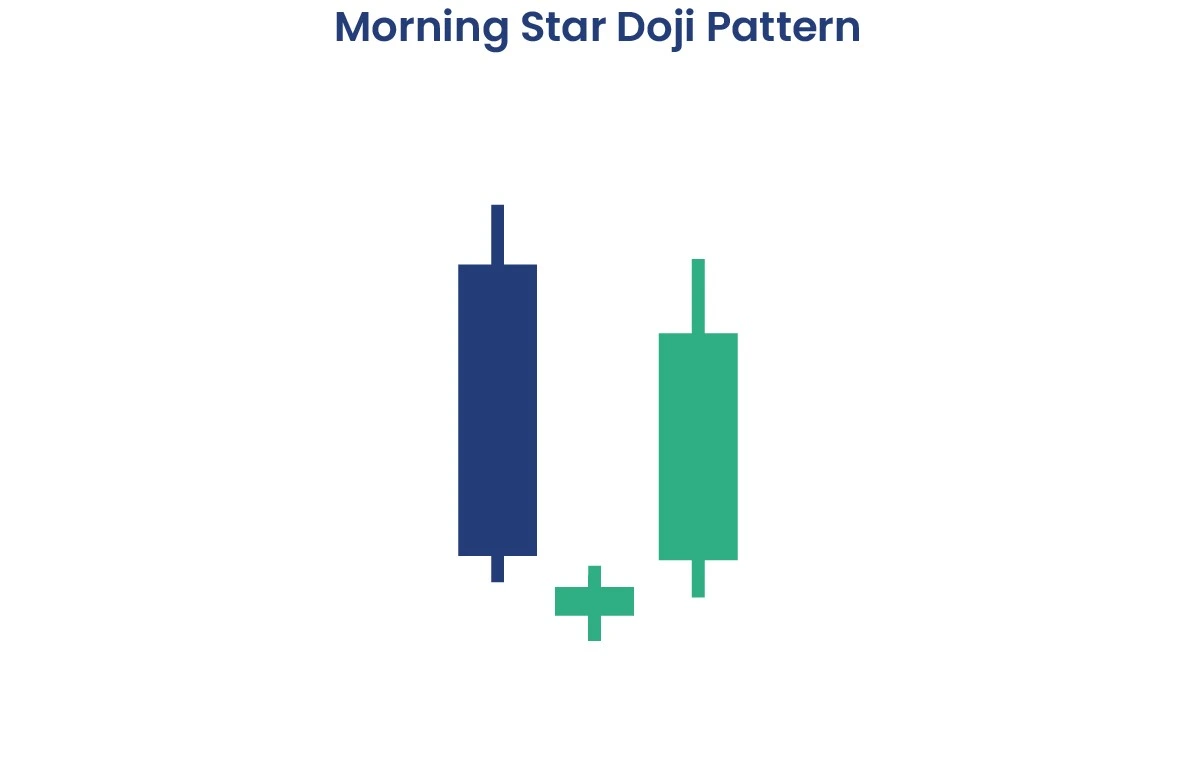
14Morning Star Doji Pattern
Similar to morning star pattern but includes a doji as the middle candle, indicating indecision before reversal.
Formation:
Long bearish candle, doji candle, long bullish candle
Market Psychology:
Market indecision followed by bullish sentiment emergence
Trading Strategy:
Strong reversal signal with doji confirmation
15Dragonfly Doji Pattern
A doji with a long lower wick, indicating buying pressure overcoming selling pressure at the bottom of a downtrend.
Formation:
Open and close at top, long lower shadow showing rejection of lower prices
Market Psychology:
Sellers pushed down but buyers recovered completely
Trading Strategy:
Most effective at major support levels, watch for bullish follow-through
16Bullish Tri-Star Pattern
Three doji candles in a row, signaling market indecision but potential for reversal at the bottom of a downtrend.
Formation:
Three consecutive doji candles showing extreme indecision
Market Psychology:
Market is at a standstill, often preceding reversal
Trading Strategy:
Wait for strong bullish confirmation before entering
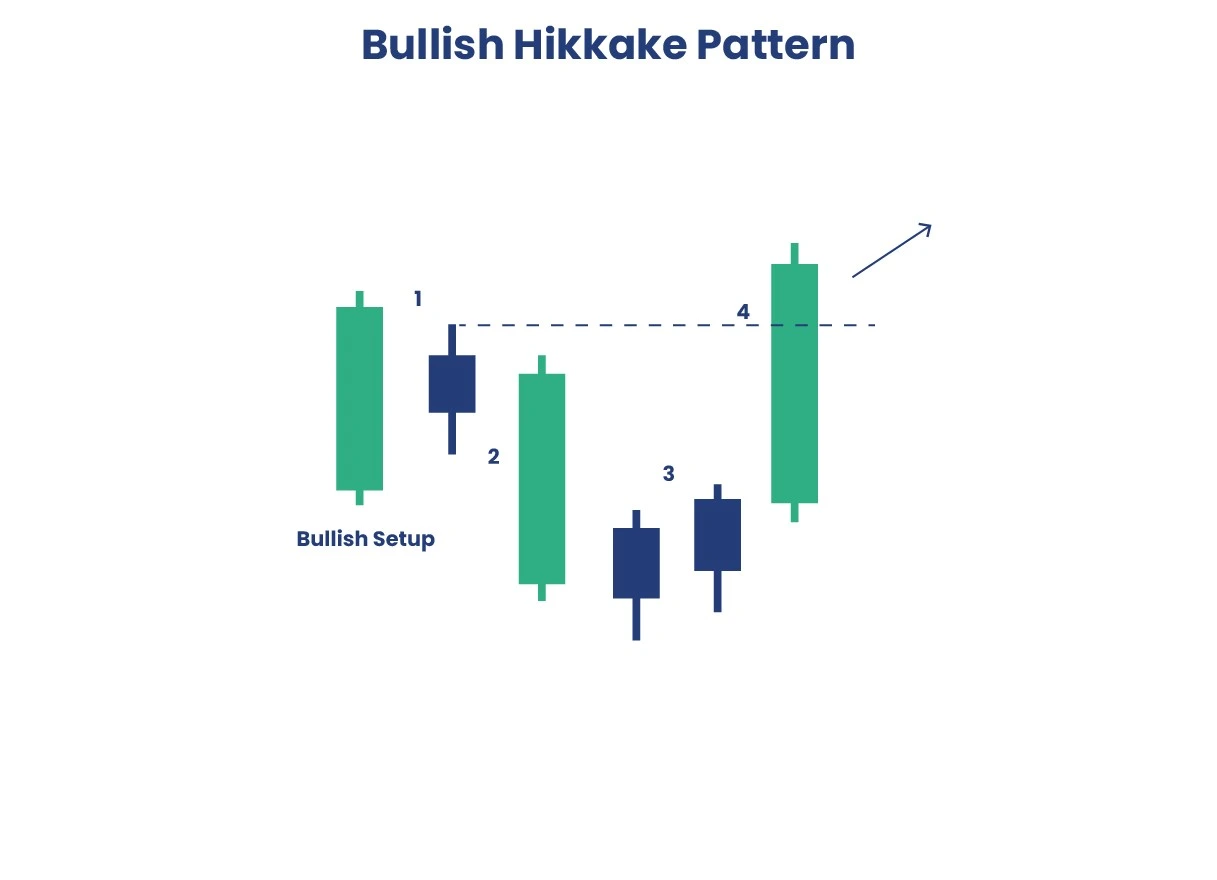
17Bullish Hikkake Pattern
Inside bar pattern followed by a bullish breakout, indicating reversal after a period of consolidation or indecision.
Formation:
Inside bar followed by upside breakout above the mother bar
Market Psychology:
Brief consolidation before bulls take control
Trading Strategy:
Enter on breakout with stop below the inside bar low
18Concealing Baby Swallow Pattern
Four bearish candles followed by a bullish candle after exhaustion, indicating a potential reversal to the upside.
Formation:
Four consecutive bearish candles with fourth being a marubozu
Market Psychology:
Selling exhaustion creates opportunity for reversal
Trading Strategy:
Rare pattern - wait for additional bullish confirmation
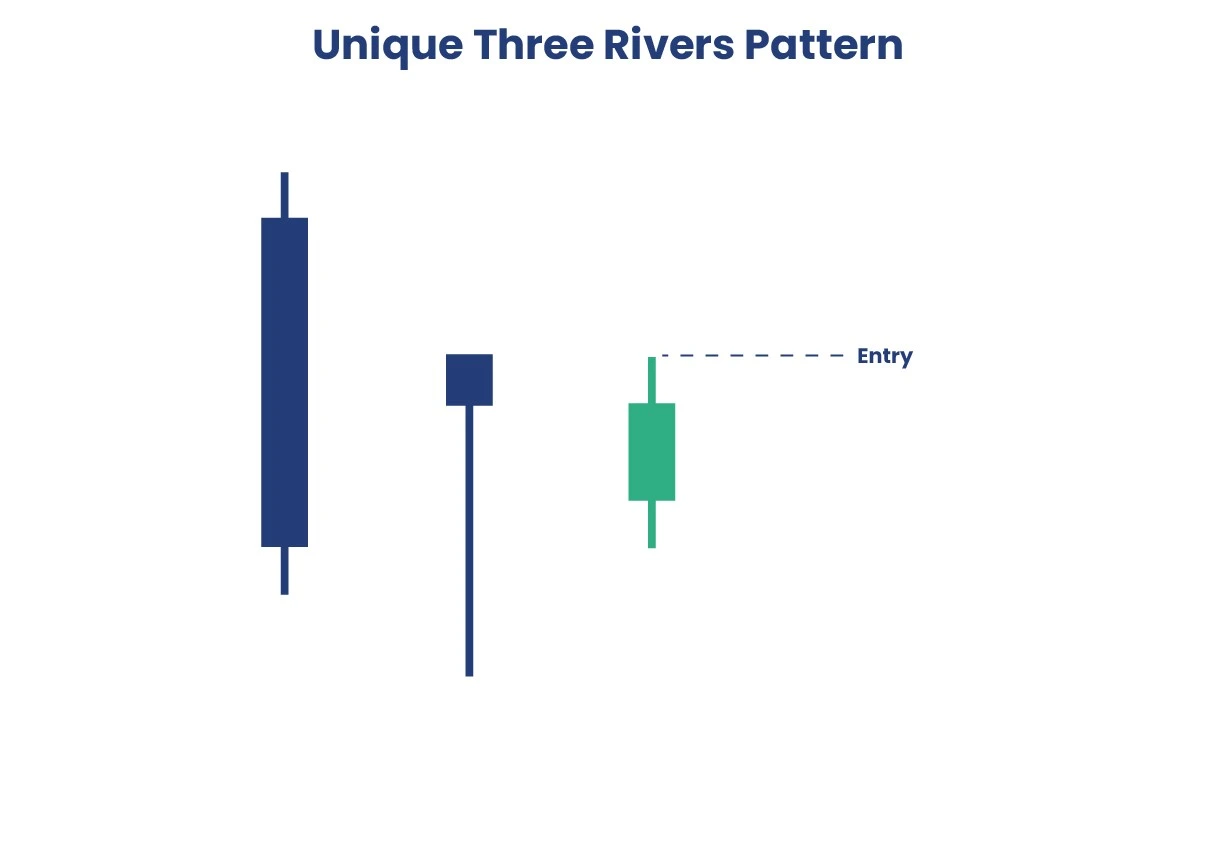
19Unique Three Rivers Pattern
Three-candle bullish reversal pattern found at market bottoms, representing a shift from bearish to bullish sentiment.
Formation:
Long black candle, hammer, small white candle covering the hammer
Market Psychology:
Bears lose steam as bulls gradually take control
Trading Strategy:
Enter long on close above pattern high with tight stop
Bearish Reversal Patterns (20-38)
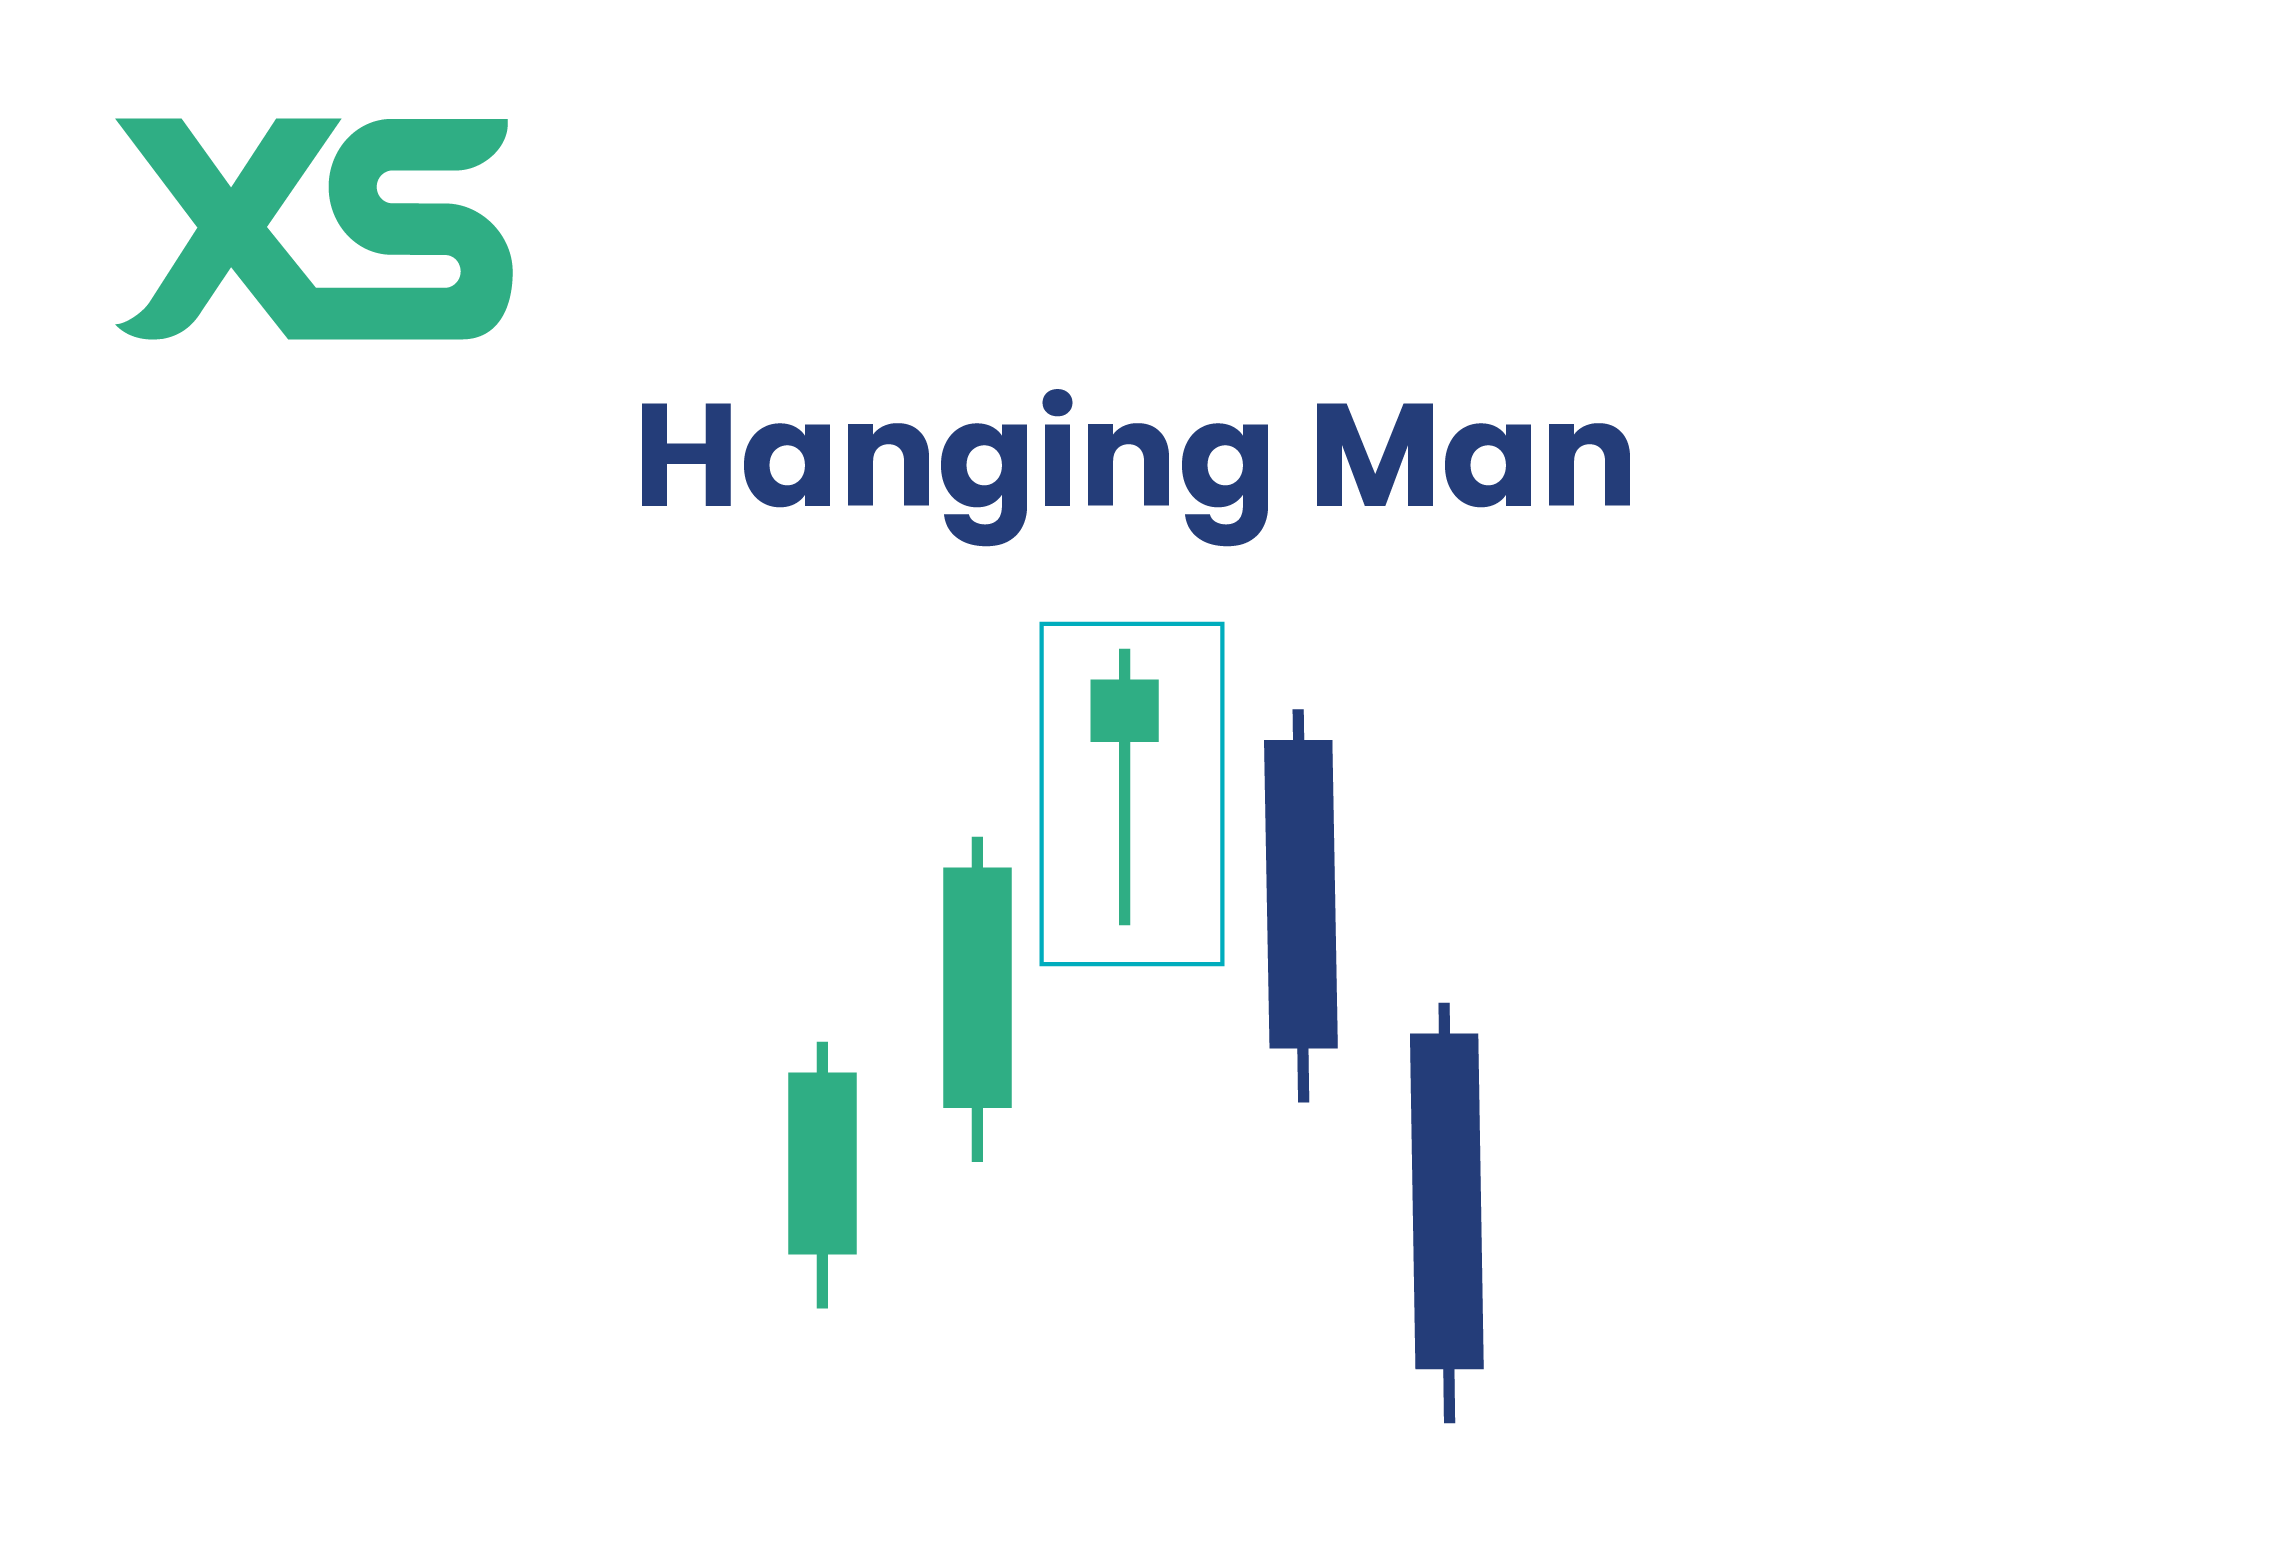
20Hanging Man Pattern
Small body at the top of the candlestick with a long lower wick, signaling sellers are gaining control at trend tops.
Formation:
Small body near top with long lower wick, appears after uptrend
Market Psychology:
Despite recovery, underlying selling pressure is building
Trading Strategy:
Wait for bearish confirmation before entering short positions
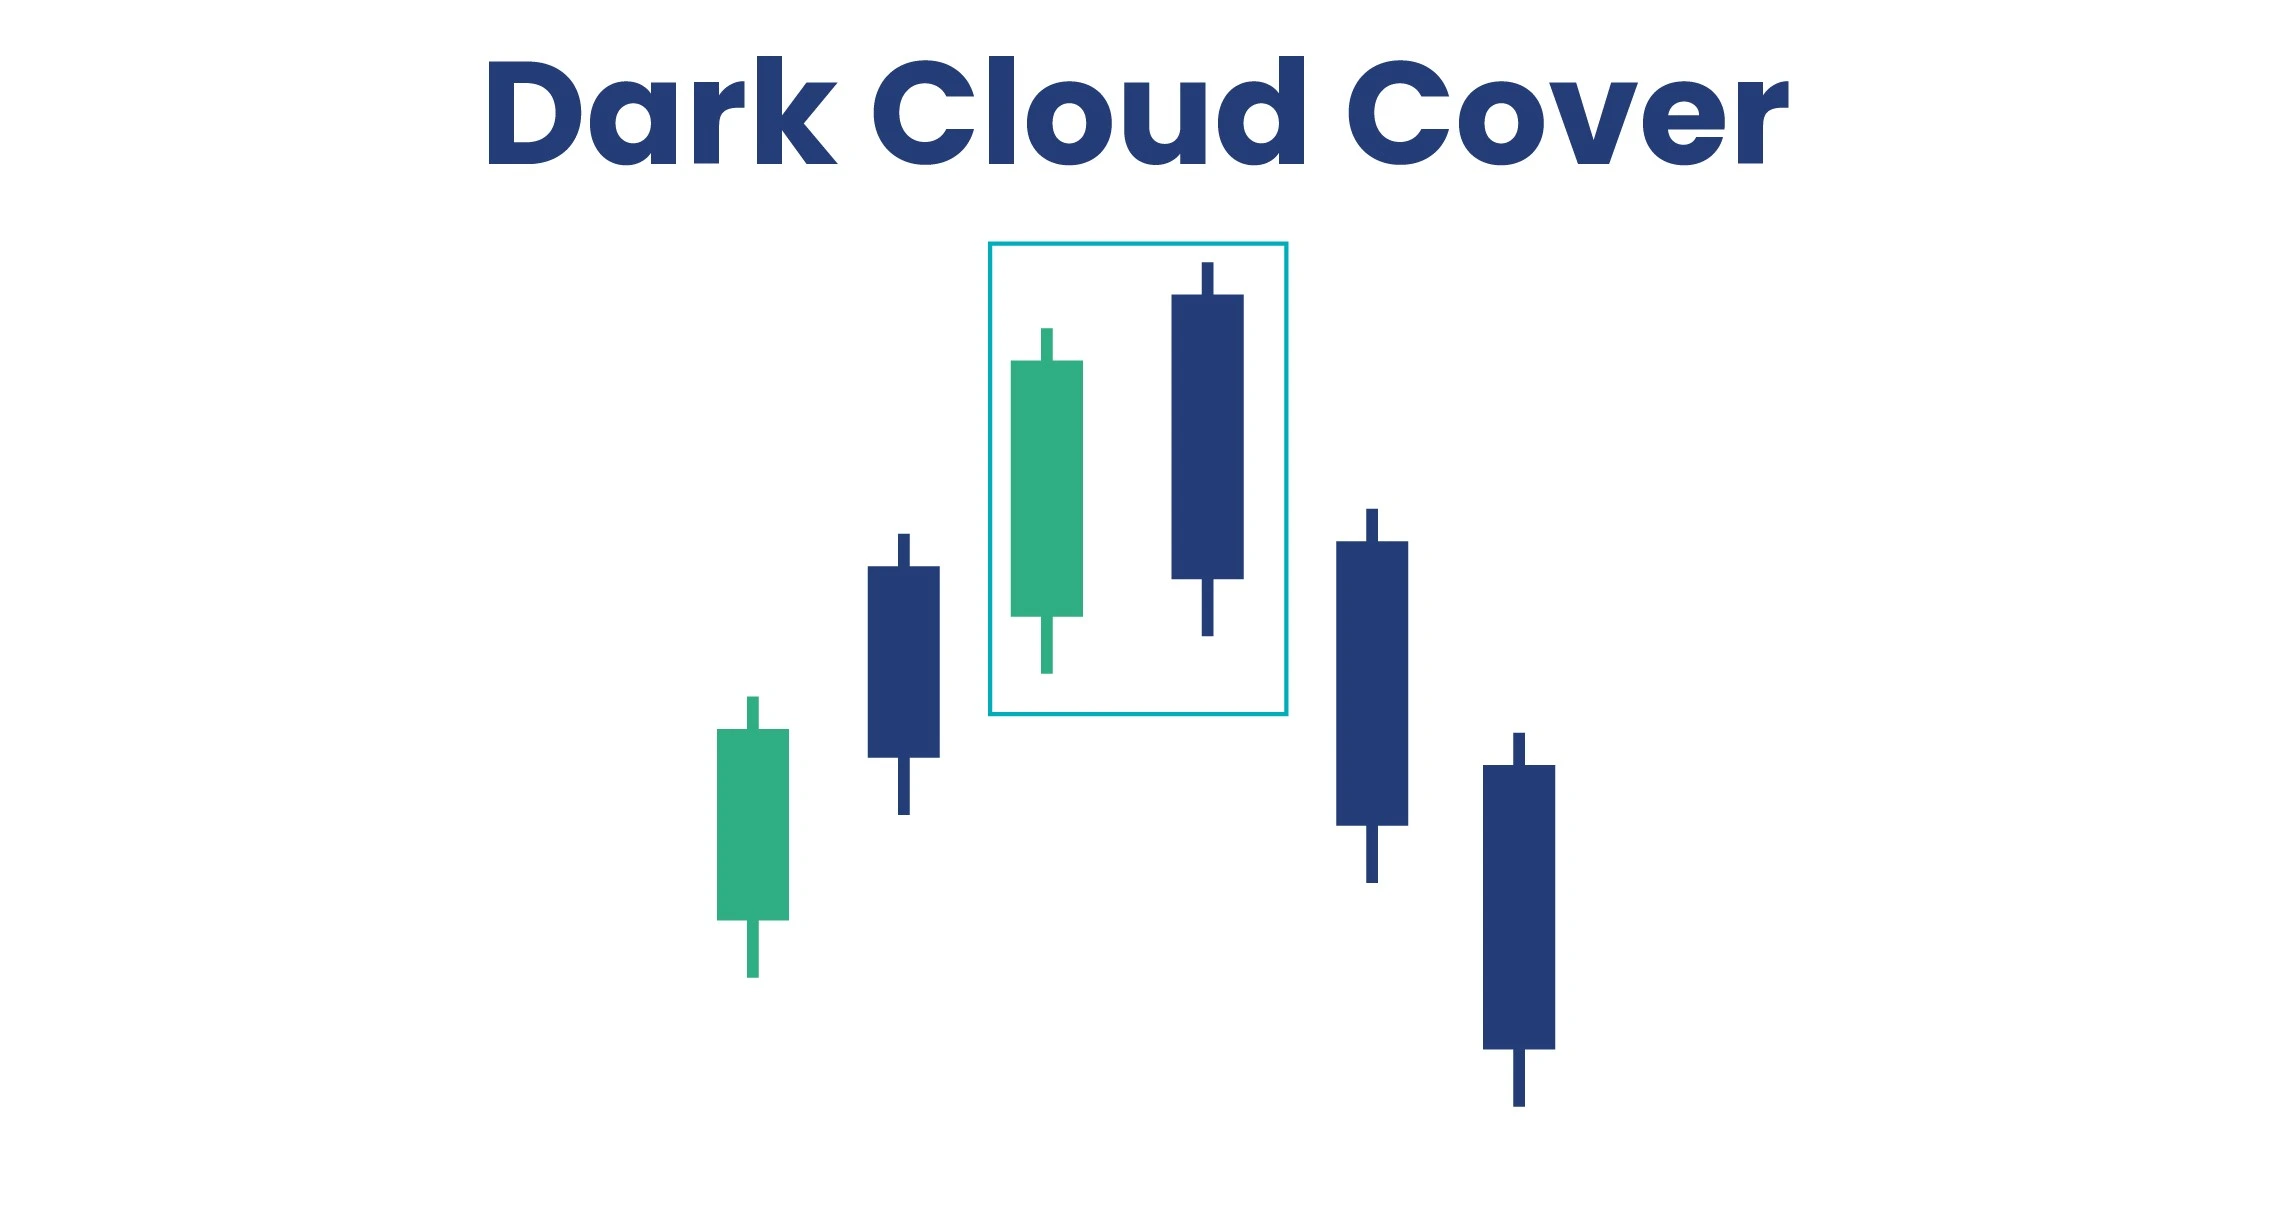
21Dark Cloud Cover Pattern
Two-candlestick pattern with a bearish candle closing below the midpoint of the previous bullish candle.
Formation:
Bullish candle followed by bearish candle opening above but closing below 50% of first
Market Psychology:
Initial optimism overcome by selling pressure
Trading Strategy:
Strong bearish signal, place stop above dark cloud high
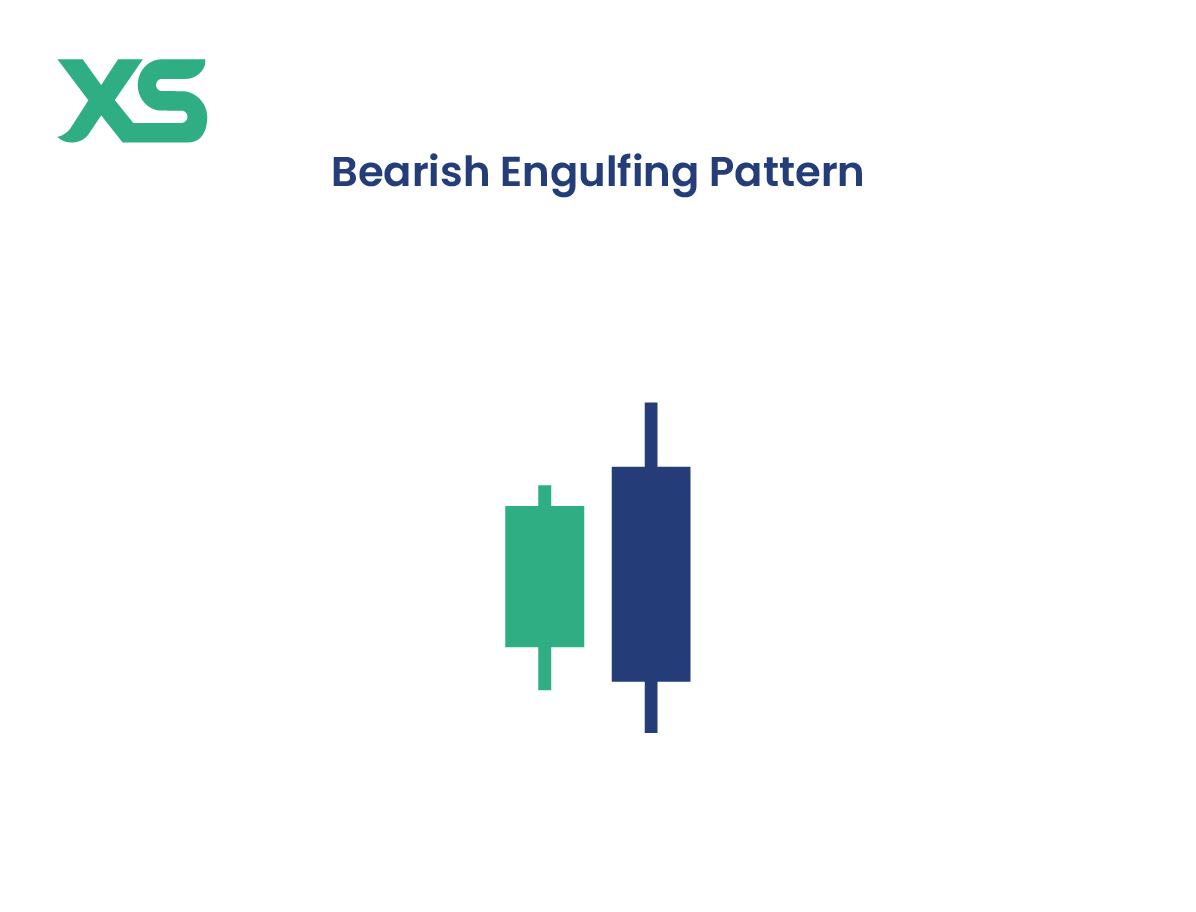
22Bearish Engulfing Pattern
Small bullish candle followed by a larger bearish candle that completely engulfs the previous one.
Formation:
Small bullish candle completely engulfed by larger bearish candle
Market Psychology:
Sellers overwhelm buyers, taking control of the market
Trading Strategy:
Strong bearish signal, consider short positions
23Evening Star Pattern
Three-candlestick pattern with a long bullish, a small-bodied, and a bearish candle signaling reversal.
Formation:
Long bullish candle, small star, long bearish candle
Market Psychology:
Bullish momentum exhausted, bearish sentiment emerging
Trading Strategy:
Strong reversal signal, increasing volume strengthens pattern

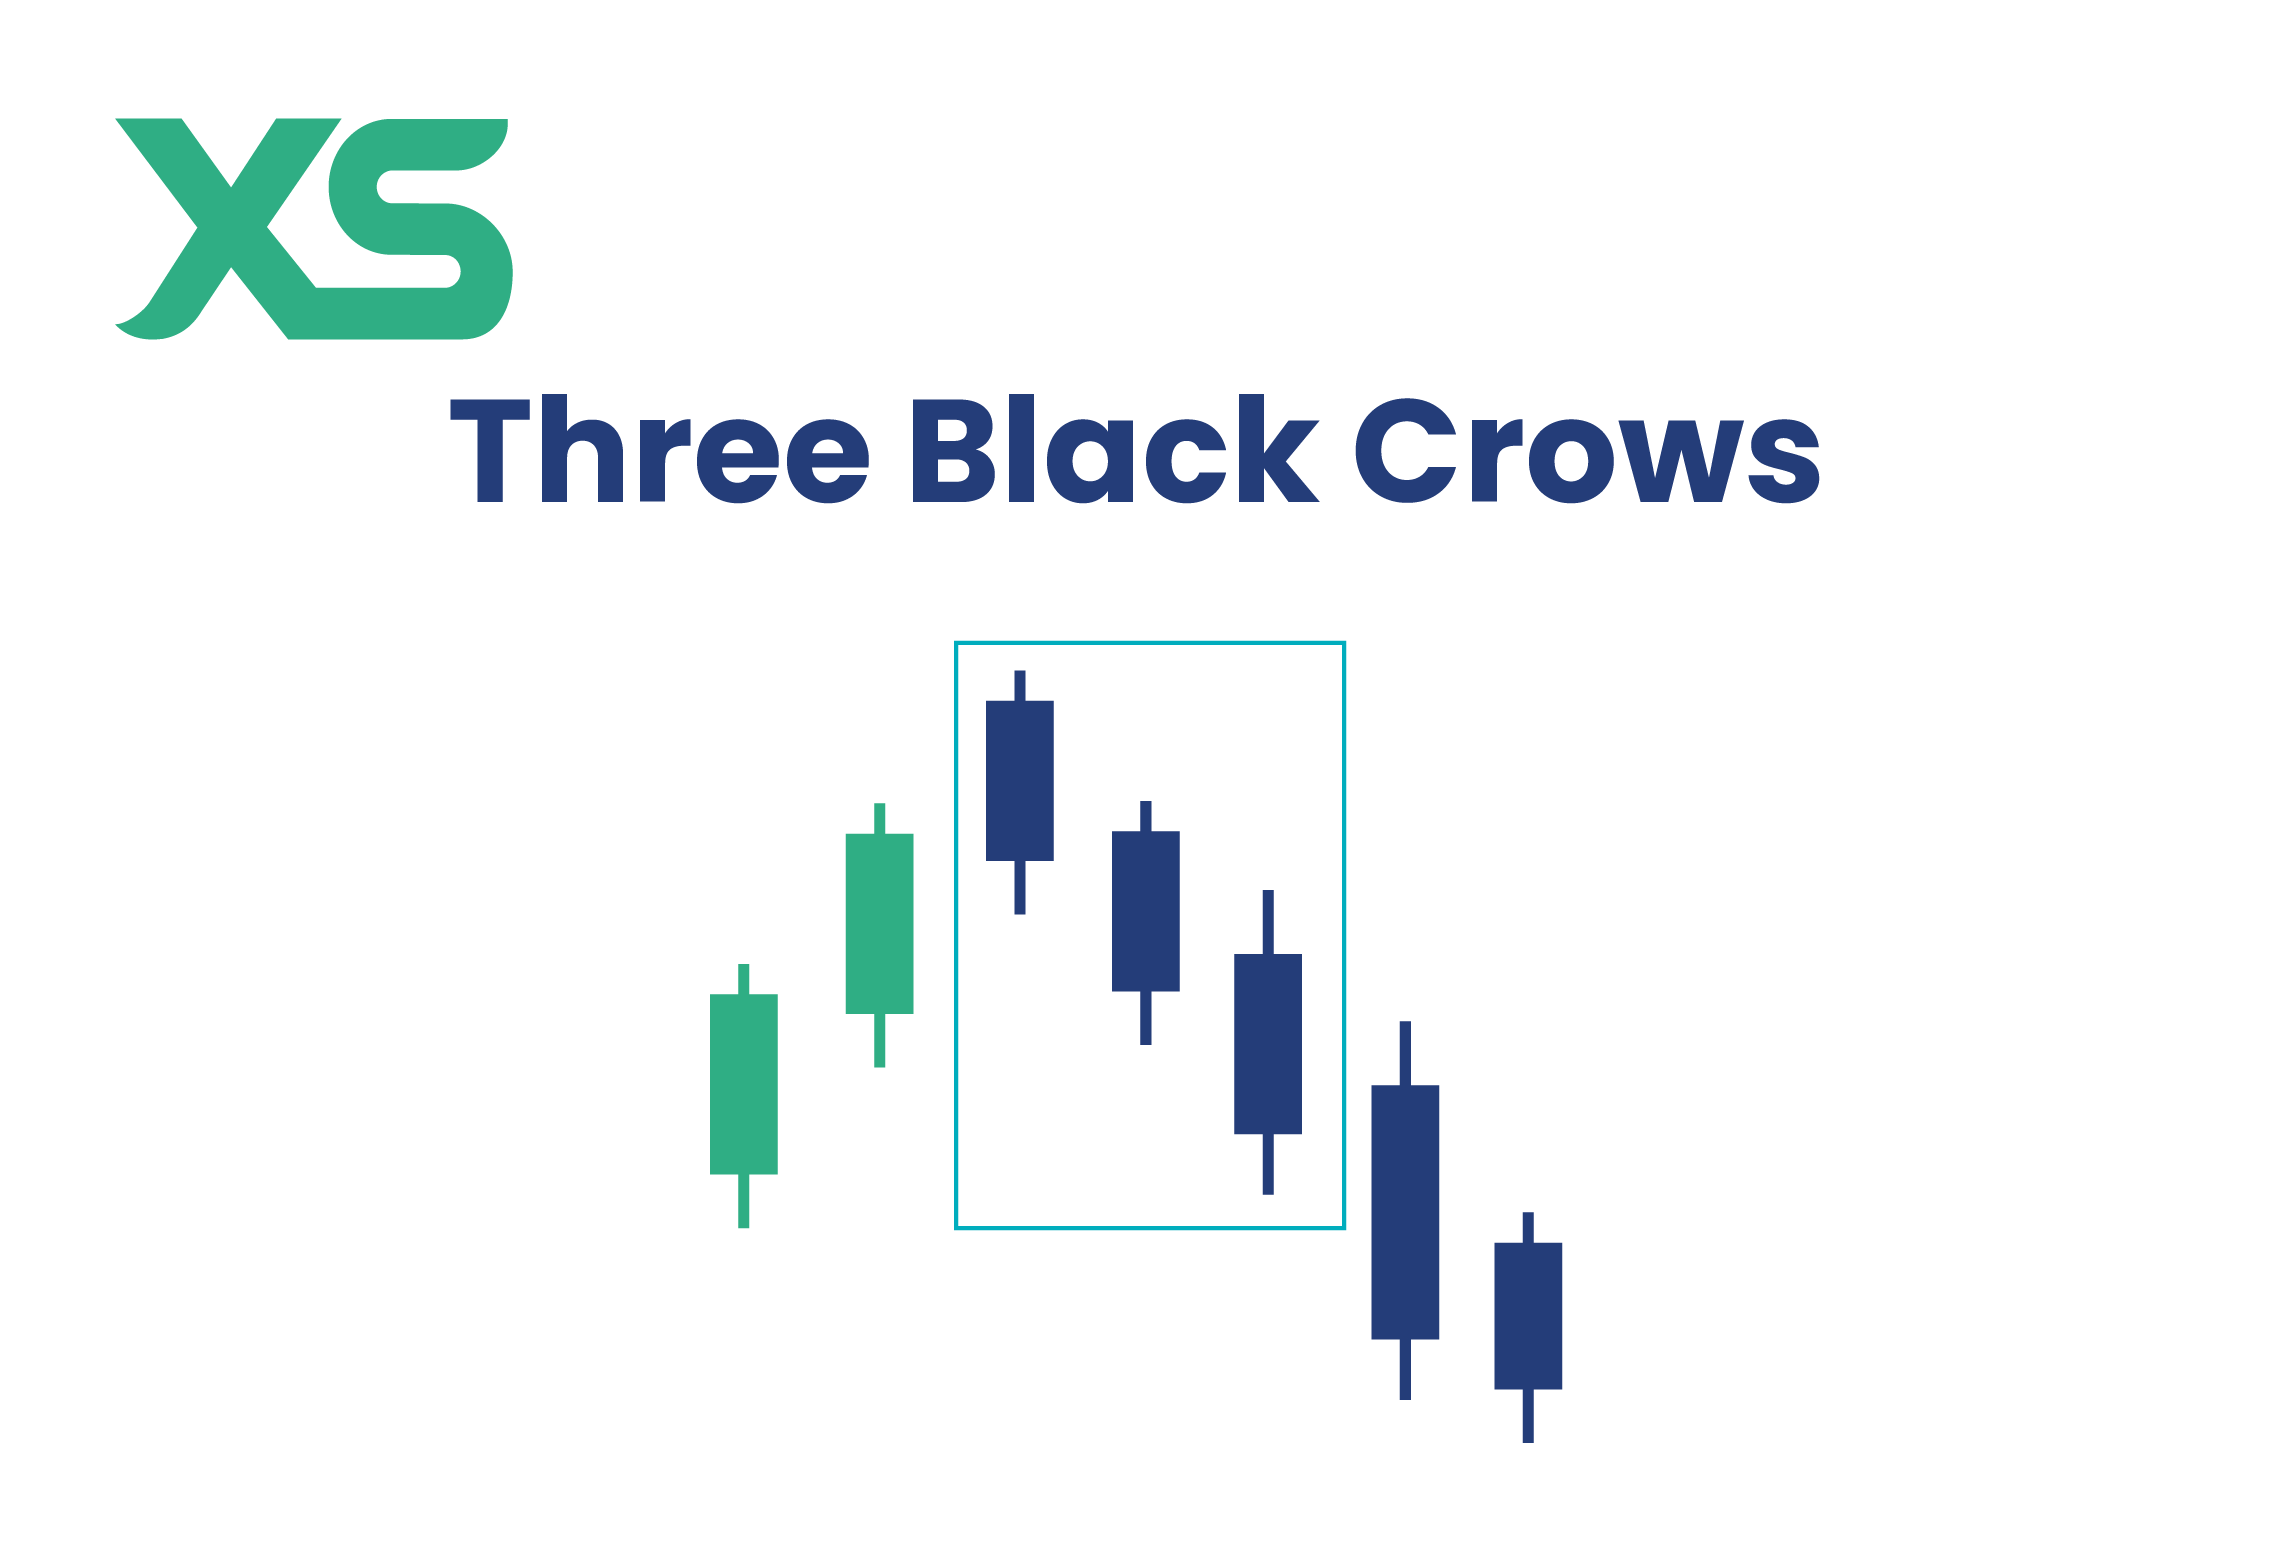
24Three Black Crows Pattern
Three consecutive long bearish candlesticks with small or no wicks, indicating strong selling pressure.
Formation:
Three consecutive long bearish candles opening within previous body
Market Psychology:
Sustained and intense selling pressure
Trading Strategy:
Strong continuation signal, bearish trend likely to persist
25Three Inside Down Pattern
Three-candlestick pattern with a long bullish, a smaller bearish, and a third bearish candle signaling reversal.
Formation:
Long bullish, smaller bearish inside, third bearish below first close
Market Psychology:
Gradual shift from bullish to bearish sentiment
Trading Strategy:
Confirms bearish reversal, consider short positions
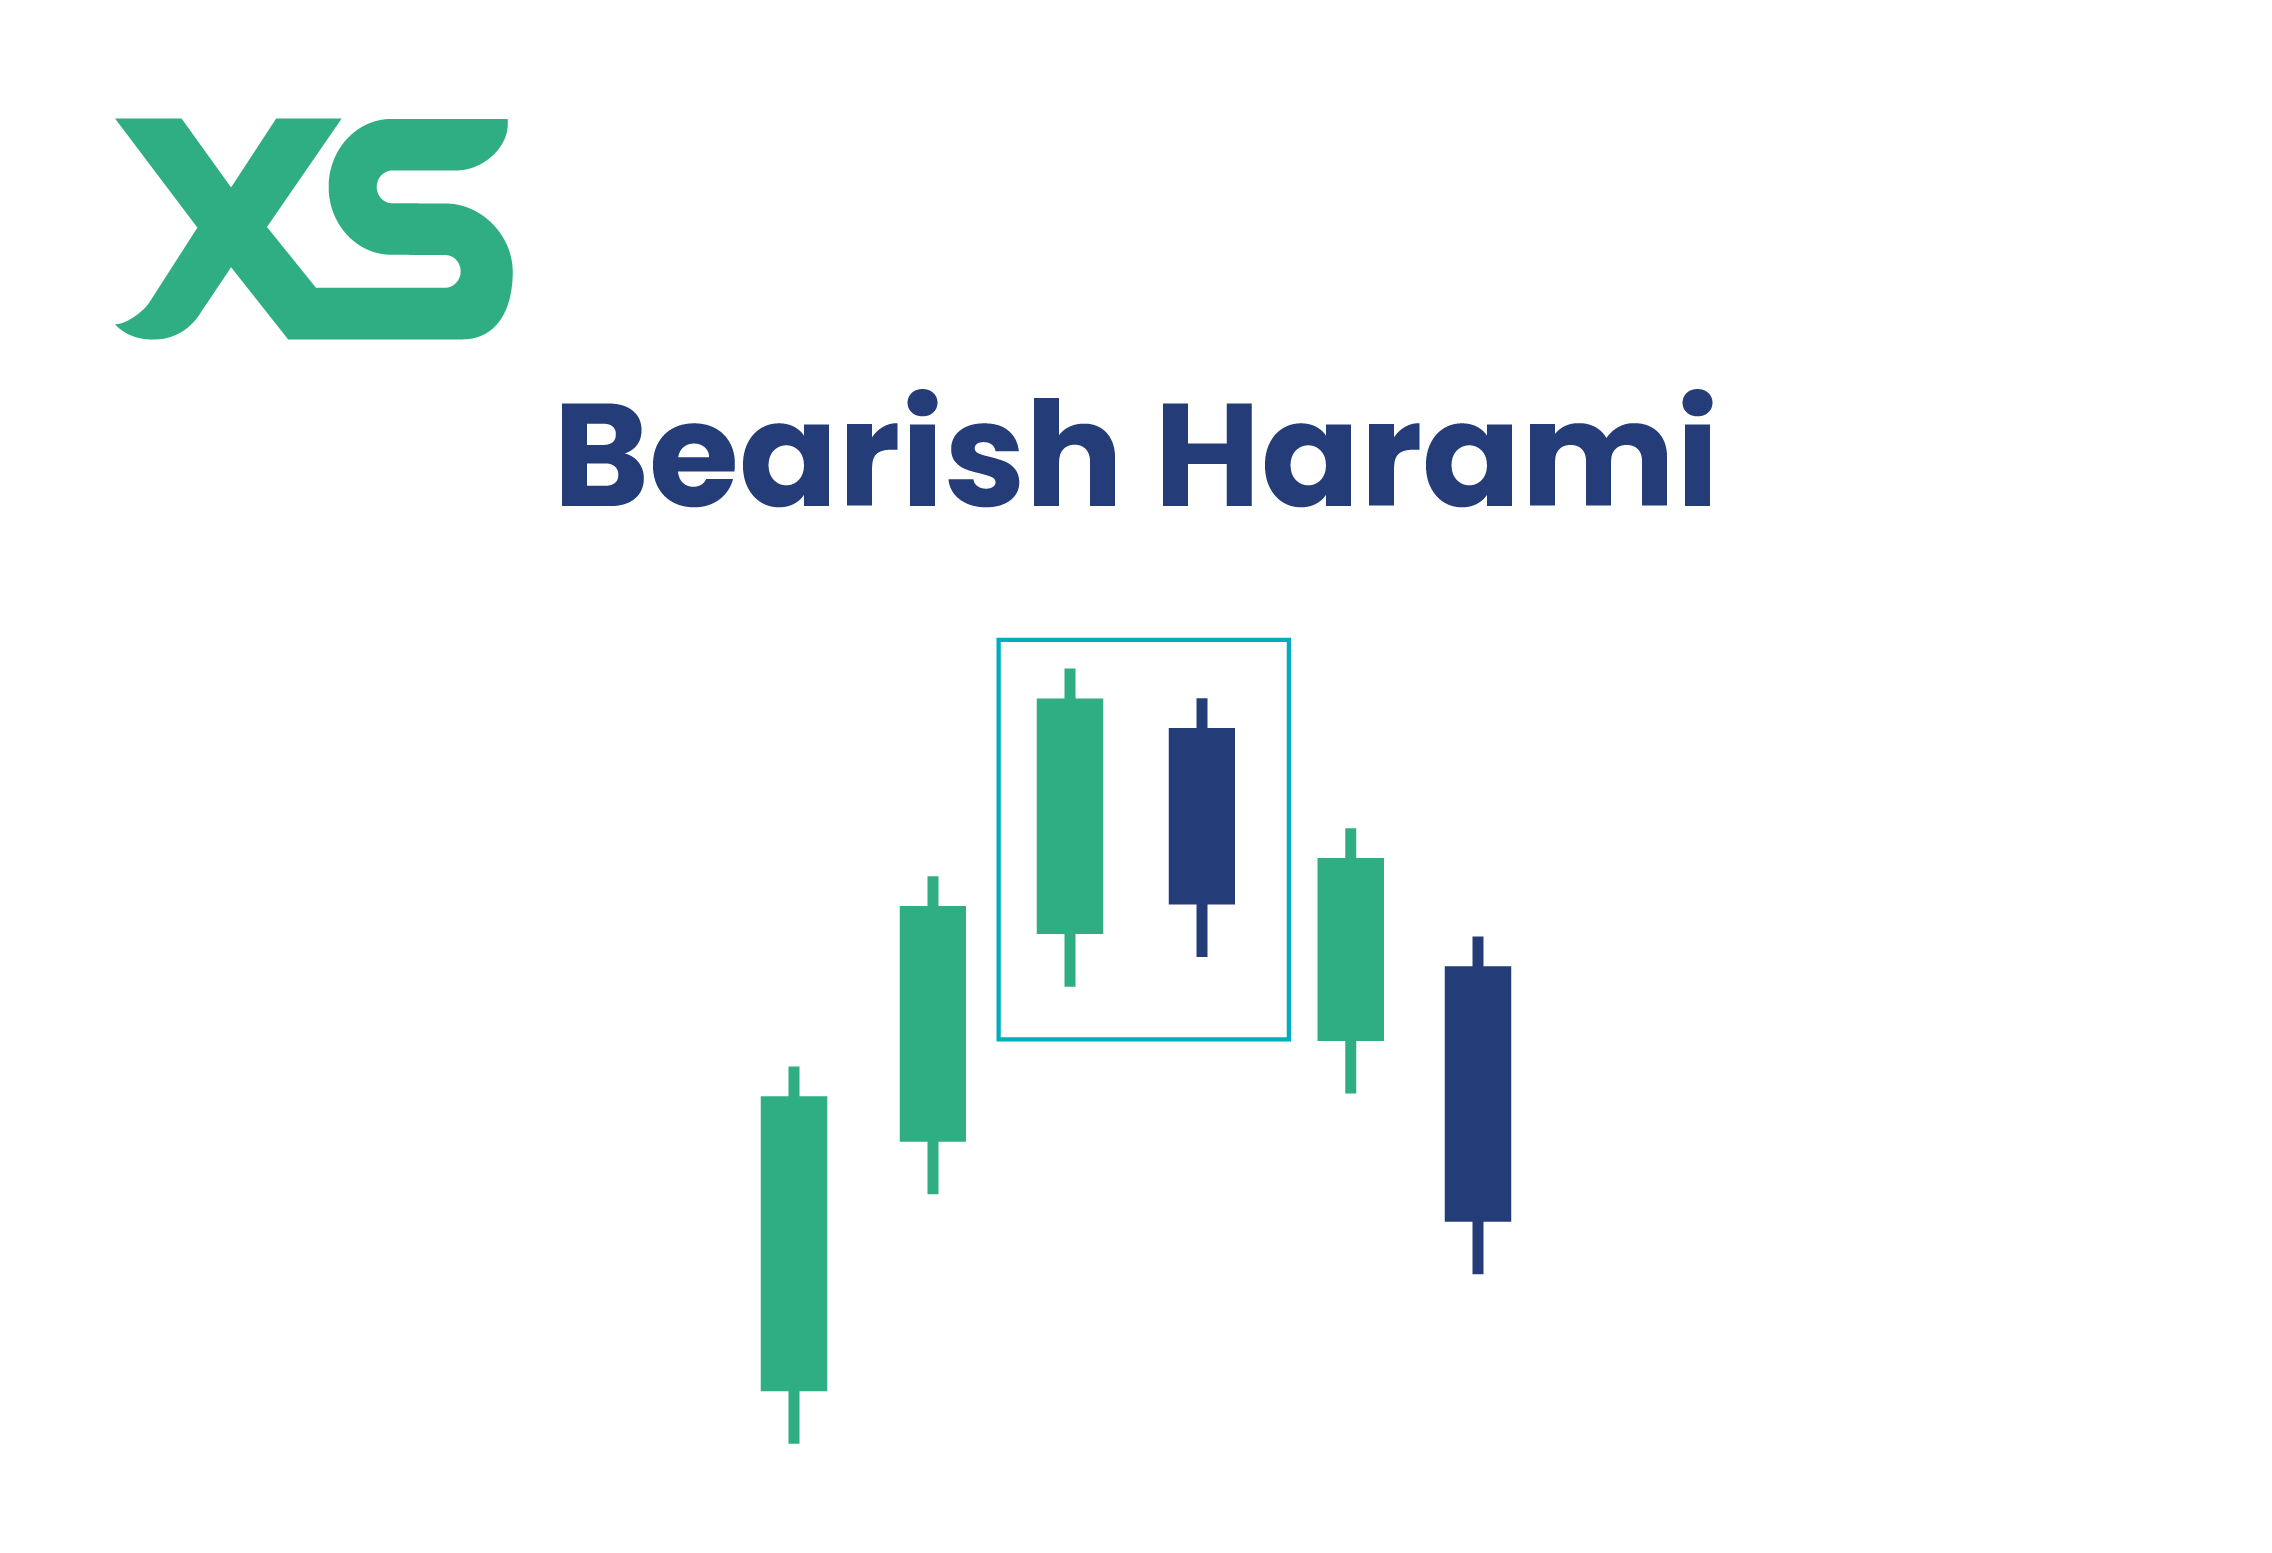
26Bearish Harami Pattern
A small bearish candle forms within the body of a preceding large bullish candle, signaling weakening buying pressure.
Formation:
Small bearish candle completely contained within large bullish candle body
Market Psychology:
Buying pressure weakening, sellers may be gaining control
Trading Strategy:
Potential trend reversal from bullish to bearish
27Shooting Star Pattern
Small body with a long upper wick, signaling resistance and a potential downward reversal.
Formation:
Small body with long upper shadow, little to no lower wick
Market Psychology:
Bulls tried to rally but bears took control
Trading Strategy:
Most effective at resistance levels, enter short on break below low
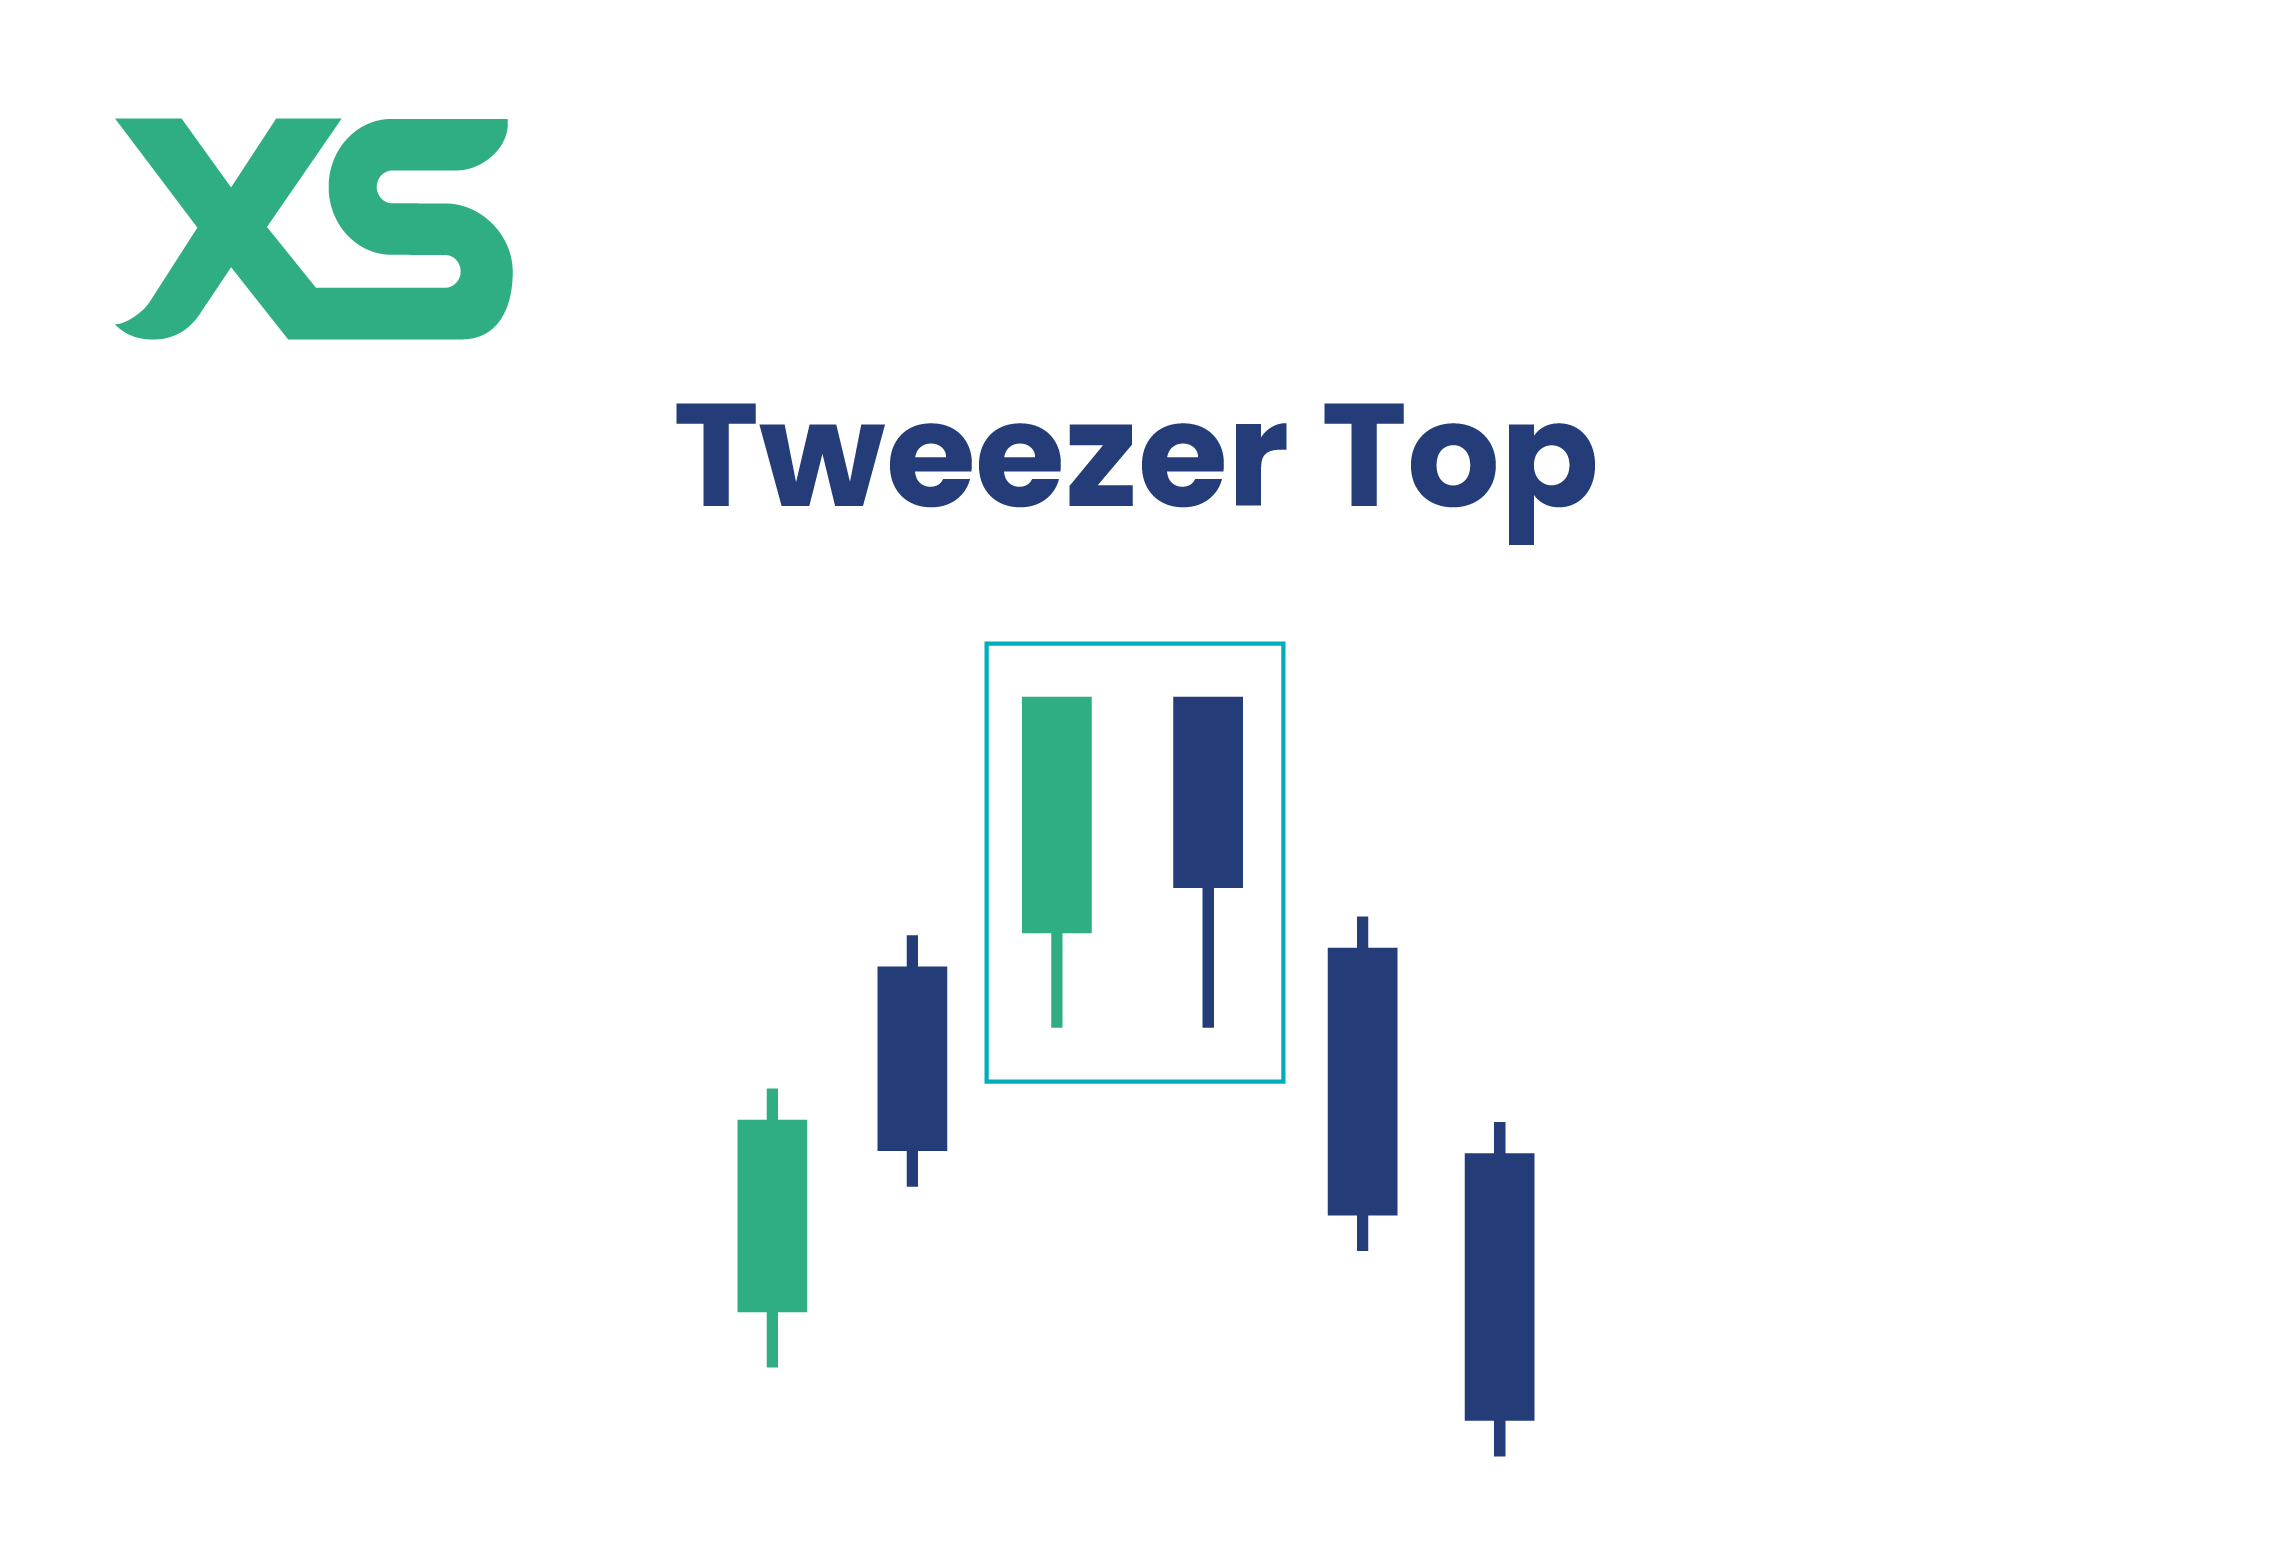
28Tweezer Top Pattern
Two candlesticks with matching highs, indicating strong resistance and a potential downward reversal.
Formation:
Two consecutive candlesticks touching the same high point
Market Psychology:
Strong resistance level found, selling pressure emerging
Trading Strategy:
Potential downward reversal from resistance level
29Bearish Counterattack Pattern
Bullish candle followed by a bearish candle that closes at the same level, signaling reversal.
Formation:
Bullish candle followed by bearish candle closing at identical level
Market Psychology:
Sellers counter initial buying pressure
Trading Strategy:
Potential reversal signal, consider short positions
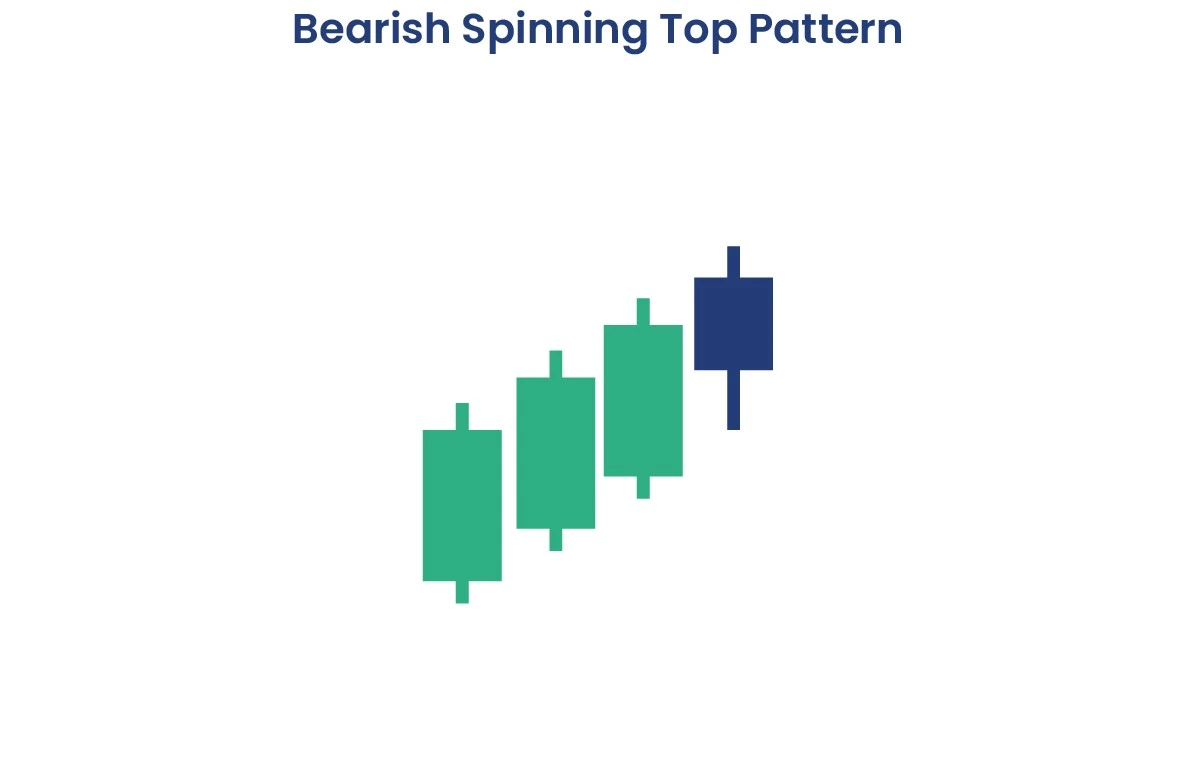
30Bearish Spinning Top Pattern
Small body with long wicks on both sides, signaling indecision but weakening buying pressure after an uptrend.
Formation:
Small body with long upper and lower wicks
Market Psychology:
Indecision with weakening buying pressure
Trading Strategy:
Wait for bearish confirmation
31Bearish Kicker Pattern
Bullish candle followed by a bearish candle that opens below the previous close, signaling strong reversal.
Formation:
Bullish candle followed by gapping down bearish candle
Market Psychology:
Sudden shift from bullish to bearish sentiment
Trading Strategy:
Strong bearish signal with gap confirmation
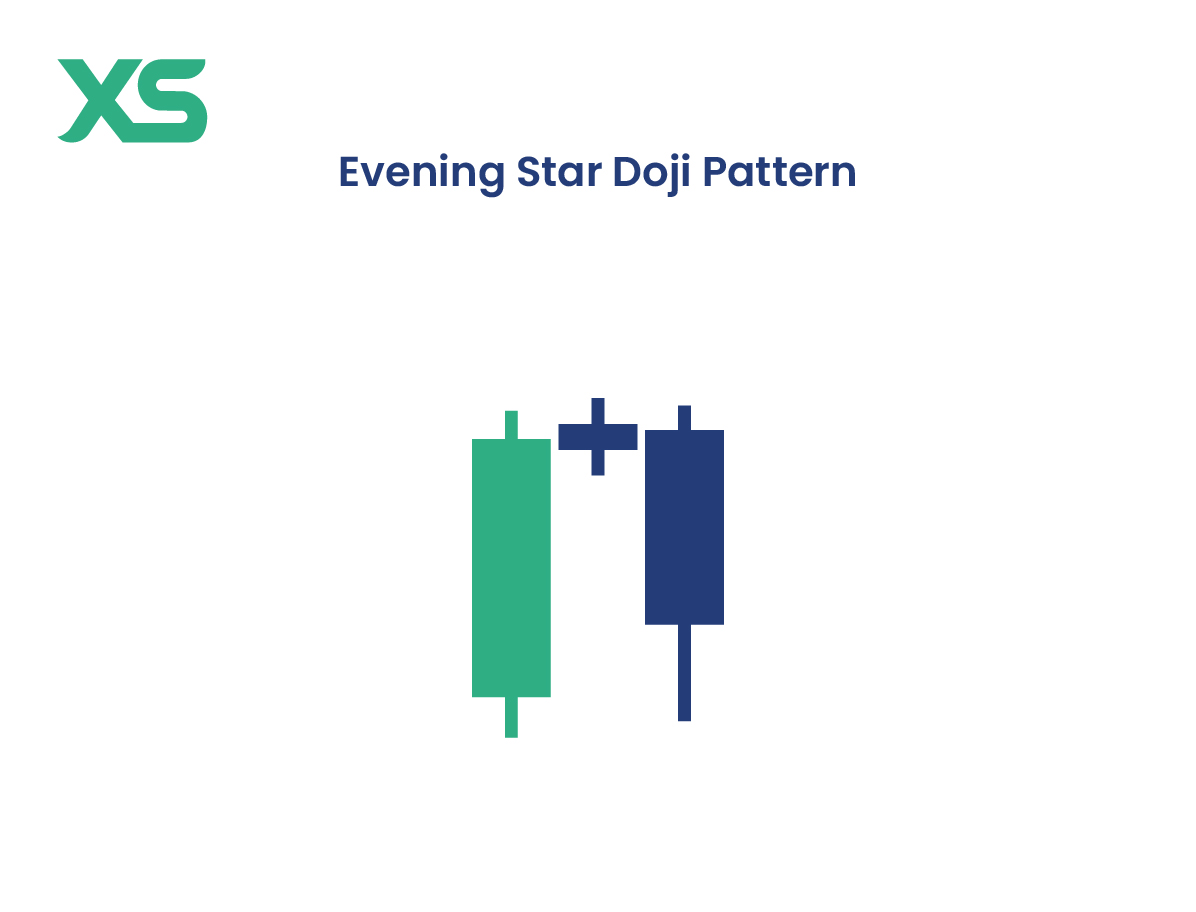
32Evening Star Doji Pattern
Evening star pattern with a doji as the middle candle, signaling indecision before a bearish reversal.
Formation:
Long bullish candle, doji star, long bearish candle
Market Psychology:
Bullish momentum exhausted, indecision before bearish turn
Trading Strategy:
Strong reversal with doji confirmation
33Bearish Abandoned Baby Pattern
Three-candle pattern with a long bullish, a doji, and a bearish candle gapping down, signaling strong reversal.
Formation:
Long bullish, doji gapping up, bearish gapping down
Market Psychology:
Dramatic sentiment shift from bullish to bearish
Trading Strategy:
Very strong reversal signal
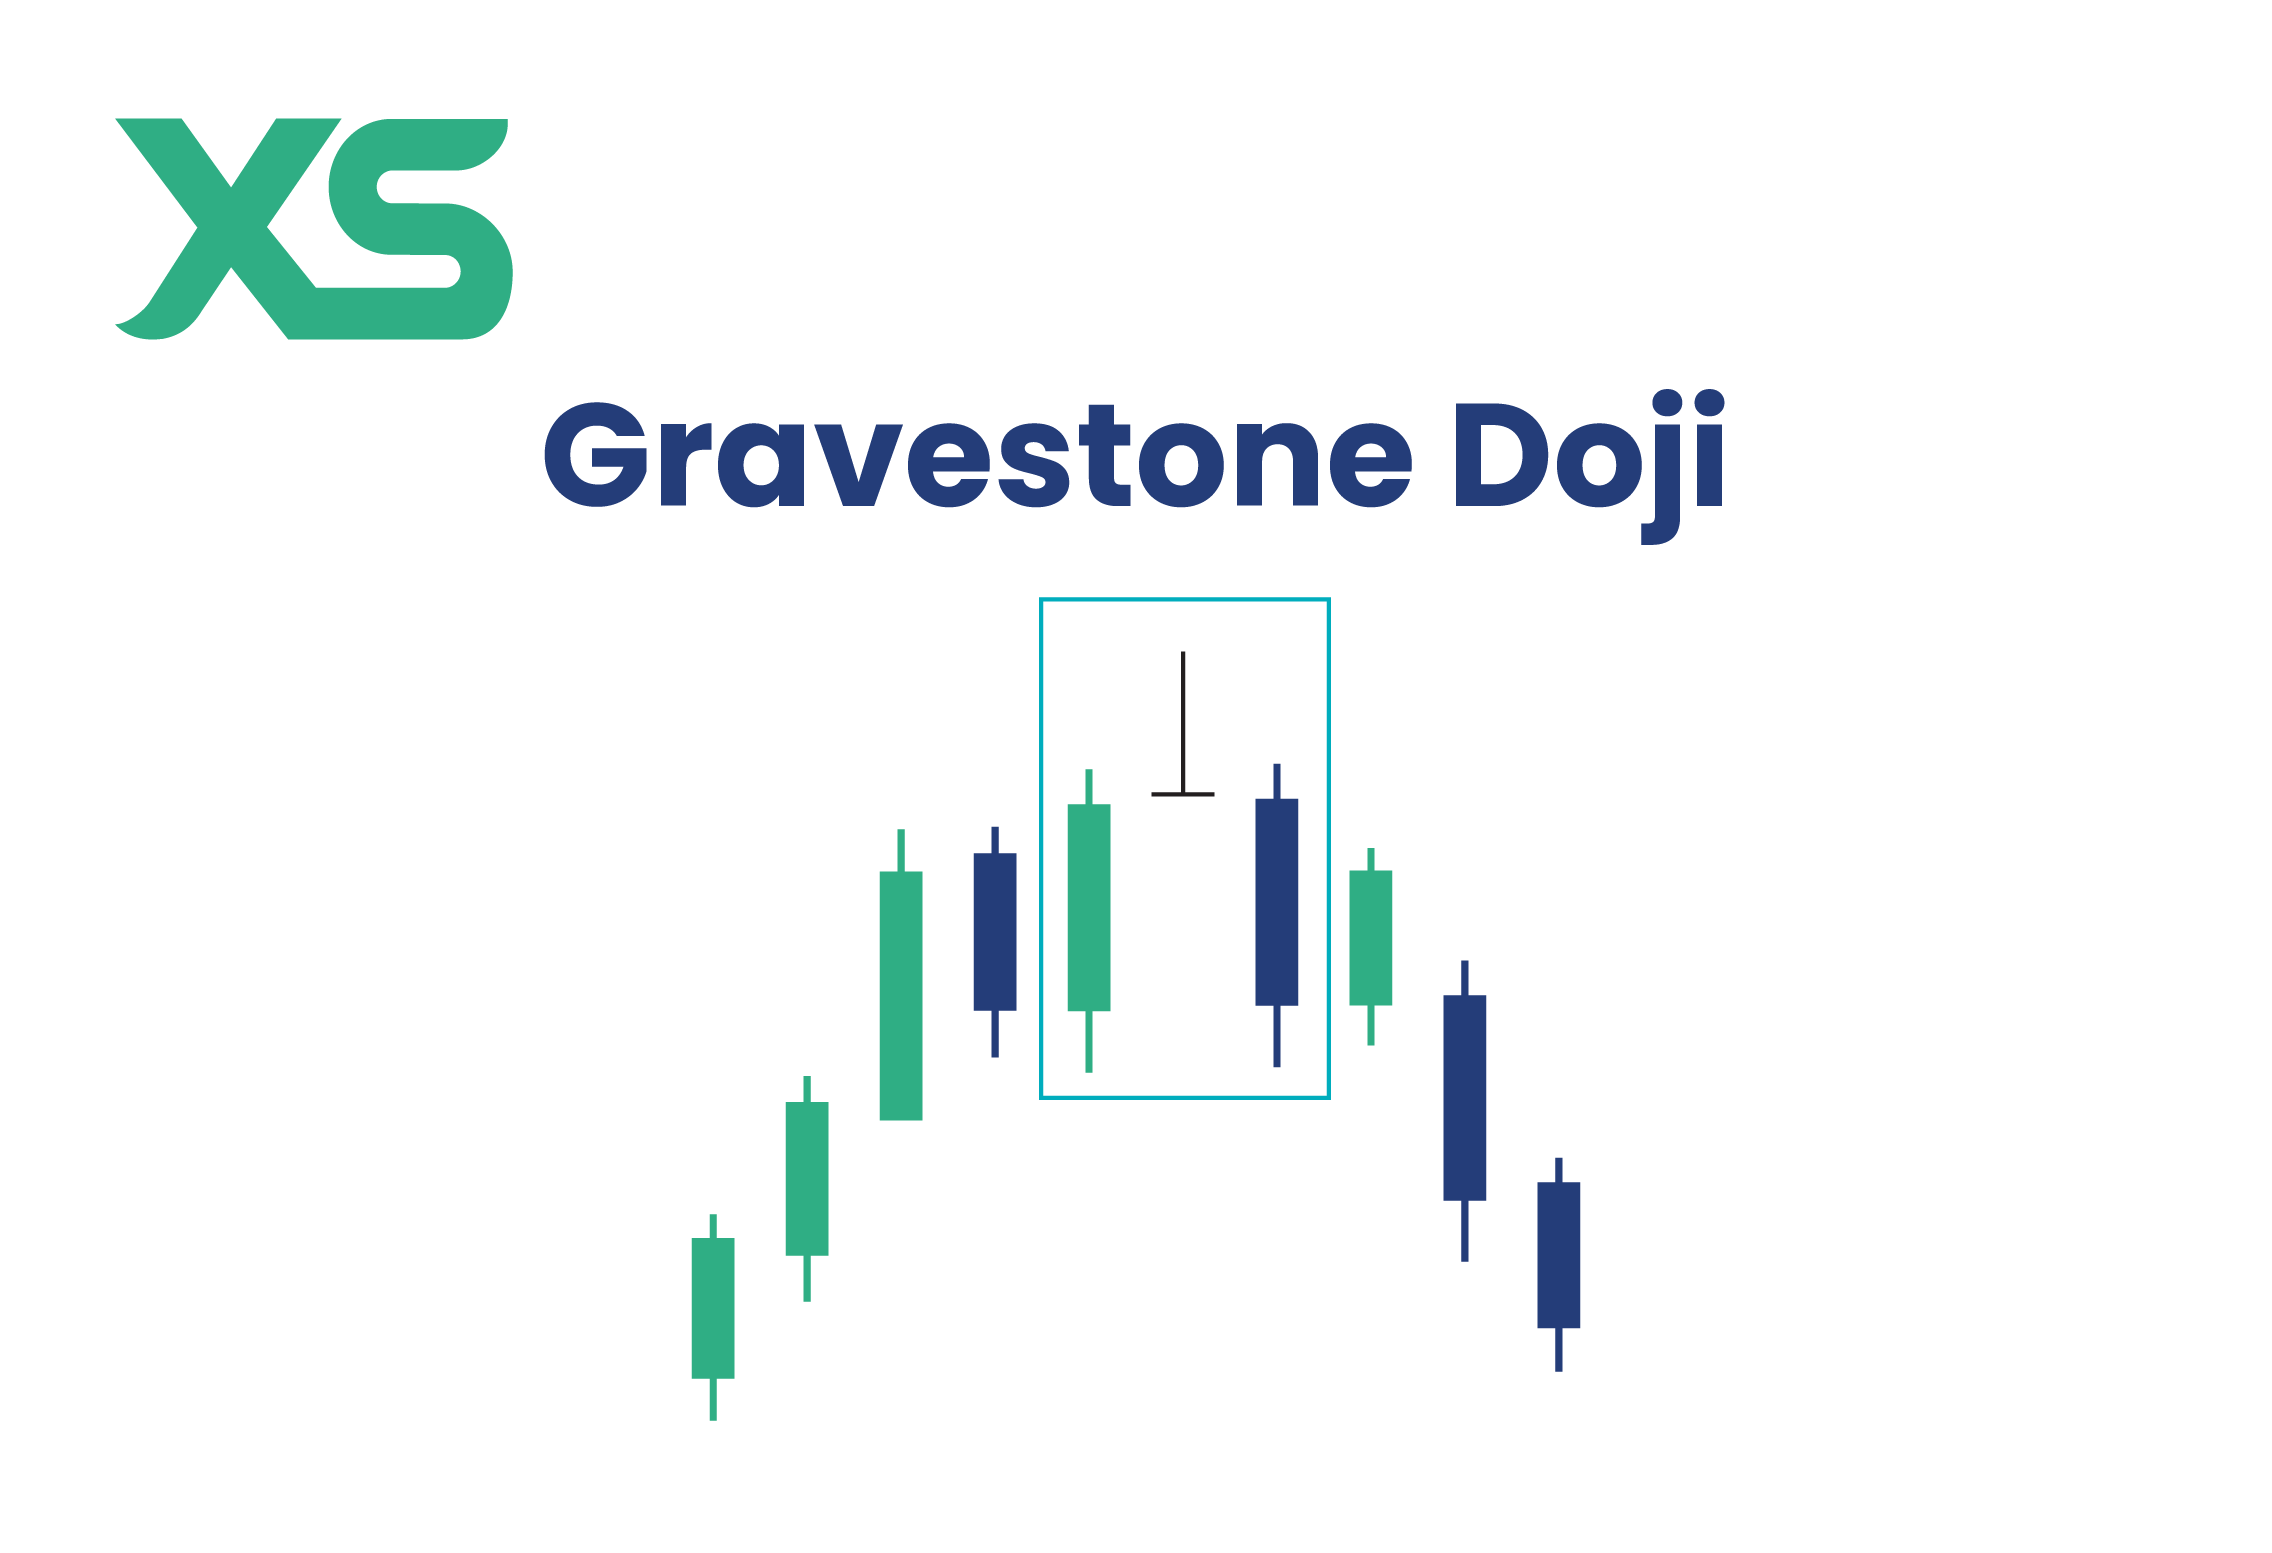
34Gravestone Doji Pattern
A doji with a long upper wick, signaling selling pressure overcoming buying at the top of an uptrend.
Formation:
Open and close at bottom, long upper shadow
Market Psychology:
Buyers pushed up but sellers recovered control
Trading Strategy:
Most effective at major resistance levels
35Bearish Tri-Star Pattern
Three consecutive doji candles signaling extreme market indecision at the top of an uptrend, often preceding a significant reversal.
Formation:
Three doji candles appearing consecutively after an uptrend
Market Psychology:
Extreme indecision with neither bulls nor bears in control
Trading Strategy:
Wait for bearish confirmation before entering short positions
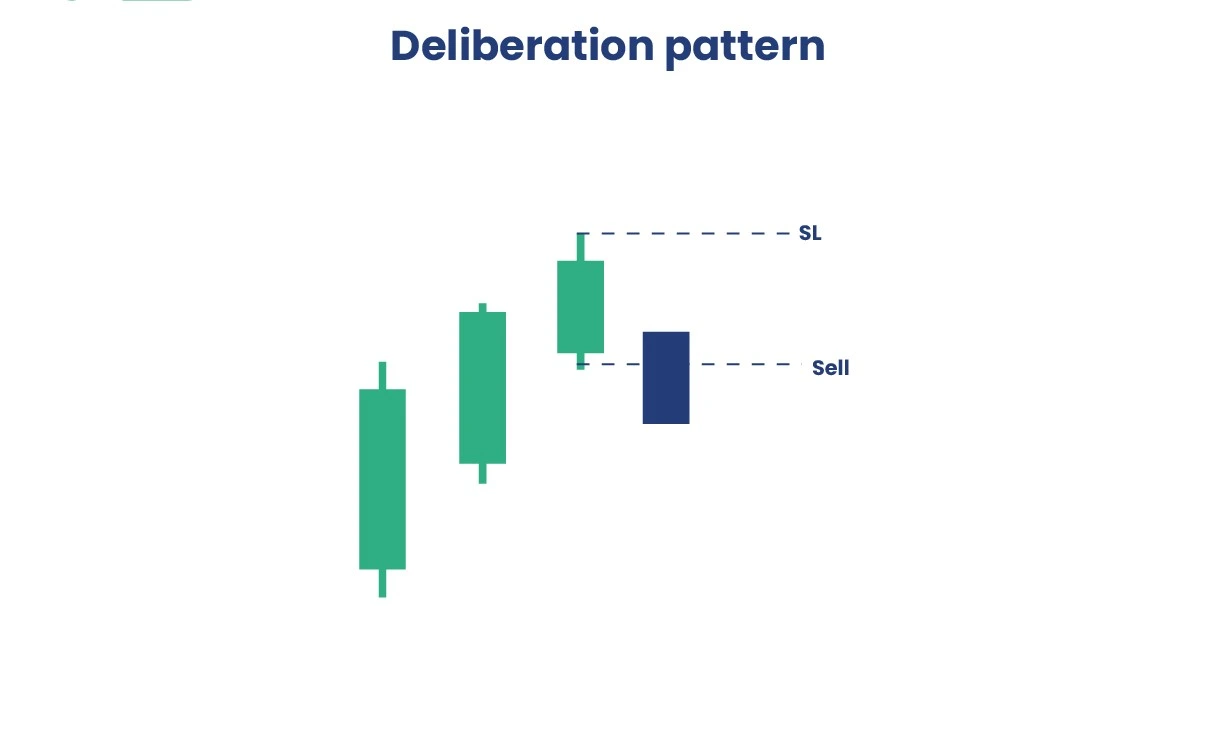
36Deliberation Pattern
Three progressively smaller bullish candles after an uptrend, indicating weakening buying momentum and potential reversal.
Formation:
Three bullish candles each smaller than the previous one
Market Psychology:
Diminishing buying pressure suggests trend exhaustion
Trading Strategy:
Look for bearish confirmation to enter short positions
37Upside Gap Two Crows Pattern
A bullish candle followed by a gap up and two bearish candles, signaling failed buying attempt and potential reversal.
Formation:
Bullish candle, gap up, then two consecutive bearish candles
Market Psychology:
Initial optimism followed by selling pressure taking control
Trading Strategy:
Enter short on completion of second bearish candle
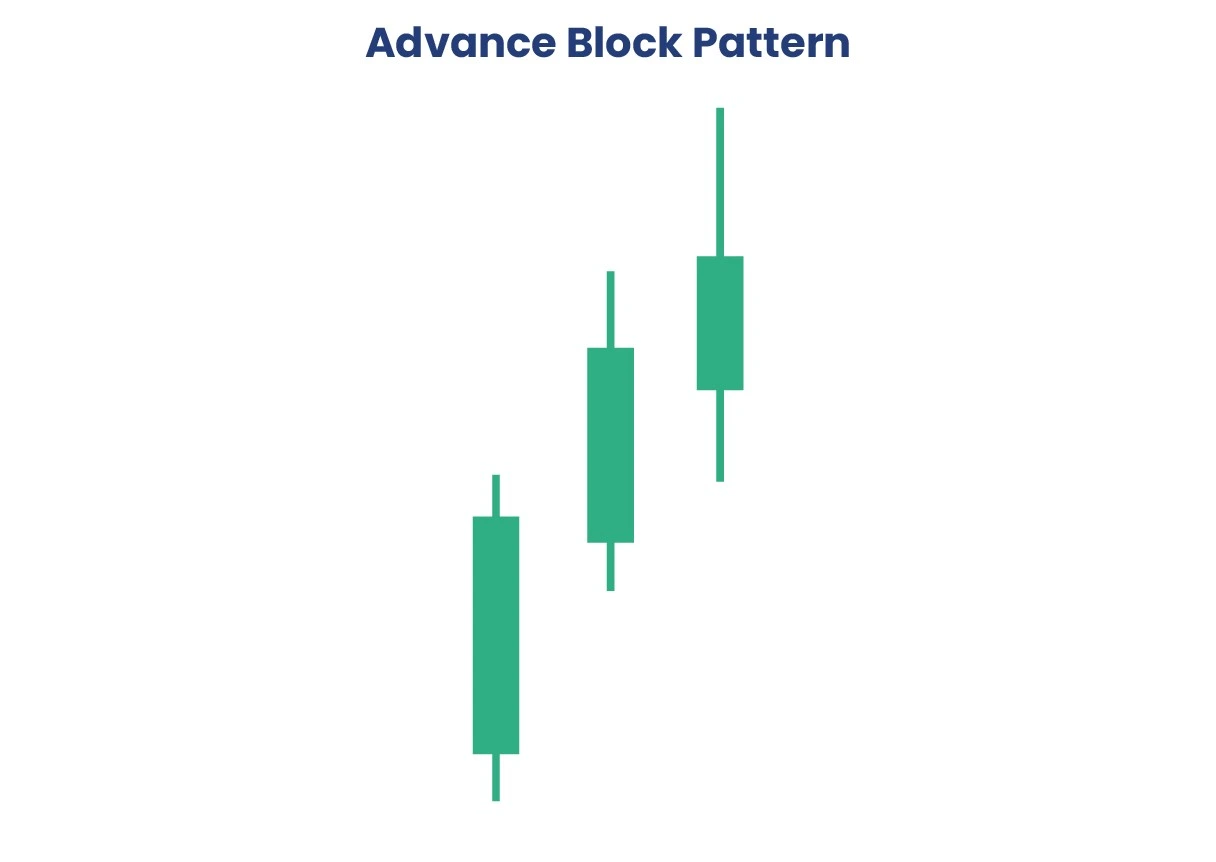
38Advance Block Pattern
Three bullish candles with progressively smaller bodies and longer upper wicks, showing weakening upward momentum.
Formation:
Three bullish candles with decreasing bodies and increasing upper wicks
Market Psychology:
Bulls struggling to maintain control as selling pressure increases
Trading Strategy:
Warning sign for trend exhaustion, prepare for bearish reversal
Continuation Patterns (39-59)
39Falling Three Methods Pattern
Long bearish candle followed by three smaller bullish candles within its range, and another long bearish candle.
Formation:
Long bearish, three small bullish consolidation, final long bearish
Market Psychology:
Brief pause in downtrend before continuation
Trading Strategy:
Strong continuation signal when complete
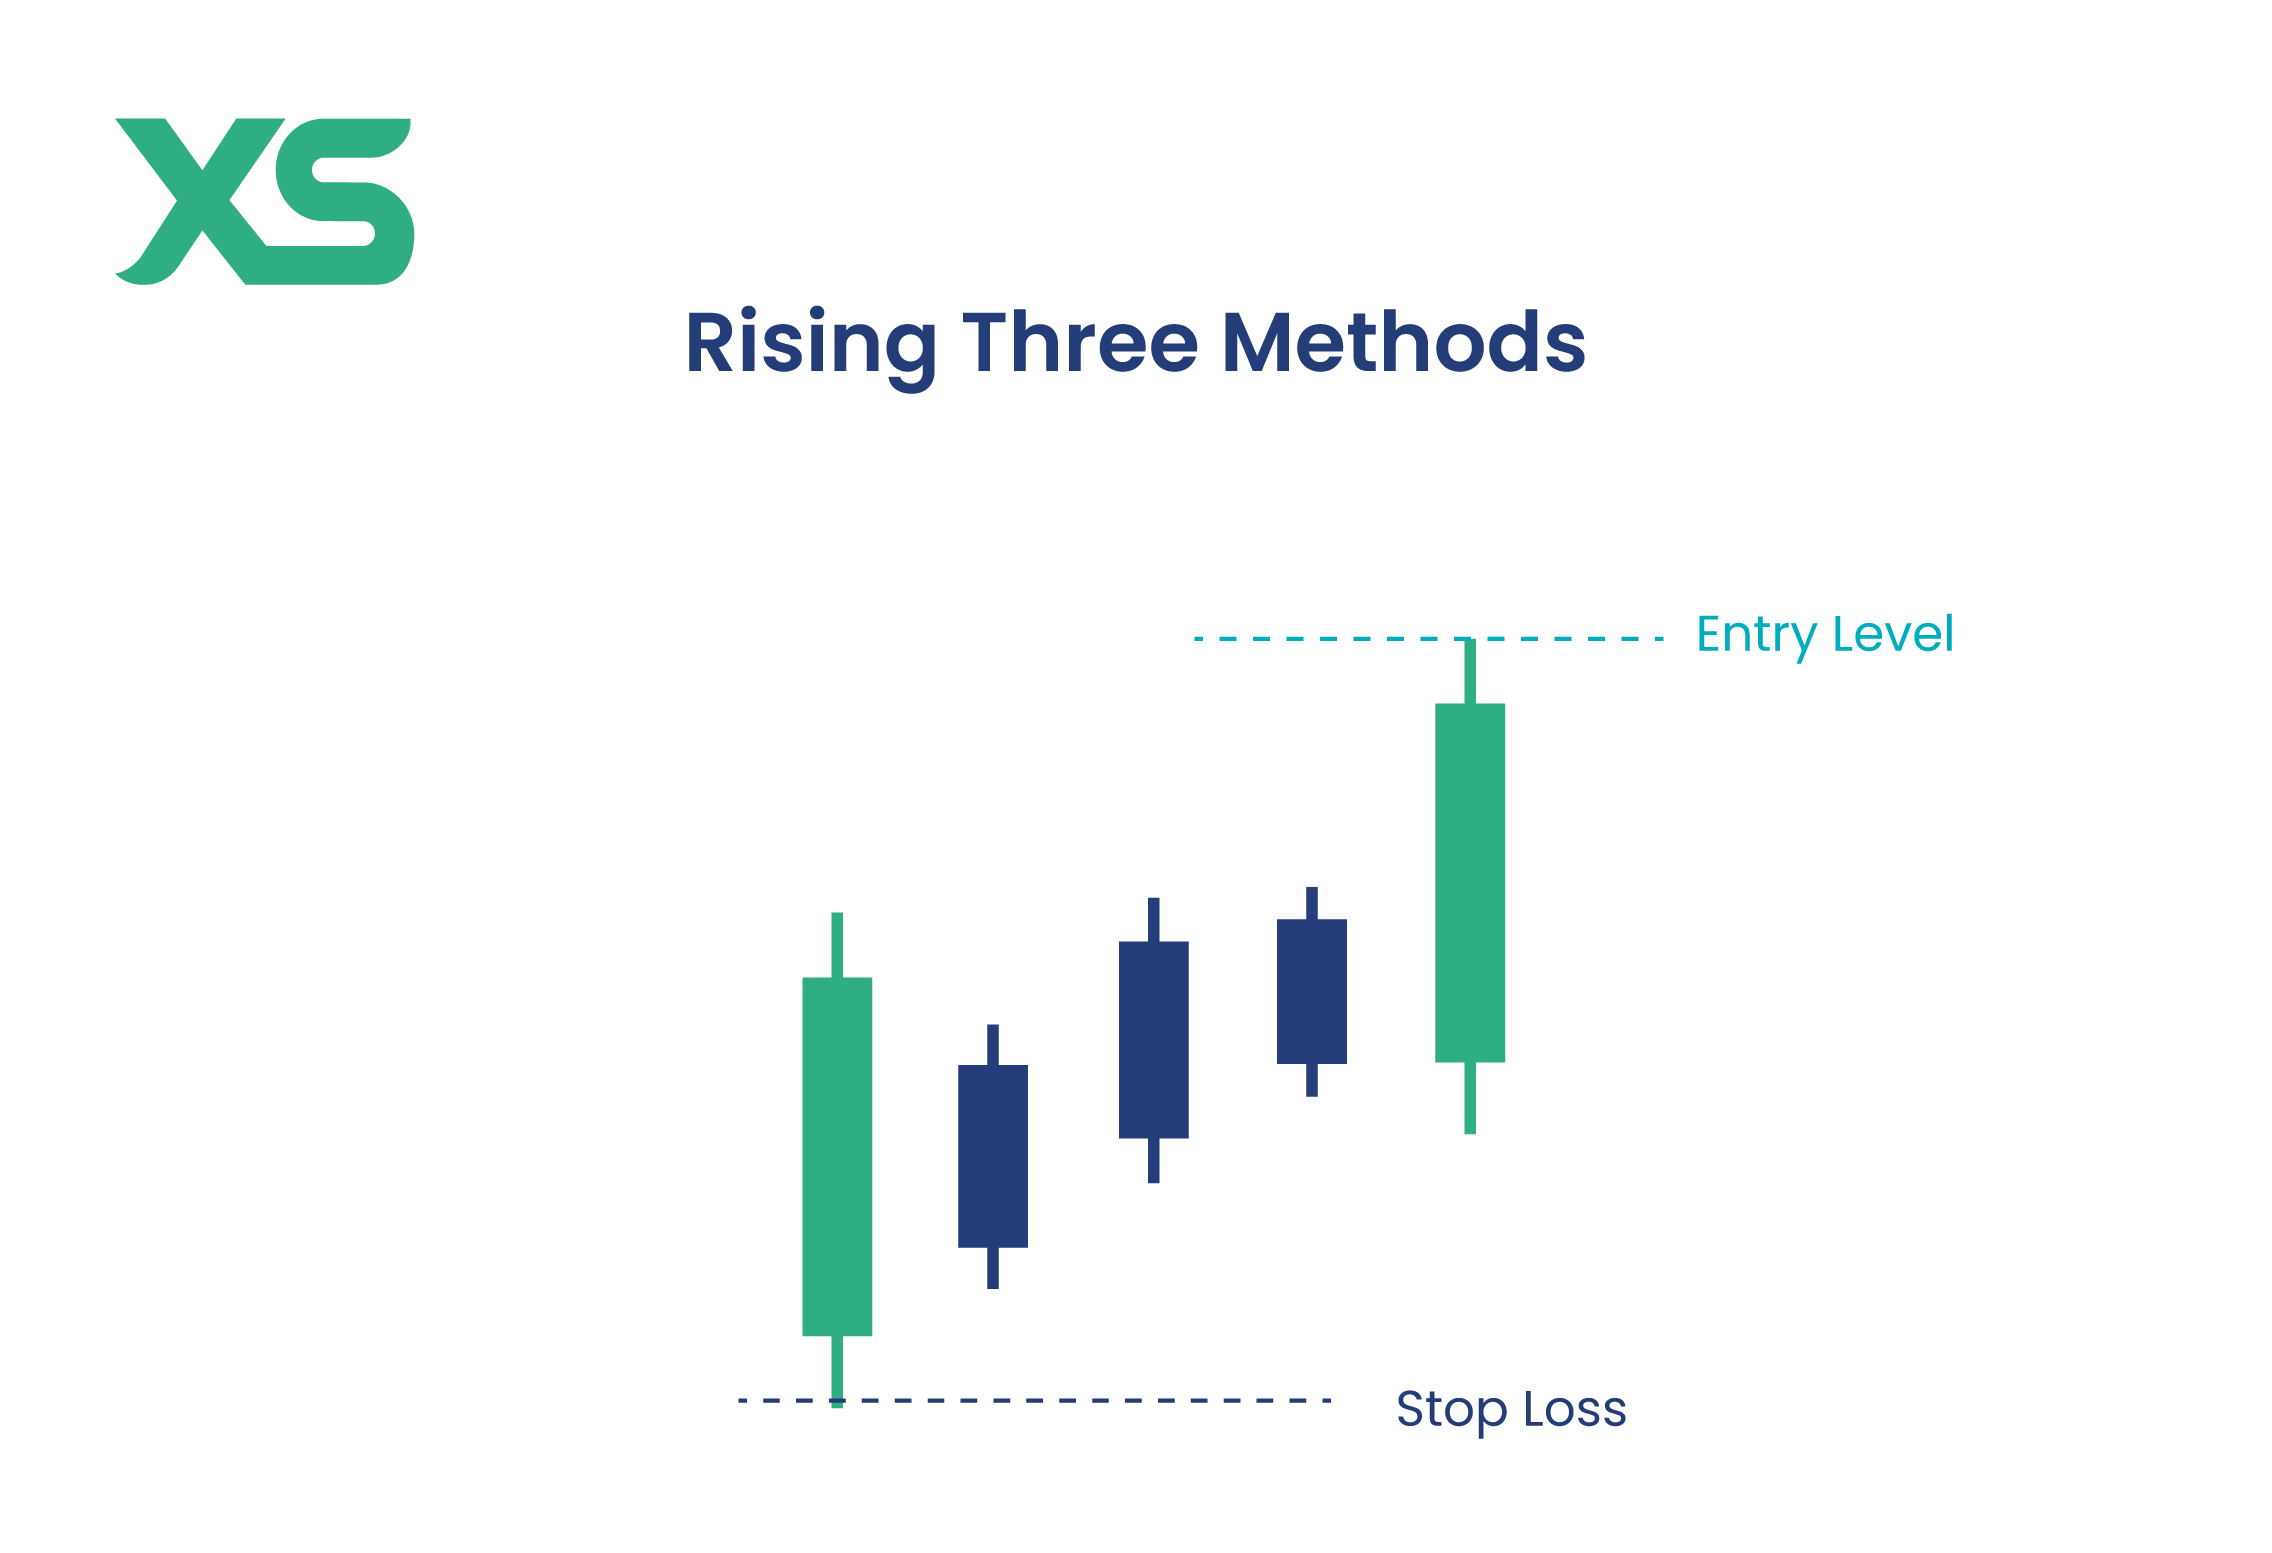
40Rising Three Methods Pattern
Long bullish candle followed by three smaller bearish candles within its range, and another long bullish candle.
Formation:
Long bullish, three small bearish consolidation, final long bullish
Market Psychology:
Brief pause in uptrend before continuation
Trading Strategy:
Strong bullish continuation, measure target from pattern height
41Upside Tasuki Gap Pattern
A bullish candle gaps up, followed by a bearish candle that partially fills the gap but doesn't close it completely.
Formation:
Bullish gap up, bearish candle partially filling gap
Market Psychology:
Temporary pullback in strong uptrend
Trading Strategy:
Gap remains unfilled, uptrend likely to continue
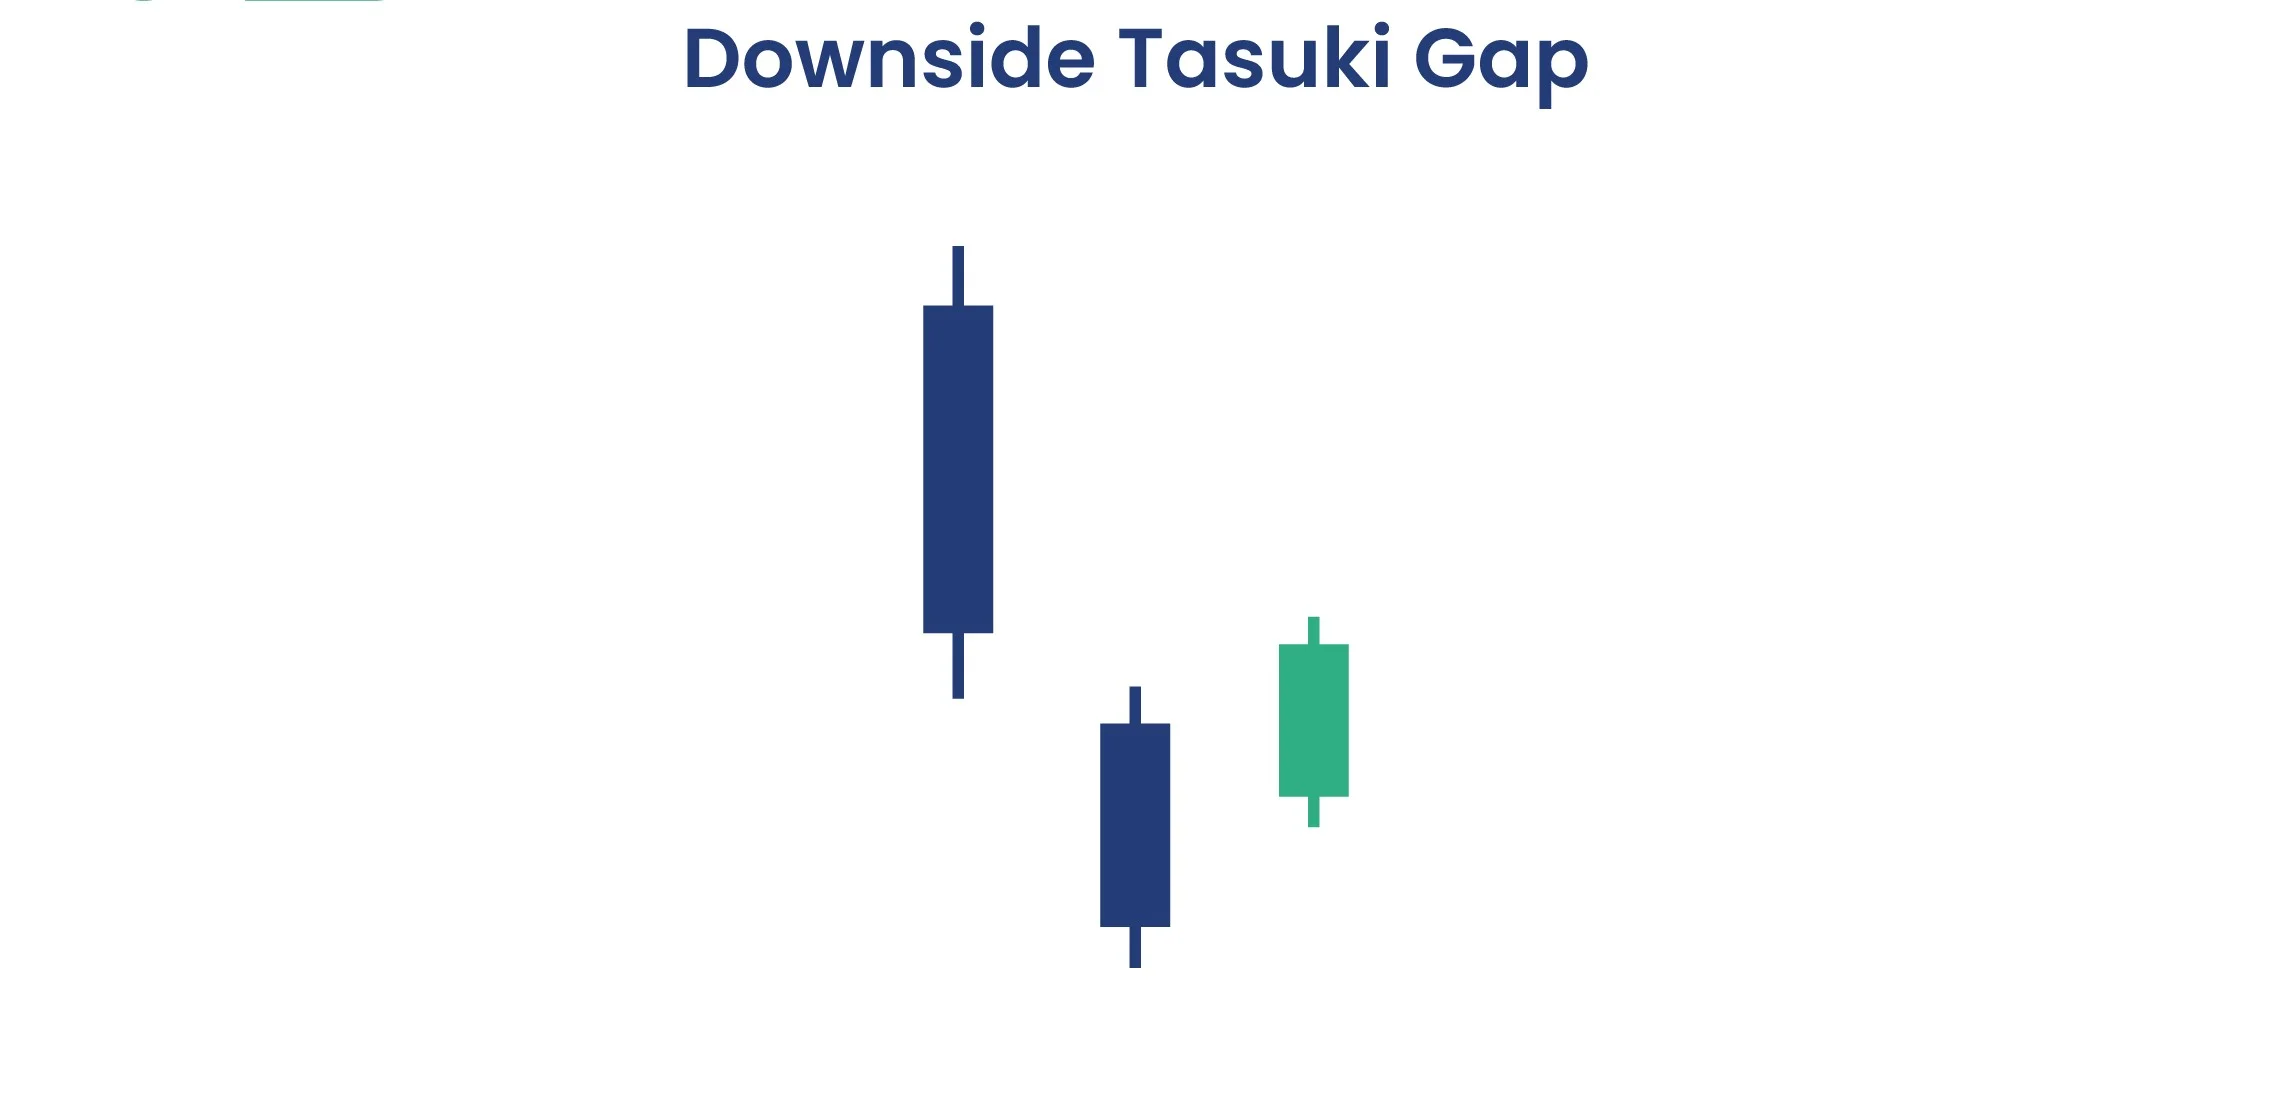
42Downside Tasuki Gap Pattern
A bearish candle gaps down, followed by a bullish candle that partially fills the gap but doesn't close it completely.
Formation:
Bearish gap down, bullish candle partially filling gap
Market Psychology:
Brief relief rally in strong downtrend
Trading Strategy:
Gap remains open, downtrend likely to continue
43Rising Window Pattern
A gap between two bullish candles indicating strong buying pressure and continuation of the uptrend.
Formation:
Gap up between two bullish candles
Market Psychology:
Strong bullish sentiment with buying urgency
Trading Strategy:
Gap acts as support, continuation signal
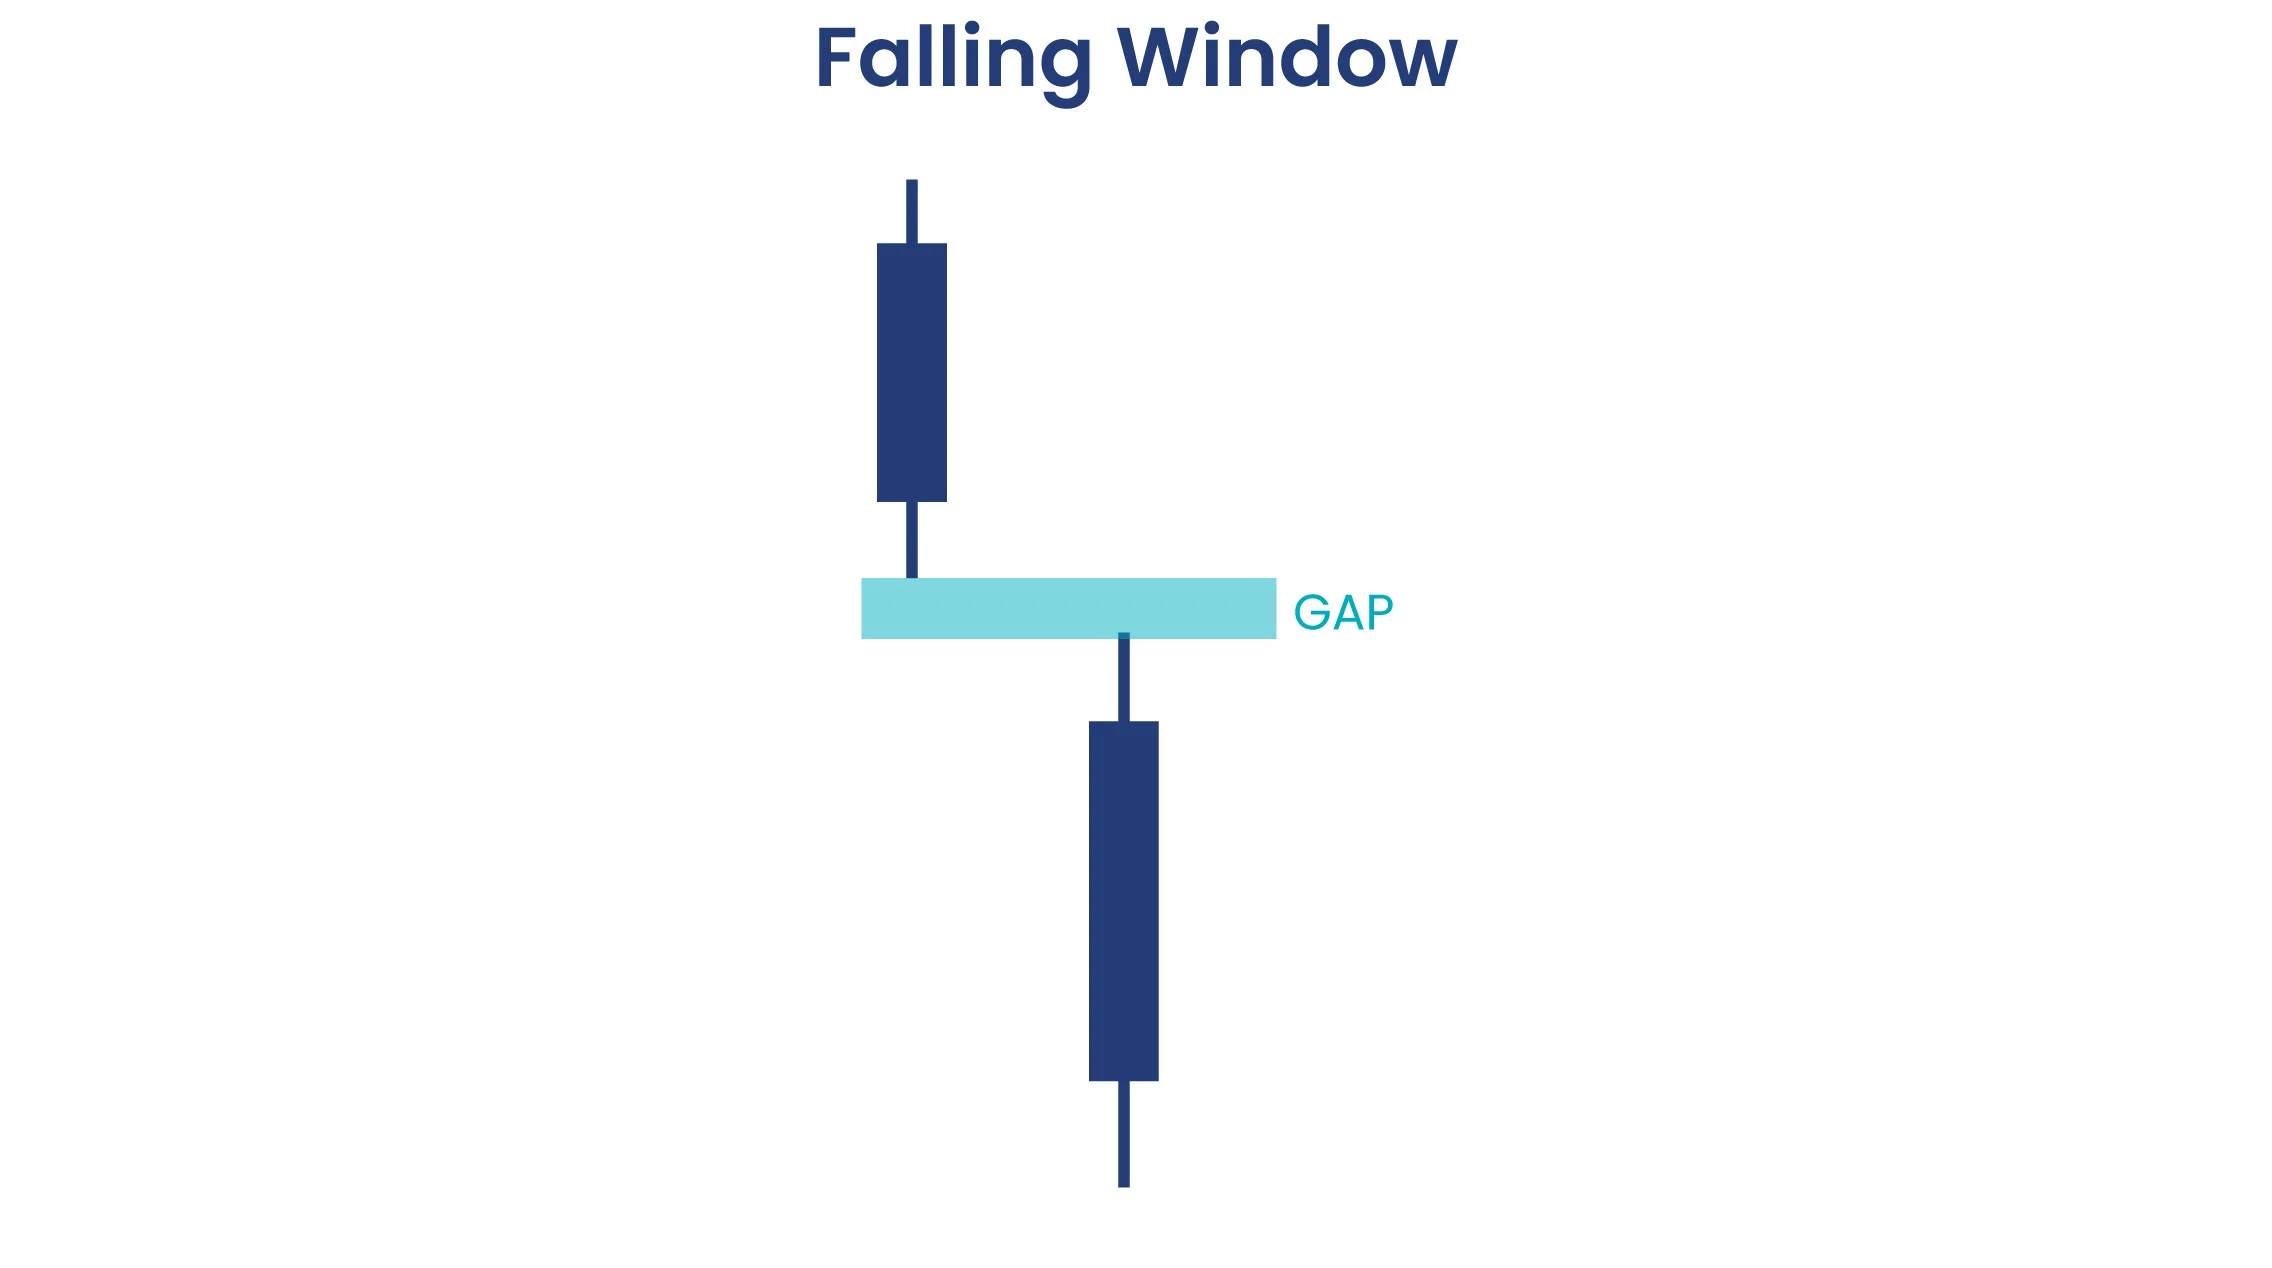
44Falling Window Pattern
A gap between two bearish candles indicating strong selling pressure and continuation of the downtrend.
Formation:
Gap down between two bearish candles
Market Psychology:
Strong bearish sentiment with selling urgency
Trading Strategy:
Gap acts as resistance, continuation signal
45Three Outside Up Pattern
A bearish candle followed by a larger bullish candle that engulfs it, and another bullish candle closing higher.
Formation:
Bearish candle, bullish engulfing, bullish confirmation
Market Psychology:
Bears overwhelmed by strong bullish momentum
Trading Strategy:
Strong bullish reversal/continuation signal
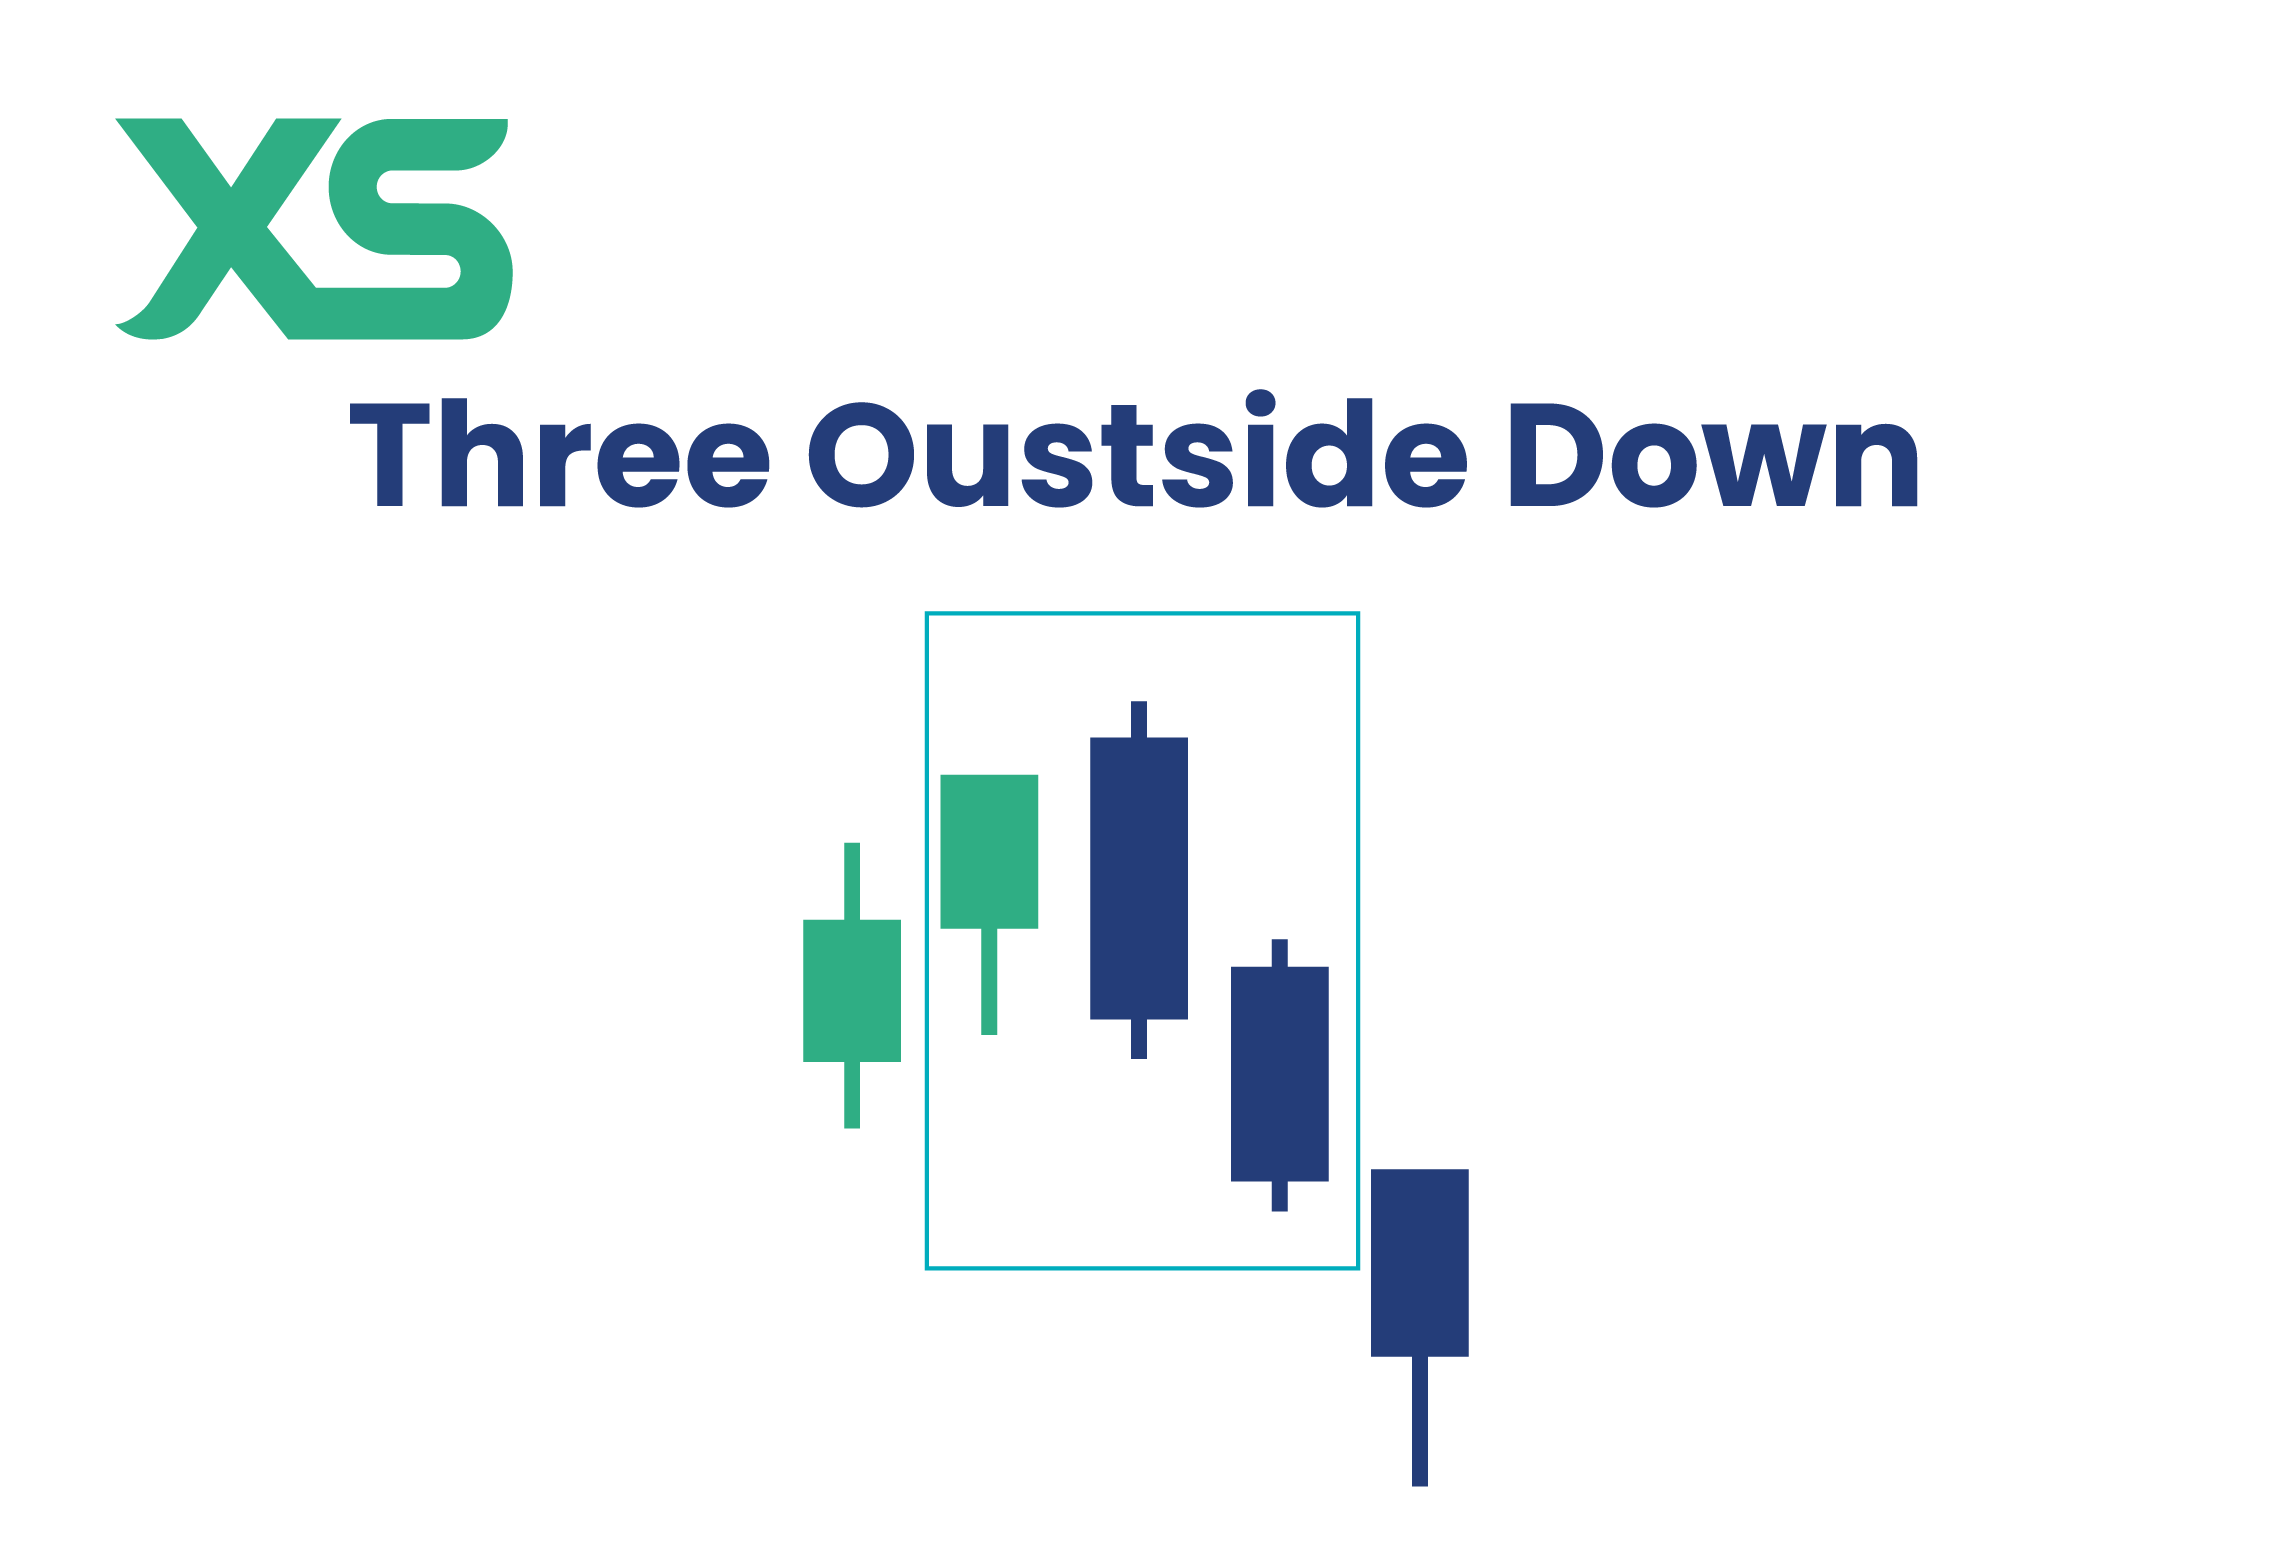
46Three Outside Down Pattern
A bullish candle followed by a larger bearish candle that engulfs it, and another bearish candle closing lower.
Formation:
Bullish candle, bearish engulfing, bearish confirmation
Market Psychology:
Bulls overwhelmed by strong bearish momentum
Trading Strategy:
Strong bearish reversal/continuation signal
47White Marubozu Pattern
A bullish candle with no wicks, opening at its low and closing at its high, indicating extremely strong buying pressure.
Formation:
Long bullish body with no upper or lower wicks
Market Psychology:
Overwhelming bullish control throughout the session
Trading Strategy:
Strong momentum signal, expect continuation
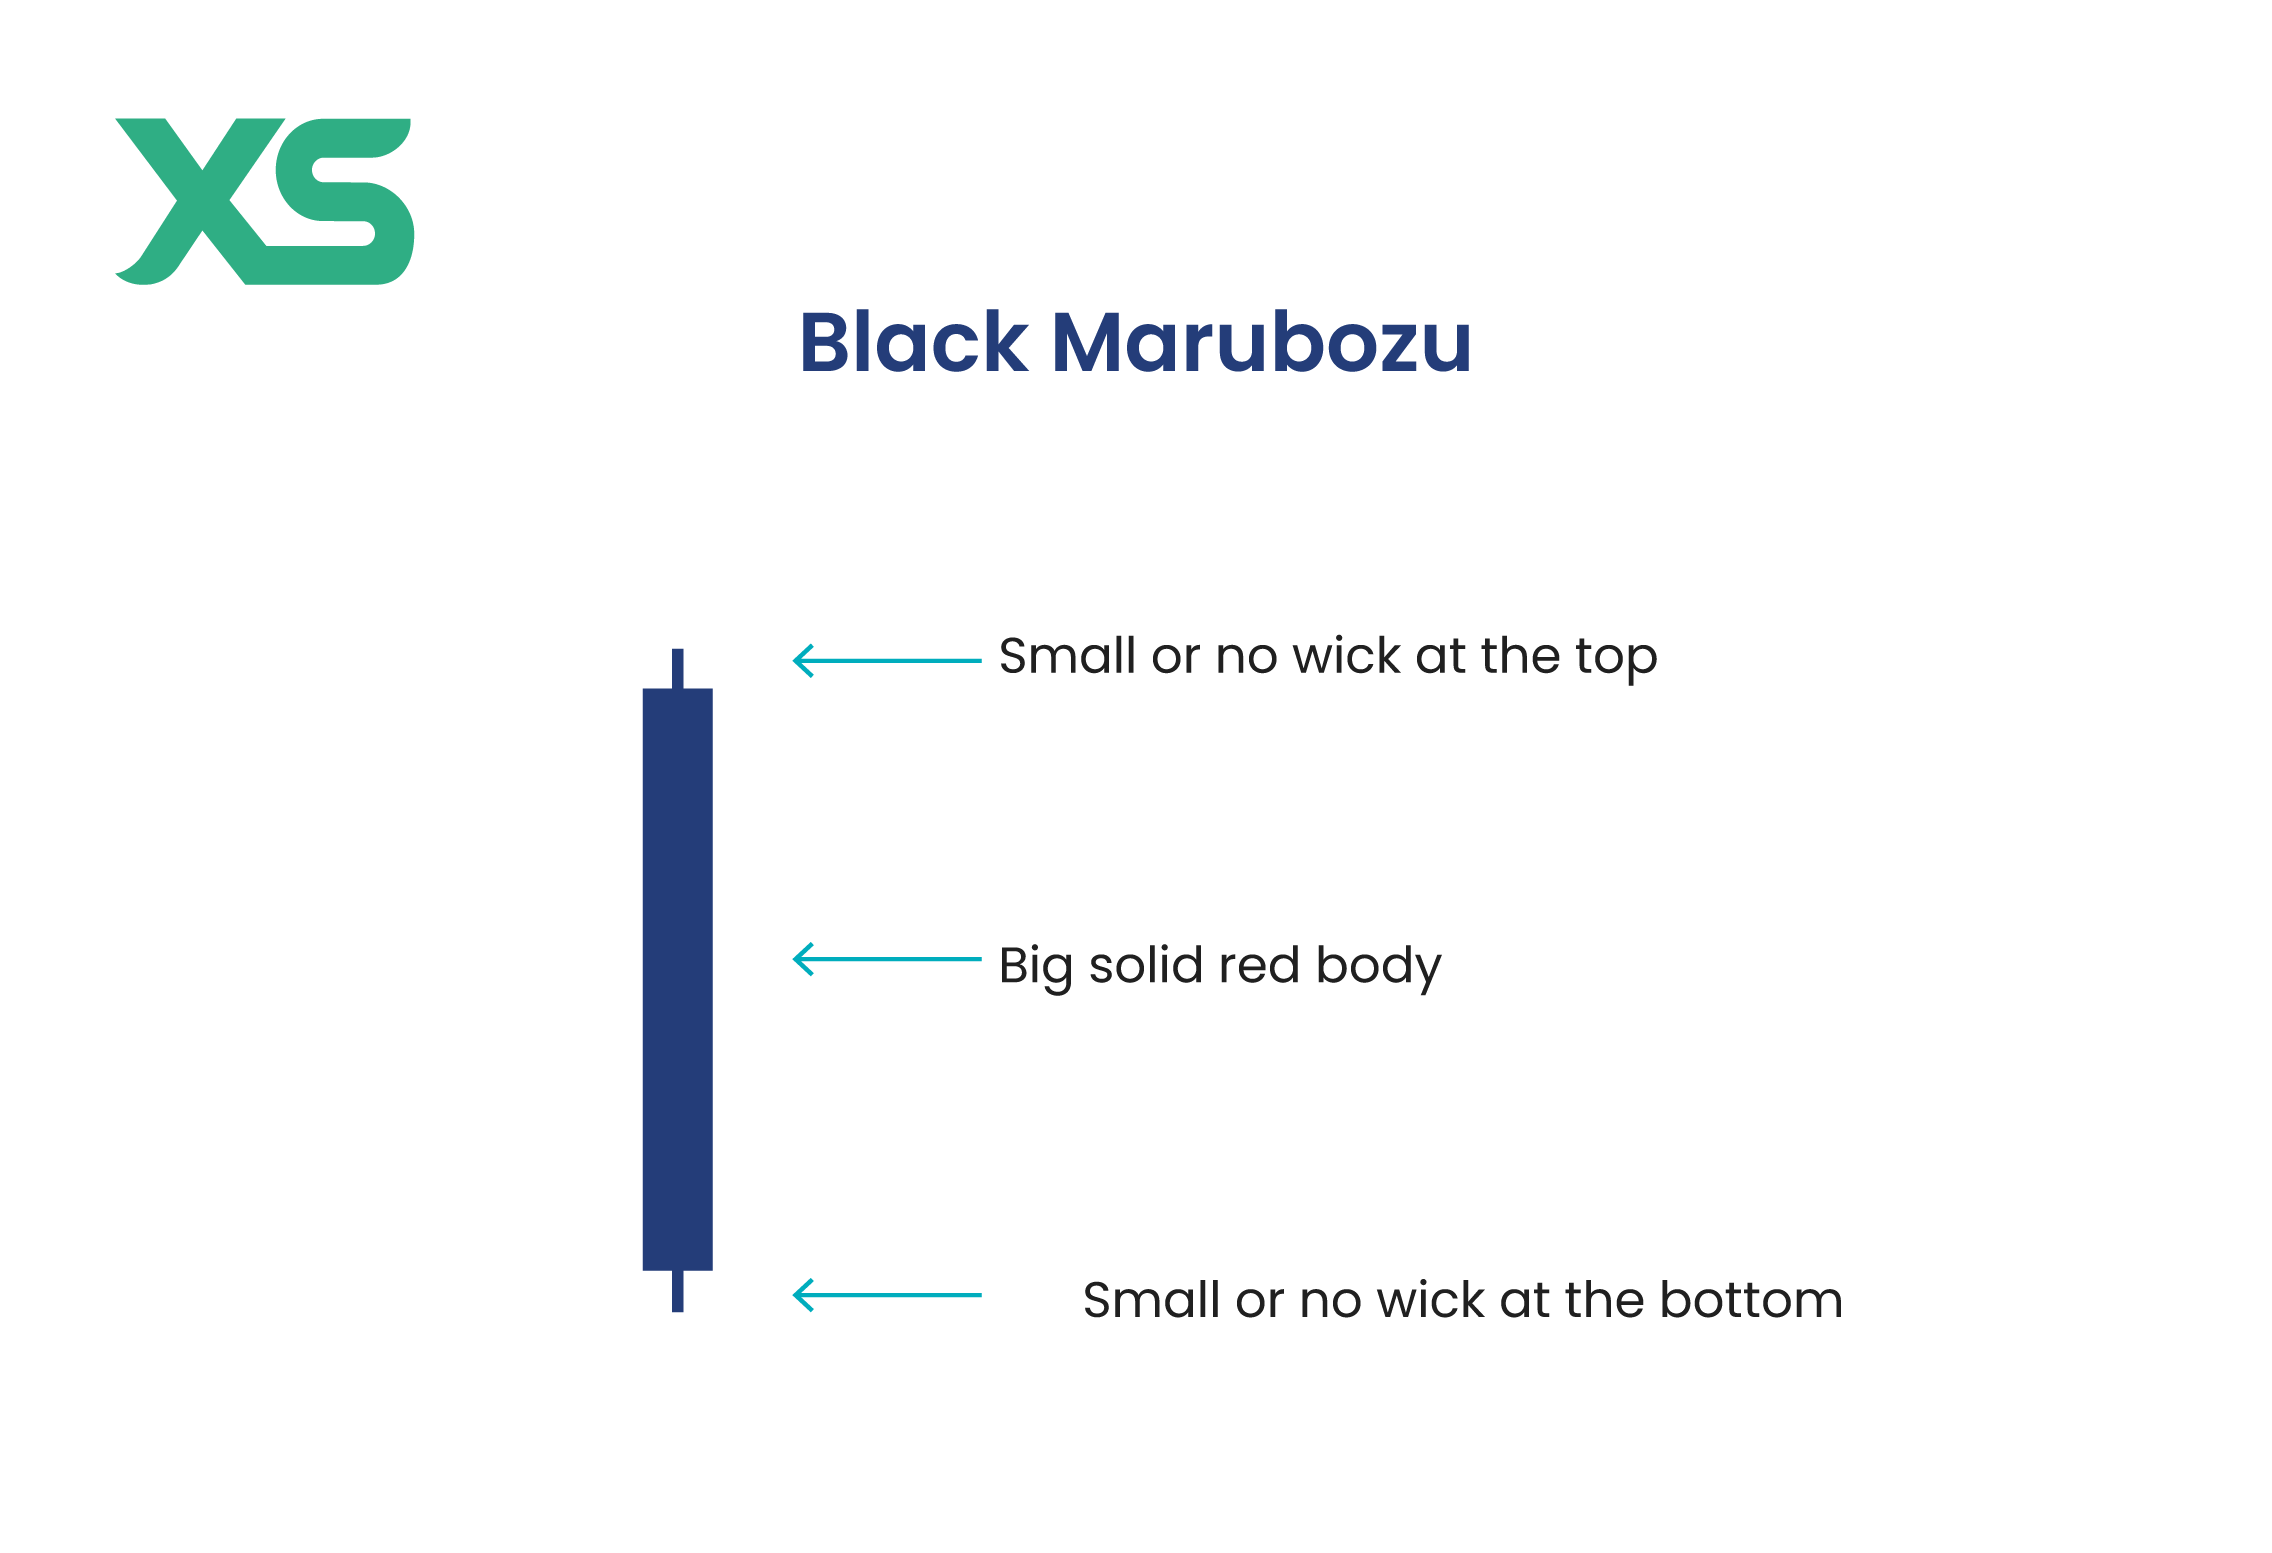
48Black Marubozu Pattern
A bearish candle with no wicks, opening at its high and closing at its low, indicating extremely strong selling pressure.
Formation:
Long bearish body with no upper or lower wicks
Market Psychology:
Overwhelming bearish control throughout the session
Trading Strategy:
Strong momentum signal, expect continuation
49On-Neck Pattern
A bearish candle followed by a smaller bullish candle that closes near the low of the previous candle.
Formation:
Long bearish candle, small bullish closing at previous low
Market Psychology:
Weak bullish attempt fails to recover
Trading Strategy:
Bearish continuation, downtrend likely to resume
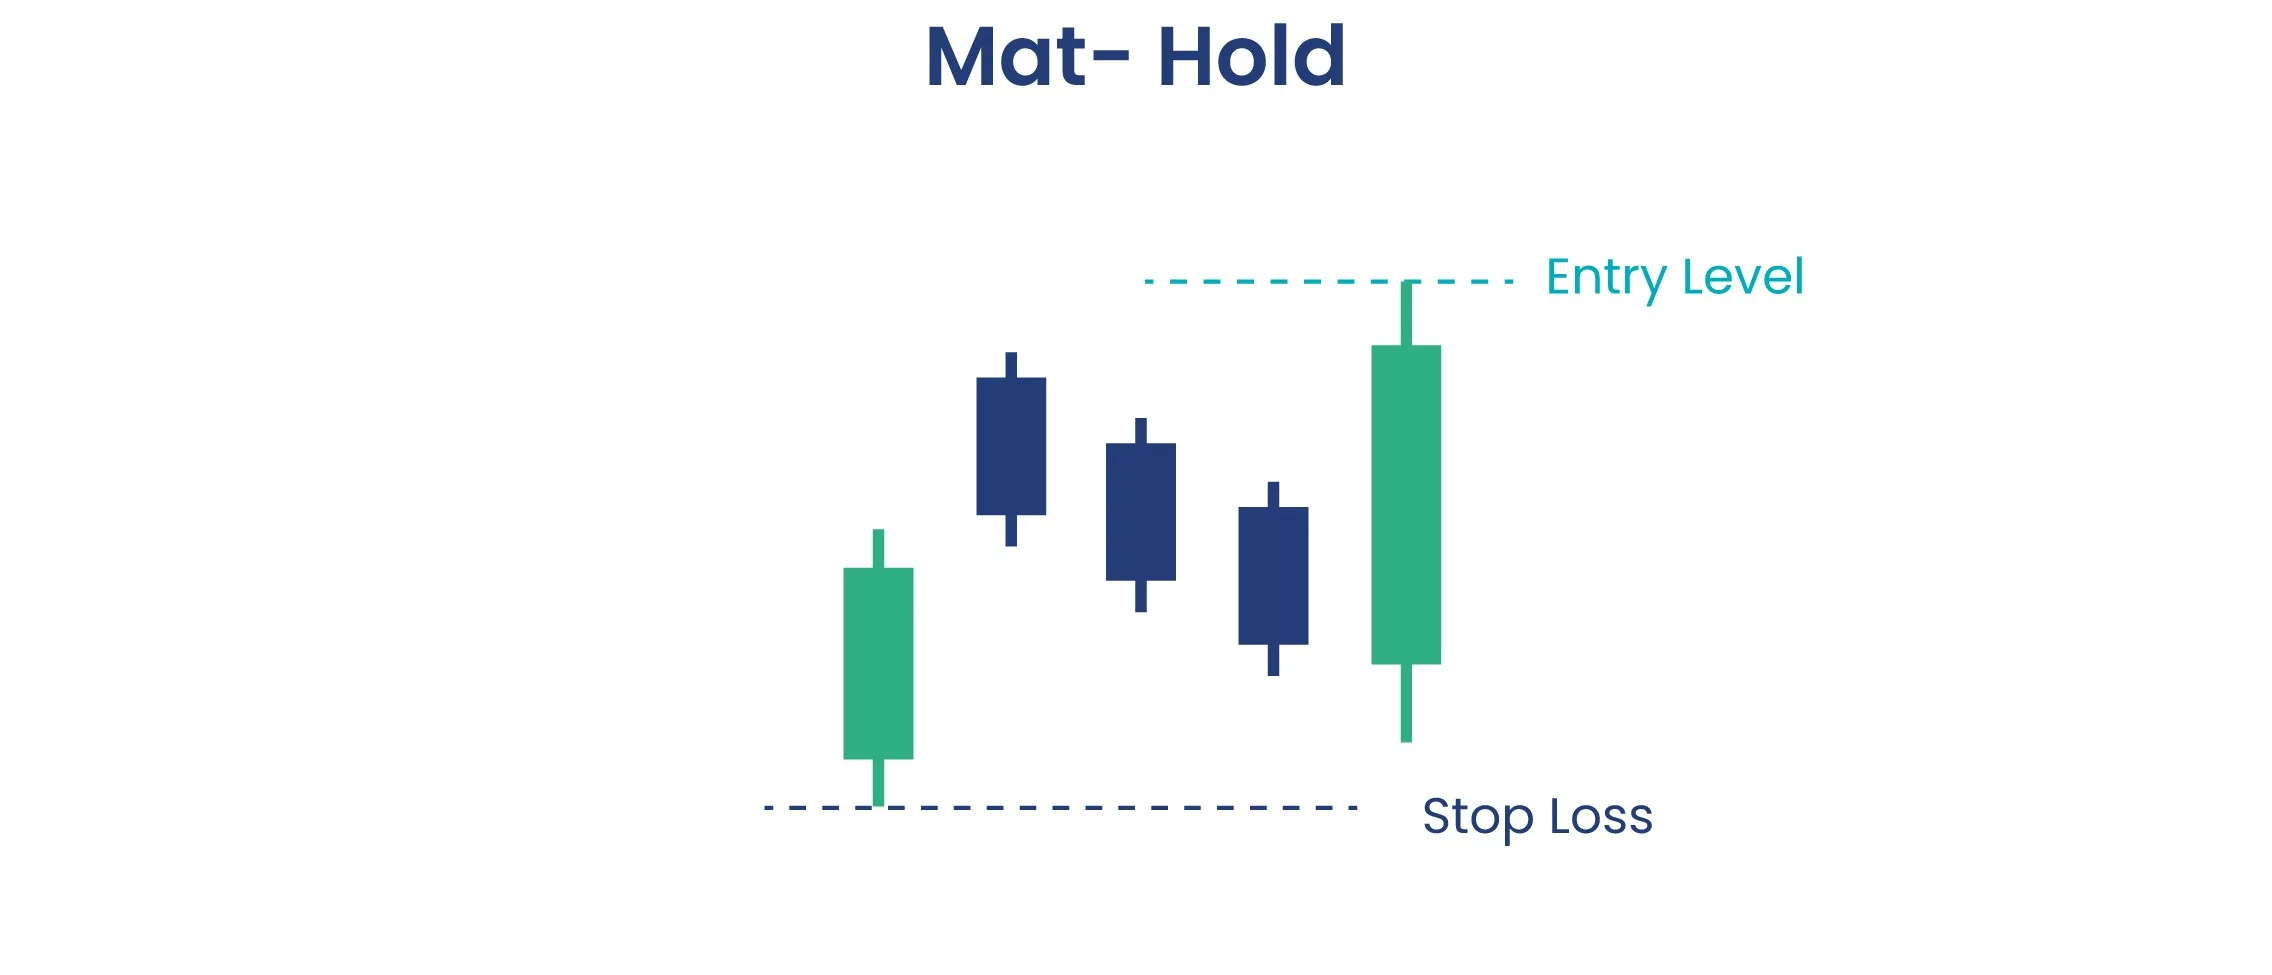
50Mat-Hold Pattern
A long bullish candle followed by three smaller bearish candles, then another strong bullish candle closing higher.
Formation:
Long bullish, three small bearish, strong bullish
Market Psychology:
Brief consolidation before bullish continuation
Trading Strategy:
Strong bullish pattern, expect upward breakout
51Long Legged Doji Pattern
A doji with very long upper and lower wicks, indicating extreme volatility and market indecision.
Formation:
Small body with very long wicks on both sides
Market Psychology:
Extreme indecision with high volatility
Trading Strategy:
Wait for direction confirmation before trading
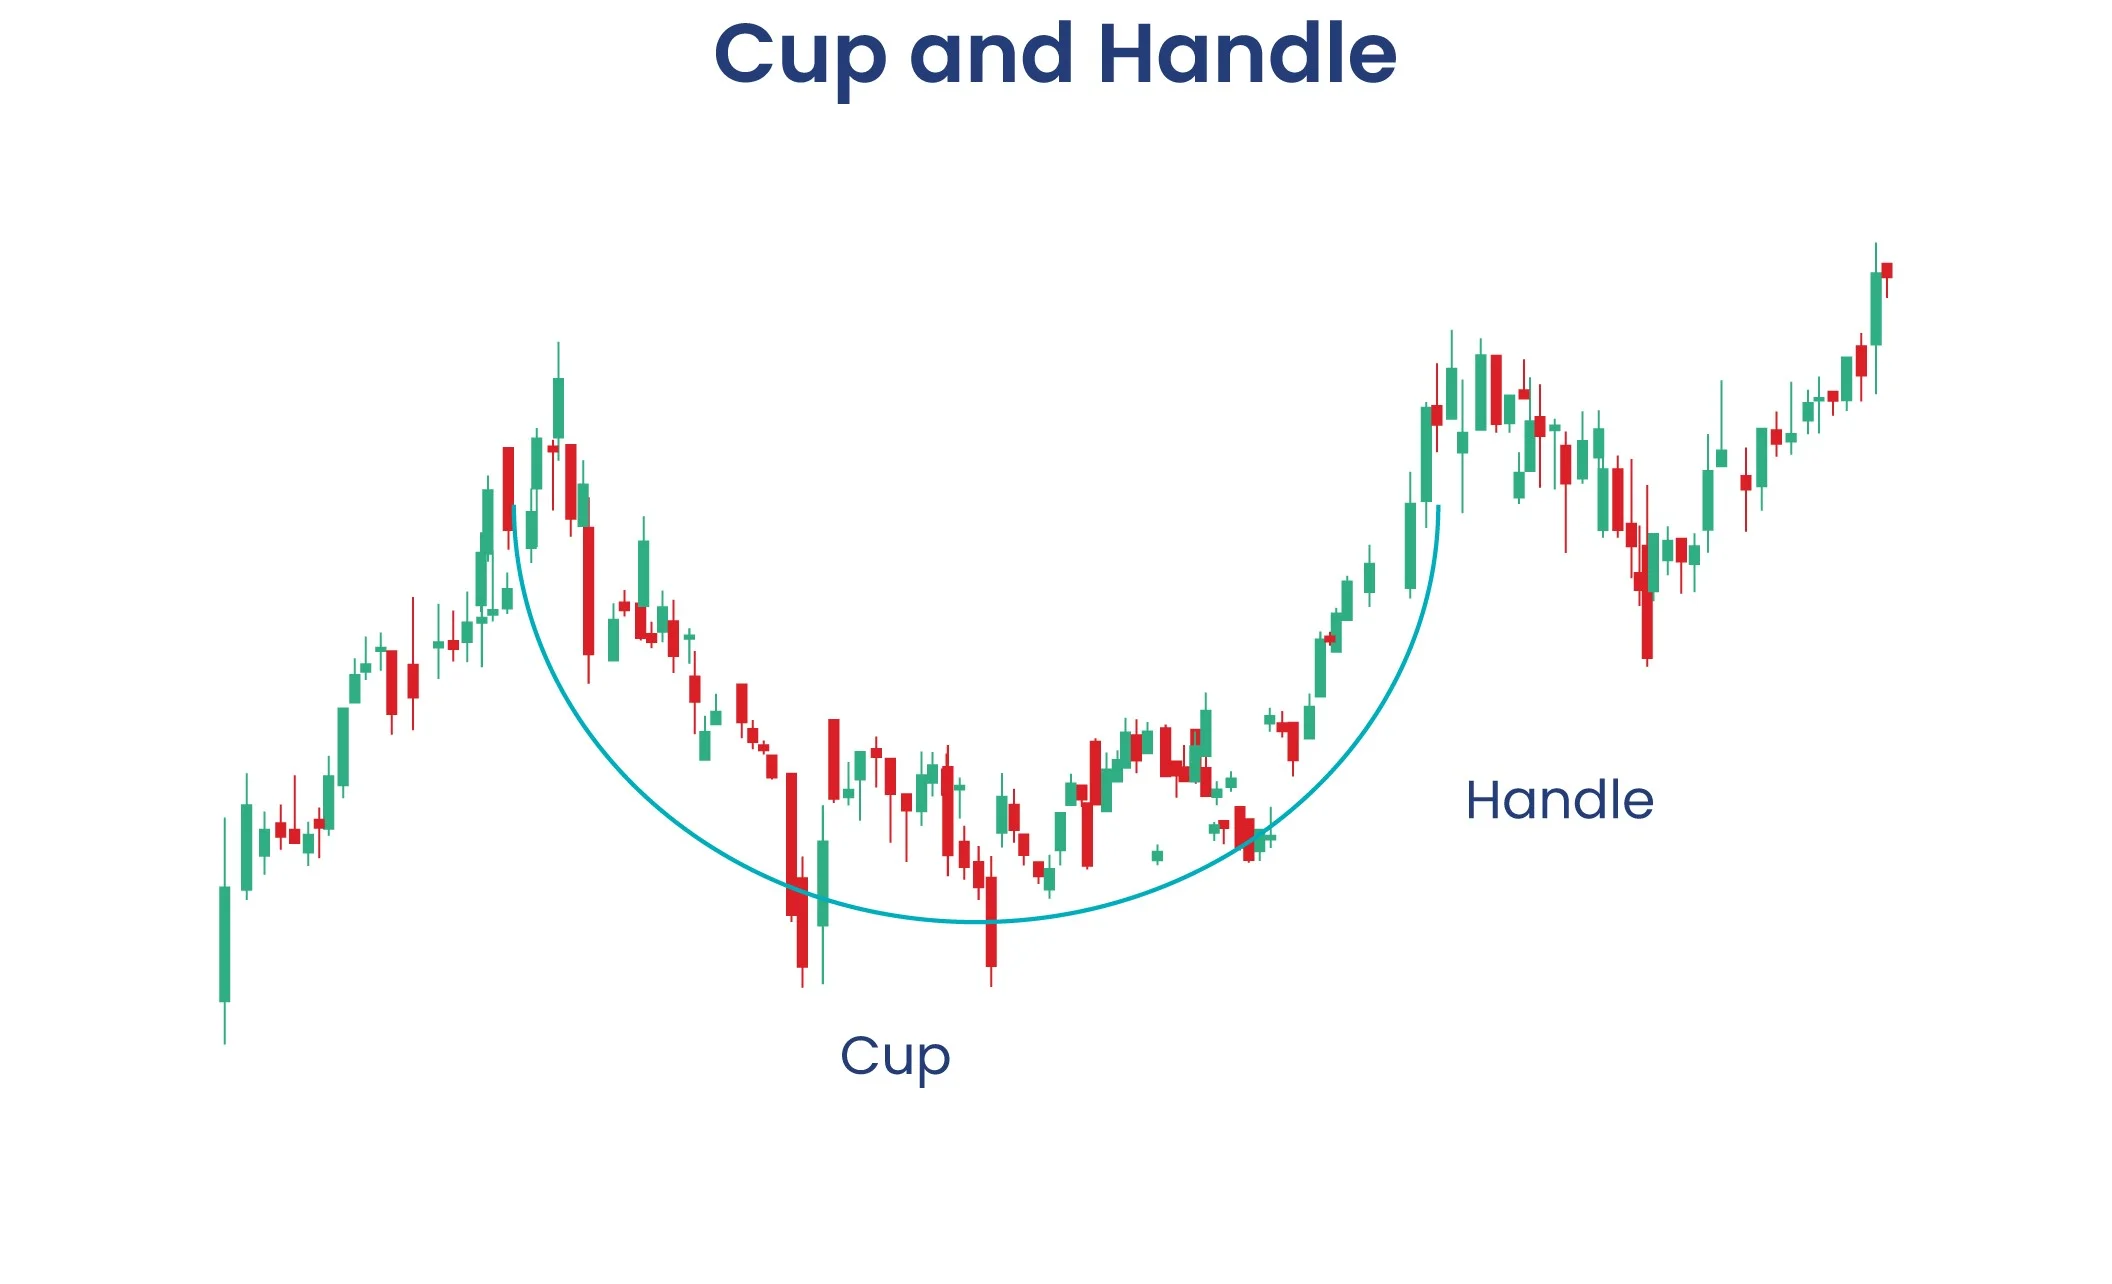
52Cup and Handle Pattern
A U-shaped consolidation followed by a smaller downward drift, resembling a teacup with a handle.
Formation:
U-shaped cup followed by small handle formation
Market Psychology:
Gradual accumulation before breakout
Trading Strategy:
Enter on handle breakout with strong volume
53Rounding Bottom Pattern
A gradual reversal pattern forming a U-shape, indicating a slow transition from downtrend to uptrend.
Formation:
Extended U-shaped bottom formation
Market Psychology:
Gradual shift from selling to buying sentiment
Trading Strategy:
Long-term bullish signal, patience required
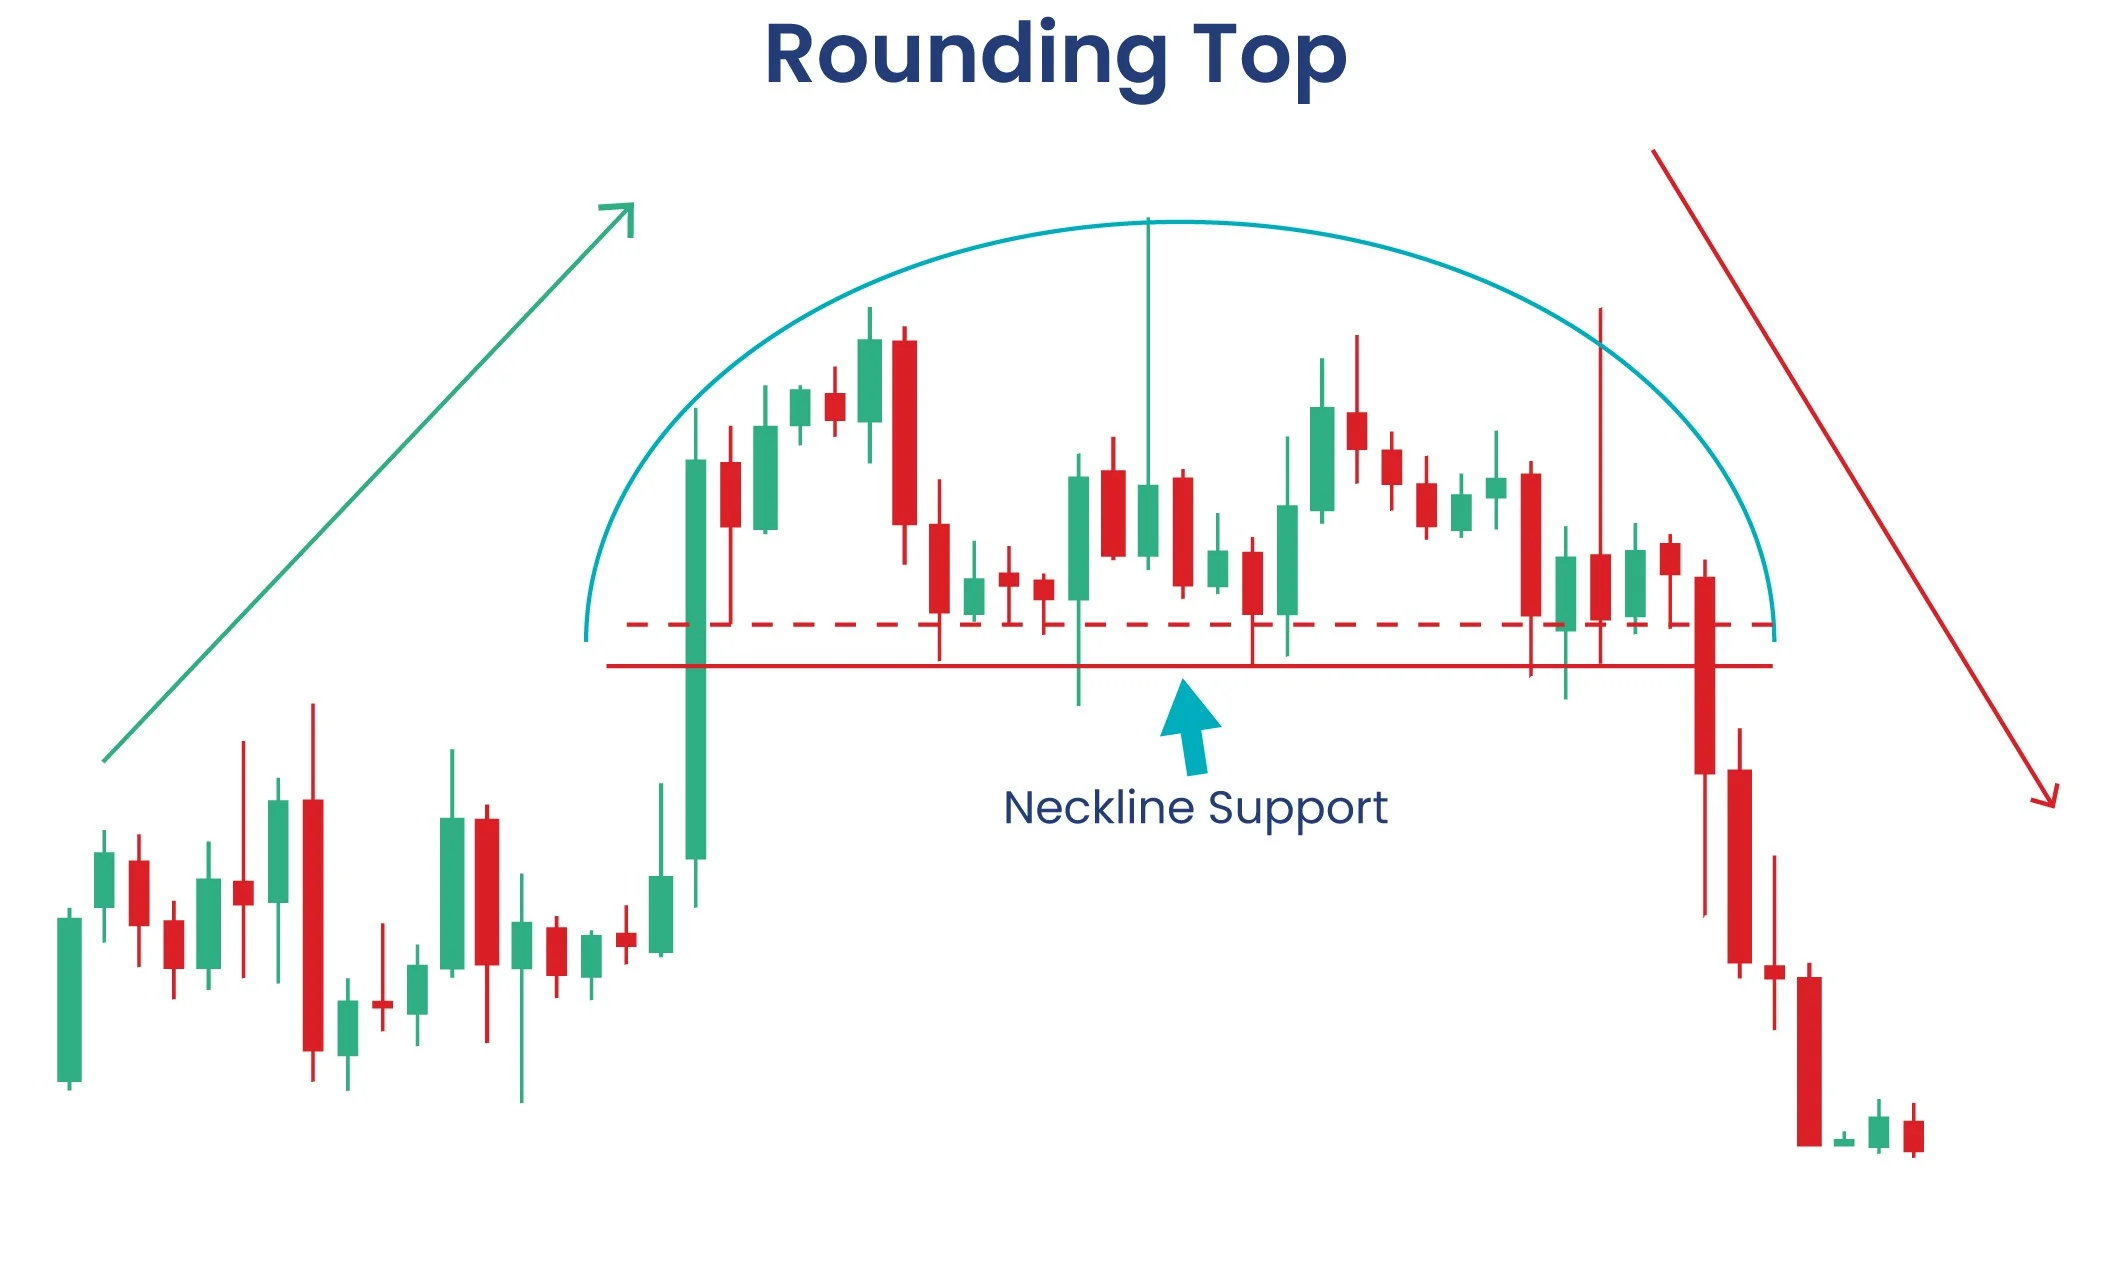
54Rounding Top Pattern
A gradual reversal pattern forming an inverted U-shape, indicating a slow transition from uptrend to downtrend.
Formation:
Extended inverted U-shaped top formation
Market Psychology:
Gradual shift from buying to selling sentiment
Trading Strategy:
Long-term bearish signal, patience required
55Triple Top Pattern
Three peaks at approximately the same level, indicating strong resistance and potential bearish reversal.
Formation:
Three roughly equal peaks with valleys between
Market Psychology:
Repeated failure to break resistance
Trading Strategy:
Enter short on breakdown of support line
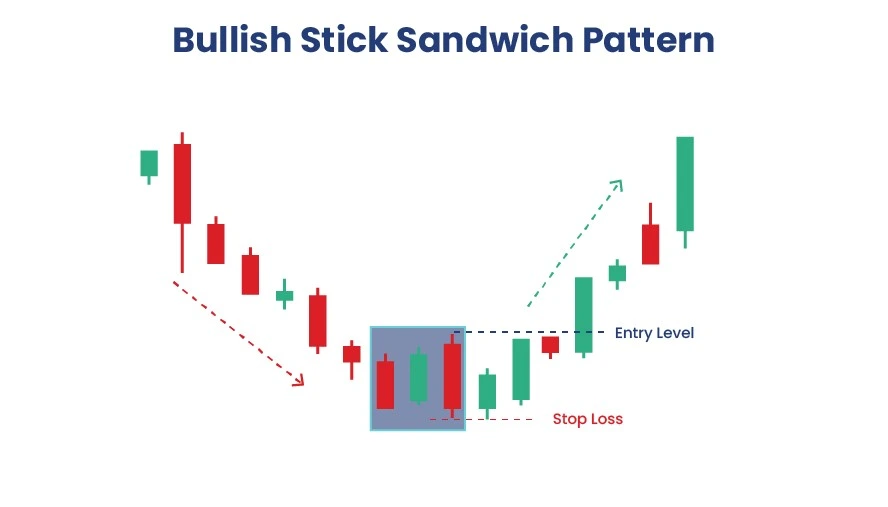
56Bullish Stick Sandwich Pattern
Two bearish candles with identical closes sandwiching a bullish candle, indicating potential bullish reversal.
Formation:
Bearish candle, bullish candle, bearish candle with same close
Market Psychology:
Support level tested and held
Trading Strategy:
Bullish reversal signal at support levels
57Bearish Stick Sandwich Pattern
Two bullish candles with identical closes sandwiching a bearish candle, indicating potential bearish reversal.
Formation:
Bullish candle, bearish candle, bullish candle with same close
Market Psychology:
Resistance level tested and held
Trading Strategy:
Bearish reversal signal at resistance levels
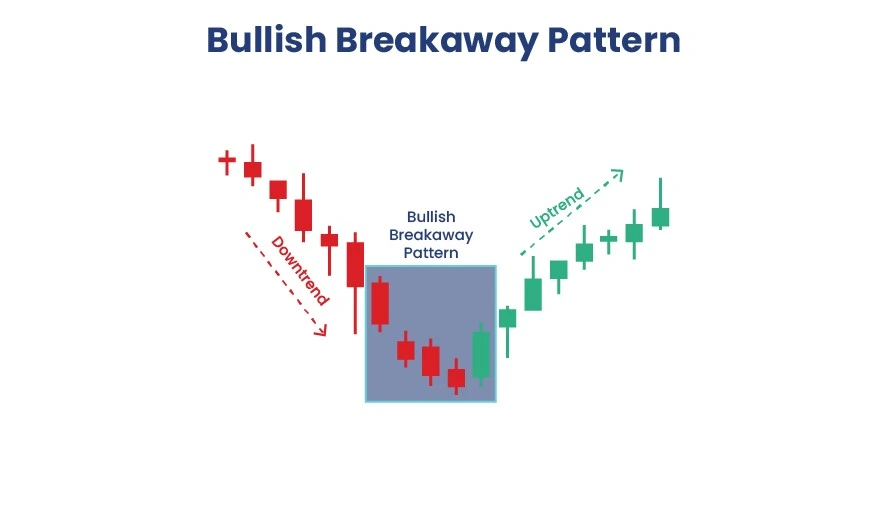
58Bullish Breakaway Pattern
Five-candle pattern starting with a bearish candle, three smaller candles, and ending with a strong bullish candle.
Formation:
Long bearish, three small candles, strong bullish breakout
Market Psychology:
Consolidation followed by strong bullish momentum
Trading Strategy:
Enter long on final bullish candle close
59Bearish Breakaway Pattern
Five-candle pattern starting with a bullish candle, three smaller candles, and ending with a strong bearish candle.
Formation:
Long bullish, three small candles, strong bearish breakout
Market Psychology:
Consolidation followed by strong bearish momentum
Trading Strategy:
Enter short on final bearish candle close
Professional Trading Strategies
Entry and Exit Rules
Entry Strategies
- ✅ Wait for complete pattern formation
- ✅ Confirm with volume analysis
- ✅ Check multiple timeframe alignment
- ✅ Enter on confirmation candle close
- ✅ Use limit orders at key levels
Risk Management
- 🛡️ Stop losses beyond pattern extremes
- 🛡️ Risk maximum 1-2% per trade
- 🛡️ Target minimum 2:1 risk-reward
- 🛡️ Scale out at resistance/support
- 🛡️ Trail stops with trend momentum
Advanced Pattern Combination Strategies
Multi-Pattern Confluence
The most successful traders combine multiple candlestick patterns with other technical analysis tools:
- Pattern + Support/Resistance: 75-85% success rate when patterns form at key levels
- Pattern + Volume: Volume confirmation increases success by 15-20%
- Pattern + Momentum: RSI/MACD divergence adds 10-15% reliability
- Pattern + Market Structure: Confluence with SMC concepts boosts accuracy
Trading Different Market Sessions
| Market Session | Best Pattern Types | Key Characteristics | Trading Tips |
|---|---|---|---|
| London Session | Reversal Patterns | High volatility, strong trends | Focus on major pairs, watch for breakouts |
| New York Session | Continuation Patterns | Trend continuation, news impact | Trade with trend, manage news events |
| Asian Session | Range Patterns | Lower volatility, consolidation | Trade range-bound patterns, smaller positions |
| Session Overlaps | Strong Reversal Signals | Increased volume and volatility | Best opportunities for major moves |
Key Takeaways for Trading Success
- Pattern Context Matters: Success rates increase dramatically when patterns appear at key support/resistance levels
- Volume Confirmation: Always check volume - higher volume on pattern completion increases reliability by 15-20%
- Multiple Timeframe Analysis: Confirm patterns on higher timeframes before entering trades
- Risk Management is Crucial: Never risk more than 1-2% per trade, regardless of pattern strength
- Practice Makes Perfect: Use demo accounts to practice pattern recognition before risking real capital
- Combine with Other Tools: Integrate candlestick patterns with momentum indicators, market structure, and sentiment analysis
Related Learning Resources
Master All 59 Candlestick Patterns with Our Indicators
Our Smart Money Concepts indicator automatically identifies and alerts you to all major candlestick patterns, Fair Value Gaps, and institutional trading signals for maximum trading efficiency.
Explore Our Trading Indicators