Price Action Trading
Learn to trade using pure price movements without relying on complex indicators. Master the art of reading the market directly from the charts.
Candlestick Patterns
Master the art of reading candlestick patterns to identify high-probability trading opportunities, market reversals, and trend continuations across all financial markets.
Read article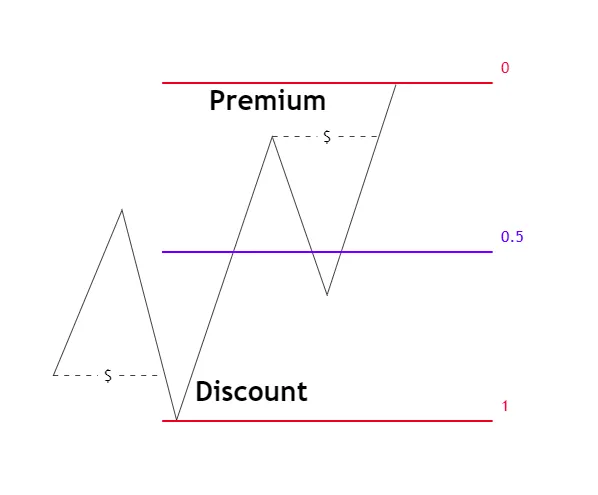
Premium Discount
Learn how to identify and trade Premium Discounts, powerful price action concepts from Smart Money trading that highlight institutional liquidity voids between weekly closes and opens.
Read article
New Week Opening Gap
Learn how to identify and trade New Week Opening Gaps (NWOG), powerful intraday price action concepts from Smart Money trading that highlight institutional liquidity voids between weekly closes and opens.
Read article
New Day Opening Gap
Learn how to identify and trade New Day Opening Gaps (NDOG), powerful intraday price action concepts from Smart Money trading that highlight institutional liquidity voids between daily closes and opens.
Read article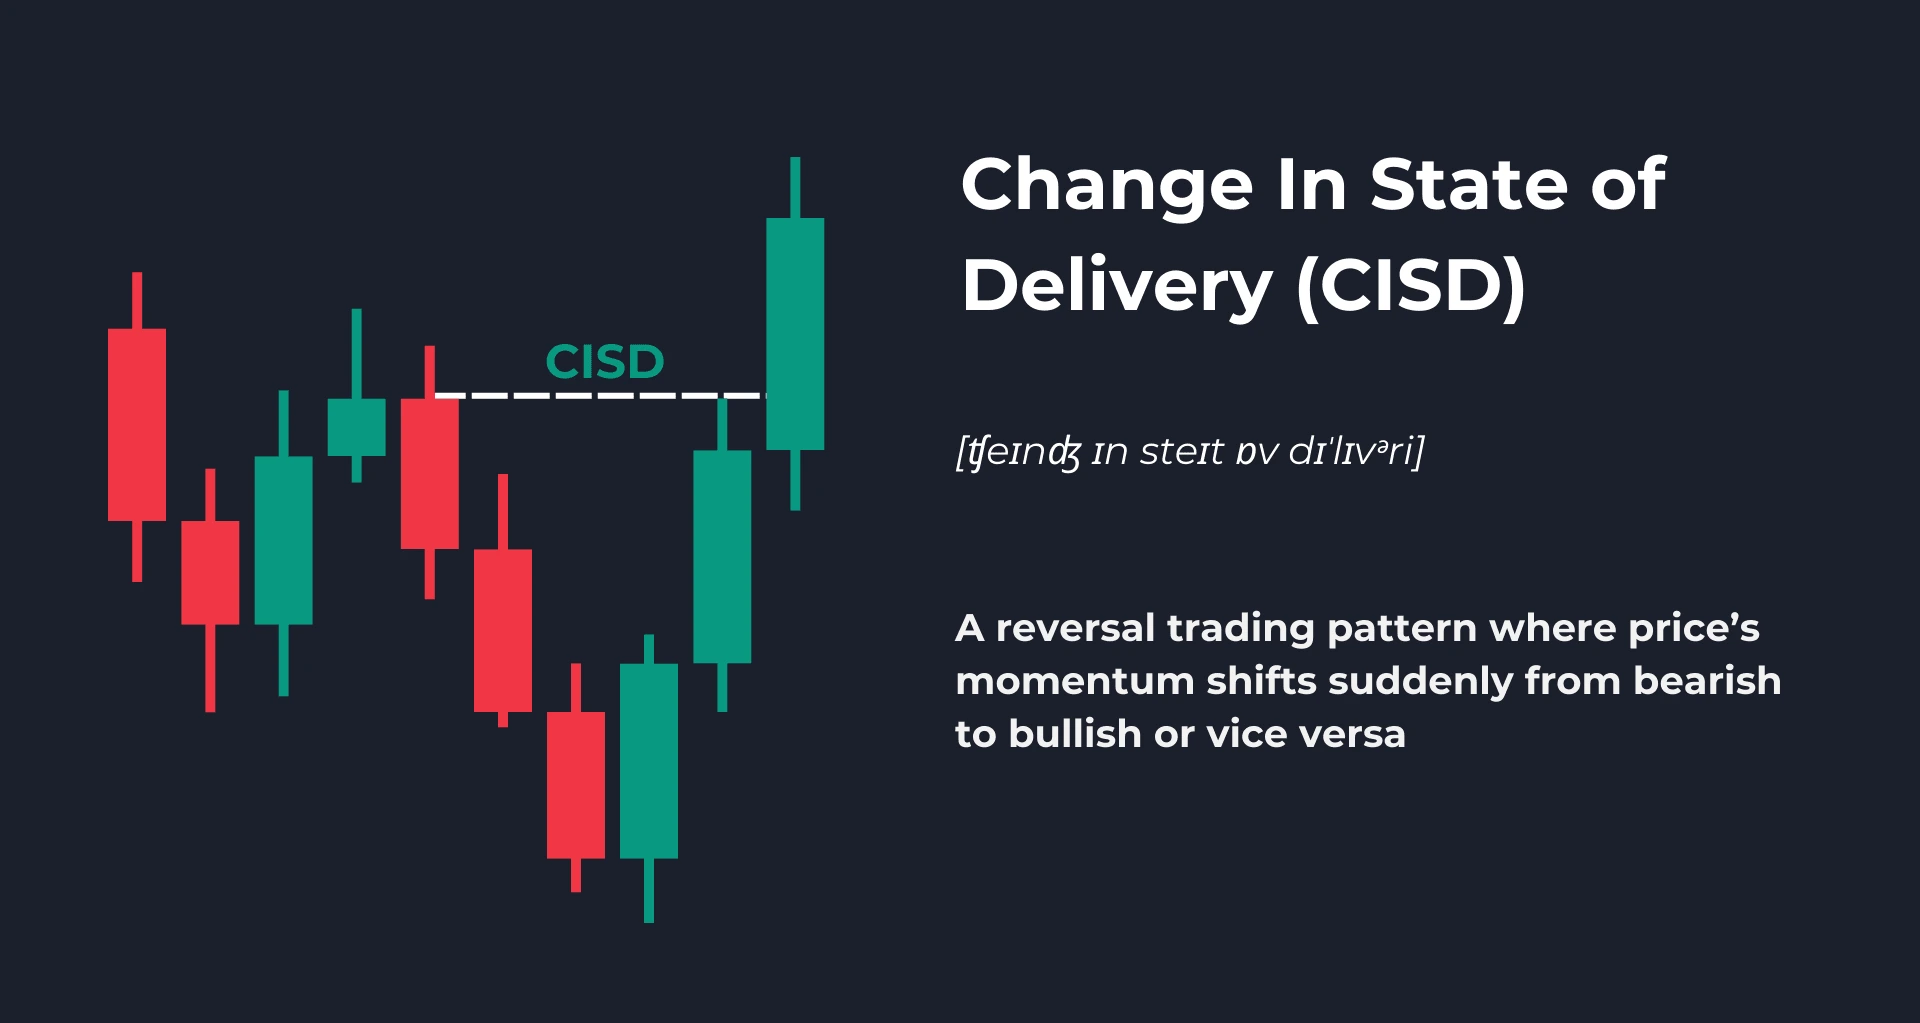
Change in State Delivery
Master the Change in State Delivery strategy - learn how to identify and trade changes in market state to create high-probability trading opportunities.
Read article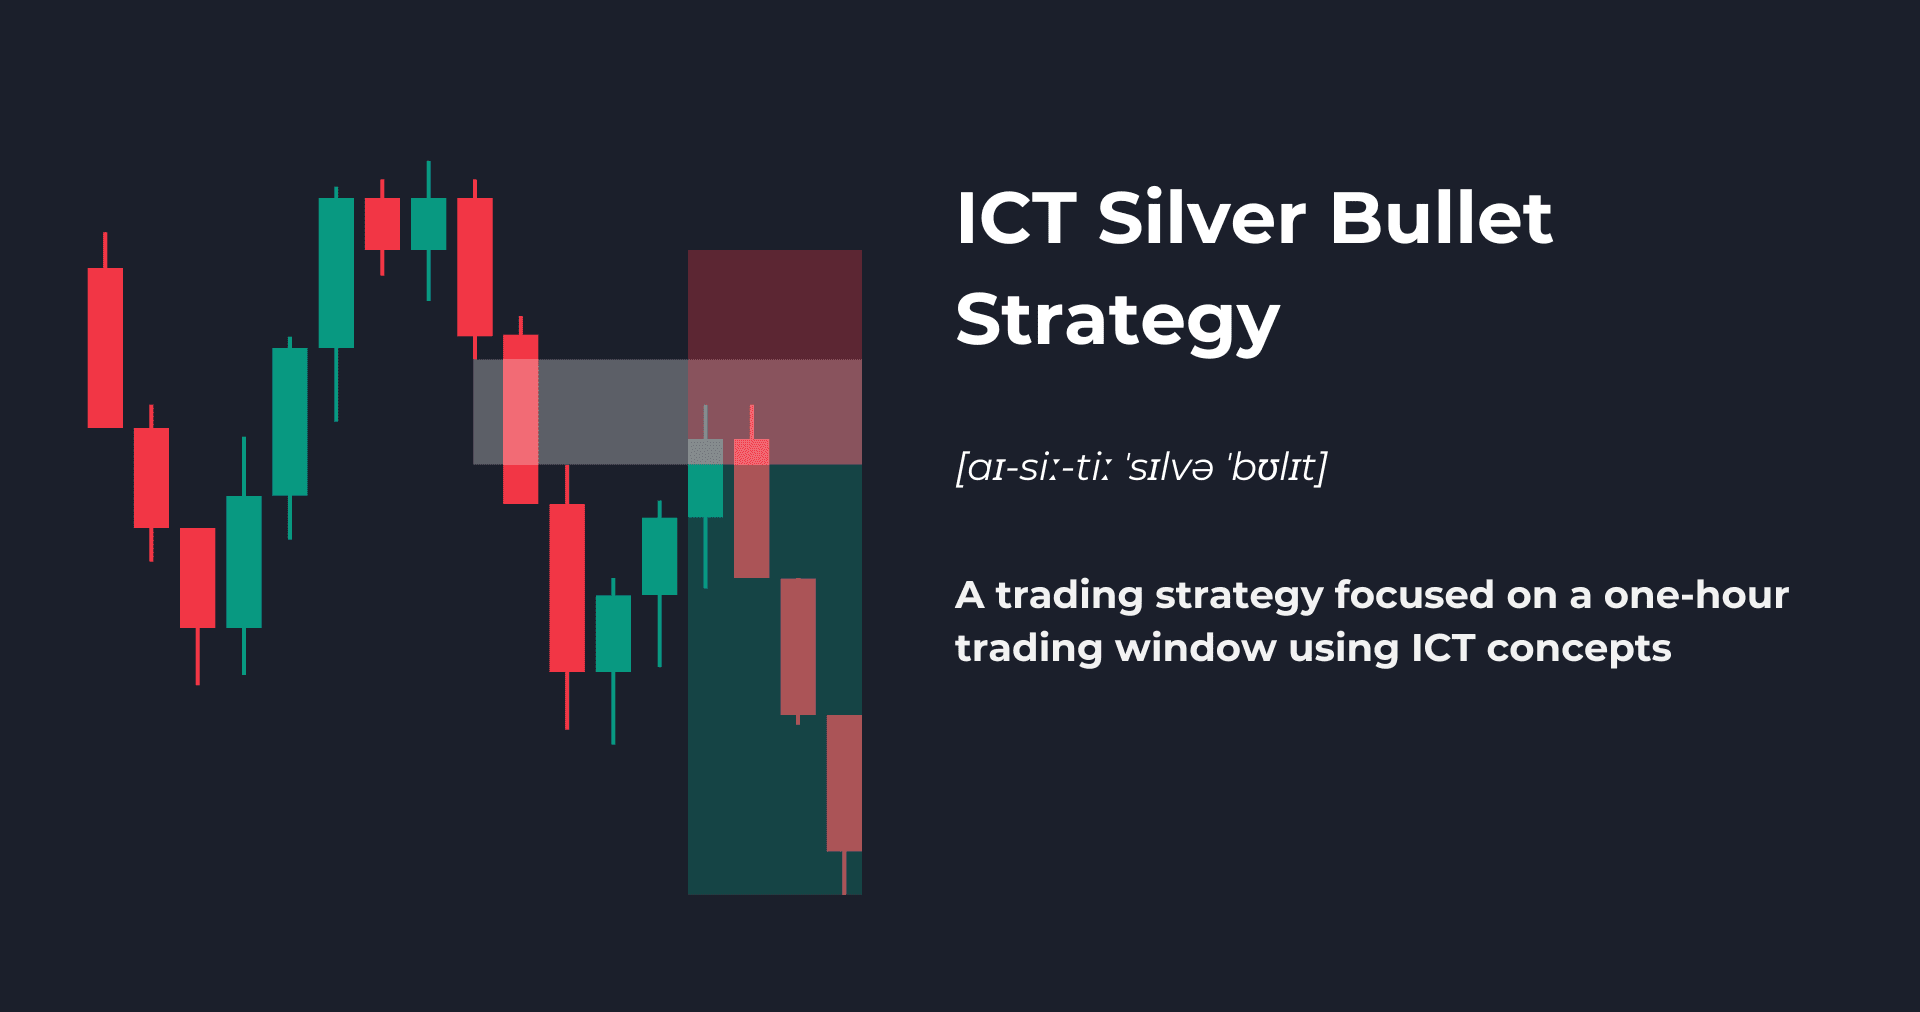
ICT Silver Bullet
Master the ICT Silver Bullet strategy - learn how to combine Fair Value Gaps and Liquidity Sweeps to identify high-probability trading opportunities across all markets.
Read articleDecoding the Language of the Market: A Complete Guide to Price Action Trading
Price Action Trading represents the purest form of market analysis, focusing exclusively on the movement of price to make trading decisions. This methodology strips away the complexity of multiple indicators, economic theories, and fundamental analysis to focus on what matters most: how price moves and what it reveals about market sentiment. Whether you're analyzing traditional chart patterns, modern Smart Money Concepts (SMC), or ICT (Inner Circle Trader) methodologies, price action forms the foundation of successful trading across all markets and timeframes.
What is Price Action Trading?
Price action trading is a methodology that involves analyzing historical and current price movements to predict future price direction. At its core, it operates on the principle that price discounts everything - a fundamental tenet borrowed from Dow Theory. This means that all available information, whether fundamental, technical, or sentiment-based, is already reflected in the current price.
This approach has evolved significantly from its origins in 18th-century Japanese rice trading, where Munehisa Homma developed candlestick charting techniques. Today, price action encompasses traditional Western chart patterns, Japanese candlestick analysis, and modern institutional trading concepts like Smart Money theory and ICT methodology.
The Evolution of Price Action: From Traditional to Modern Concepts
Modern price action trading has expanded beyond classical chart patterns to include sophisticated concepts that reflect how institutional traders operate:
- Traditional Price Action: Support/resistance, trendlines, chart patterns, and candlestick formations
- Smart Money Concepts (SMC): Order blocks, fair value gaps, liquidity sweeps, and market structure analysis
- ICT Methodology: Power of Three model, silver bullet strategy, optimal trade entry, and kill zones
- Modern Market Structure: Break of structure (BOS), change of character (CHOCH), and institutional order flow
Core Principles of Price Action Analysis
Successful price action trading is built on several fundamental principles that remain consistent across all methodologies:
1. Market Structure Analysis
Market structure forms the backbone of price action analysis. It involves understanding how price creates trends, ranges, and transitions between different market phases:
- Trending Markets: Series of higher highs and higher lows (uptrend) or lower highs and lower lows (downtrend)
- Range-bound Markets: Price oscillating between defined support and resistance levels
- Market Structure Breaks: When price decisively breaks previous swing points, indicating potential trend changes
- Change of Character (CHOCH): Early signs of trend weakness before a full reversal
2. Support and Resistance Dynamics
Support and resistance levels represent areas where buying and selling pressure converge, creating significant price reactions. Modern approaches include:
- Horizontal Levels: Previous swing highs and lows, psychological levels, and historical turning points
- Dynamic Levels: Moving averages, trendlines, and Fibonacci retracements
- Order Blocks: Areas where institutions have placed large orders, creating strong support or resistance zones
- Liquidity Zones: Areas where retail traders commonly place stop losses, targeted by smart money
3. Candlestick Pattern Recognition
Candlestick patterns provide insight into market psychology and potential future price movements:
- Reversal Patterns: Pin bars, engulfing candles, doji formations, and hammer patterns
- Continuation Patterns: Inside bars, flags, pennants, and consolidation formations
- Indecision Patterns: Doji, spinning tops, and overlapping price action
- Momentum Patterns: Marubozu, gap formations, and explosive breakout candles
Advanced Price Action Concepts
Smart Money Concepts (SMC)
Smart Money Concepts focus on understanding how institutional traders (banks, hedge funds, and large financial institutions) operate in the markets:
- Order Blocks: Price zones where institutions have executed large orders, often leading to strong reactions when price returns
- Fair Value Gaps (FVG): Price imbalances created by rapid market movements that often get filled later
- Liquidity Sweeps: Movements designed to trigger retail stop losses before reversing in the intended direction
- Inducement: False signals designed to lure retail traders into poor positions
- Market Structure Shifts: Changes in the underlying trend structure indicating institutional repositioning
ICT Methodology
The Inner Circle Trader (ICT) methodology provides a comprehensive framework for understanding institutional trading patterns:
- Power of Three (PO3): Accumulation, manipulation, and distribution phases of institutional trading
- Kill Zones: Specific time windows when institutions are most active (London, New York sessions)
- Silver Bullet Strategy: Precise timing model for high-probability entries during institutional trading hours
- Optimal Trade Entry (OTE): Fibonacci-based entry technique for trend continuation trades
- Breaker Blocks: Failed support/resistance levels that become powerful reversal zones
Price Action Trading Strategies Across Markets
Forex Markets
Currency markets are ideal for price action trading due to their high liquidity and clear institutional footprints. Key strategies include:
- Trading during major session overlaps for maximum volatility
- Focusing on major pairs (EUR/USD, GBP/USD, USD/JPY) for clearest price action
- Using session highs and lows as key reference points
- Applying ICT kill zones for optimal entry timing
Stock Markets
Equity markets provide excellent opportunities for price action analysis, particularly when combined with sector and market-wide analysis:
- Analyzing individual stock charts within broader market context
- Using earnings announcements and market events as catalysts
- Focusing on high-volume, liquid stocks for clearest signals
- Incorporating sector rotation and market sentiment analysis
Cryptocurrency Markets
Digital asset markets, while more volatile, follow similar price action principles with some unique characteristics:
- 24/7 trading requires adaptation of traditional session analysis
- Higher volatility creates more pronounced price action signals
- Bitcoin often leads altcoin movements, requiring multi-market analysis
- Social sentiment and news events create rapid price action changes
Risk Management in Price Action Trading
Effective risk management is crucial for long-term success in price action trading:
- Position Sizing: Never risk more than 1-2% of account equity per trade
- Stop Loss Placement: Use structural levels (swing highs/lows, order blocks) rather than arbitrary distances
- Risk-Reward Ratios: Target minimum 1:2 risk-reward, with many setups offering 1:3 or better
- Trade Management: Scale out of positions at key levels, move stops to breakeven when possible
- Emotional Control: Stick to predetermined plans, avoid revenge trading, and maintain discipline
Technology and Price Action: Modern Tools and Platforms
While price action trading can be done with basic charts, modern technology enhances analysis capabilities:
- Advanced Charting Platforms: TradingView, MetaTrader, and professional trading software
- Multi-Timeframe Analysis: Synchronized charts for comprehensive market view
- Volume Profile Analysis: Understanding where institutional activity occurred
- Market Replay Features: Practicing price action reading on historical data
- Alert Systems: Notifications for key price levels and pattern formations
Psychology of Price Action Trading
Success in price action trading requires mastering both technical skills and psychological discipline:
- Patience: Waiting for high-probability setups rather than forcing trades
- Confidence: Trusting your analysis when signals align with your methodology
- Adaptability: Adjusting strategies as market conditions change
- Objectivity: Removing emotions and biases from trading decisions
- Continuous Learning: Markets evolve, requiring ongoing education and skill development
Common Mistakes and How to Avoid Them
Understanding common pitfalls helps accelerate the learning process:
- Overcomplicating Analysis: Focus on key levels and clear signals rather than finding patterns everywhere
- Ignoring Market Context: Always consider broader market conditions and timeframes
- Poor Risk Management: Never risk more than you can afford to lose on any single trade
- Emotional Trading: Stick to your plan regardless of recent wins or losses
- Lack of Patience: Quality setups require waiting for proper conditions to align
Building Your Price Action Trading Plan
A systematic approach to price action trading includes several key components:
- Market Selection: Choose markets that suit your trading style and available time
- Timeframe Analysis: Develop a multi-timeframe approach for context and precision
- Entry Criteria: Define specific conditions required for trade entry
- Exit Strategy: Plan both profit targets and stop loss levels before entering
- Trade Management: Rules for position adjustments and partial profit taking
- Review Process: Regular analysis of trades for continuous improvement
The Future of Price Action Trading
As markets continue to evolve with technological advancement and changing participant dynamics, price action trading adapts while maintaining its core principles:
- Algorithmic Integration: Combining discretionary price action with systematic approaches
- Alternative Data: Incorporating sentiment and flow data while maintaining price focus
- Market Microstructure: Understanding how high-frequency trading affects price action
- Global Connectivity: 24/7 markets requiring adaptation of traditional session analysis
Getting Started: Your Price Action Journey
Beginning your price action trading journey requires a structured approach:
- Education Foundation: Study classical chart patterns, candlestick formations, and market structure
- Modern Methodology: Learn Smart Money Concepts and ICT principles for institutional insight
- Practice Environment: Use demo accounts and market replay features for skill development
- Backtesting: Analyze historical price action to validate your methodology
- Paper Trading: Test strategies in real-time without financial risk
- Live Trading: Start with small position sizes and gradually increase as skills develop
- Continuous Refinement: Regular review and adjustment of strategies based on results
Price action trading offers a pure, direct approach to market analysis that has stood the test of time while continuing to evolve with modern market understanding. Whether you focus on traditional chart patterns or cutting-edge institutional concepts, the foundation remains the same: understanding how price moves and what those movements reveal about market sentiment and future direction.
Related Trading Topics
Technical Analysis
Master chart patterns, indicators, and technical tools to identify high-probability trading opportunities in any market condition.
Explore Technical AnalysisTrading Psychology
Develop the right mindset for consistent trading success. Learn to manage emotions, build discipline, and overcome psychological barriers.
Explore Trading PsychologyReady to Master Price Action Trading?
Join our community of traders and get access to premium educational resources, expert analysis, and powerful trading tools designed specifically for price action traders.