Implied Fair Value Gap: Hidden Price Action Mastery
What is an Implied Fair Value Gap?
The Implied Fair Value Gap (IFVG) represents one of the most sophisticated concepts in modern price action analysis. Unlike traditional Fair Value Gaps that display obvious price gaps between candlesticks, Implied FVGs are hidden inefficiencies that exist within seemingly normal price action. These patterns require a trained eye and precise analytical tools to identify, making them powerful weapons in the arsenal of professional traders.
The genius of Implied Fair Value Gaps lies in their subtlety. While retail traders focus on obvious gaps and patterns, institutional traders create and exploit these hidden imbalances. An IFVG forms when the wicks of surrounding candlesticks overlap the body of a large momentum candle, creating an area of price adjustment that isn't immediately visible but represents a true market inefficiency.
What makes IFVGs particularly valuable is their tendency to remain unnoticed by most market participants. This invisibility factor means that when price eventually returns to these zones, the reactions are often more pure and less crowded than those seen at obvious support and resistance levels. Understanding and trading these patterns provides access to institutional-level market analysis.
The Science Behind Implied Fair Value Gaps
Implied Fair Value Gaps exist because of the mathematical relationship between price, time, and market participants' psychology. When a large momentum candle forms, it represents a period of intense one-sided trading where either buyers or sellers dominated completely. The overlapping wicks of adjacent candles indicate that some price discovery occurred at those levels, but not enough to create market balance.
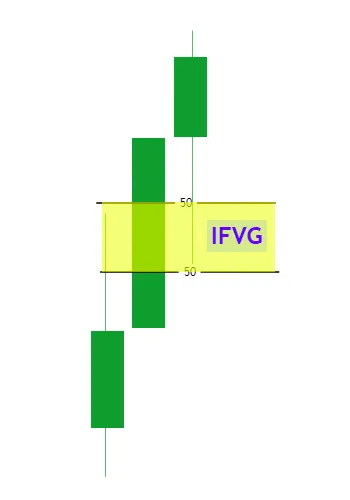
The Three-Candle Structure
Like regular Fair Value Gaps, IFVGs form through a three-candle pattern, but with crucial differences:
- The Preceding Candle: Sets the stage with its wick extending into what will become the implied zone
- The Momentum Candle: A large-bodied candle showing decisive institutional movement
- The Following Candle: Completes the pattern with its wick overlapping the momentum candle's body
The key difference from regular FVGs is that the wicks overlap the momentum candle's body, creating no visible gap. However, the mathematical analysis reveals that an imbalance exists within this overlapping area - specifically at the 50% levels (consequent encroachment) of the relevant wicks.
Fibonacci Integration and Consequent Encroachment
The identification of IFVGs relies heavily on Fibonacci mathematics, particularly the concept of consequent encroachment. This 50% level represents the mathematical midpoint where institutional algorithms often target for optimal execution. The implied gap exists between these 50% levels of the overlapping wicks.
This mathematical precision isn't coincidental. Institutional trading algorithms are programmed to recognize these inefficiencies and target them for order execution. By understanding this mechanistic approach to the markets, traders can position themselves advantageously.
Identifying Implied Fair Value Gaps Step-by-Step
Successfully identifying IFVGs requires a systematic approach that combines pattern recognition with precise mathematical analysis. The process involves multiple steps that must be executed correctly to avoid false patterns.
Step 1: Locate Strong Momentum Candles
Begin by scanning your charts for candlesticks with unusually large bodies relative to recent price action. These momentum candles should show:
- Body-to-wick ratio significantly larger than surrounding candles
- Clear directional bias (strongly bullish or bearish)
- Volume characteristics suggesting institutional involvement
- Formation during active market sessions
Step 2: Analyze Adjacent Candlesticks
Once you've identified a potential momentum candle, examine the candlesticks immediately before and after it. Look for:
- Wicks that penetrate into the momentum candle's body range
- Overlap that creates potential imbalance zones
- Clear structural relationship between the three candles
- No obvious visible gaps between the candles
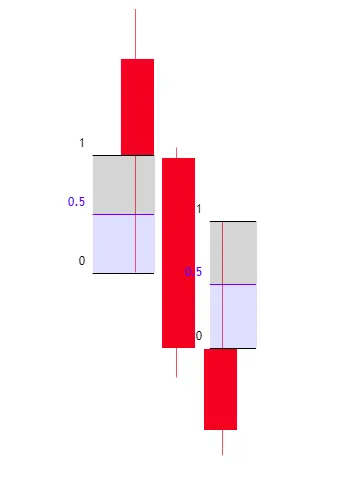
Step 3: Apply Fibonacci Analysis
This is where precision becomes critical. Use the Fibonacci retracement tool to identify the consequent encroachment levels:
For Bullish Implied FVG:
- Measure 50% of the upper wick of the first (preceding) candle
- Measure 50% of the lower wick of the third (following) candle
- The zone between these two 50% levels forms the Bullish IFVG
For Bearish Implied FVG:
- Measure 50% of the lower wick of the first (preceding) candle
- Measure 50% of the upper wick of the third (following) candle
- The zone between these two 50% levels forms the Bearish IFVG
Step 4: Validate the Pattern
Before marking an IFVG as tradeable, ensure:
- The implied zone has clear mathematical boundaries
- The momentum candle shows institutional characteristics
- The pattern aligns with broader market structure
- No recent price action has already tested the zone
Bullish Implied Fair Value Gap Analysis
Bullish Implied Fair Value Gaps form during upward momentum phases and represent hidden support zones that institutional algorithms often target for continued buying. These patterns are particularly powerful when they form during broader uptrends or at significant market structure levels.
Characteristics of Strong Bullish IFVGs
- Momentum Candle Properties: Large bullish body with minimal upper wick
- Volume Signature: Increased volume during the momentum candle formation
- Market Context: Formation during established uptrends or at key support levels
- Wick Overlap Quality: Clean mathematical relationships in the Fibonacci measurements
Trading Bullish IFVGs
When price returns to test a Bullish IFVG, traders should look for:
- Initial Contact: Price approaching the upper boundary of the IFVG zone
- Reaction Analysis: How price behaves when it first touches the zone
- Confirmation Signals: Additional technical factors supporting a bullish response
- Entry Execution: Precise timing based on lower timeframe price action
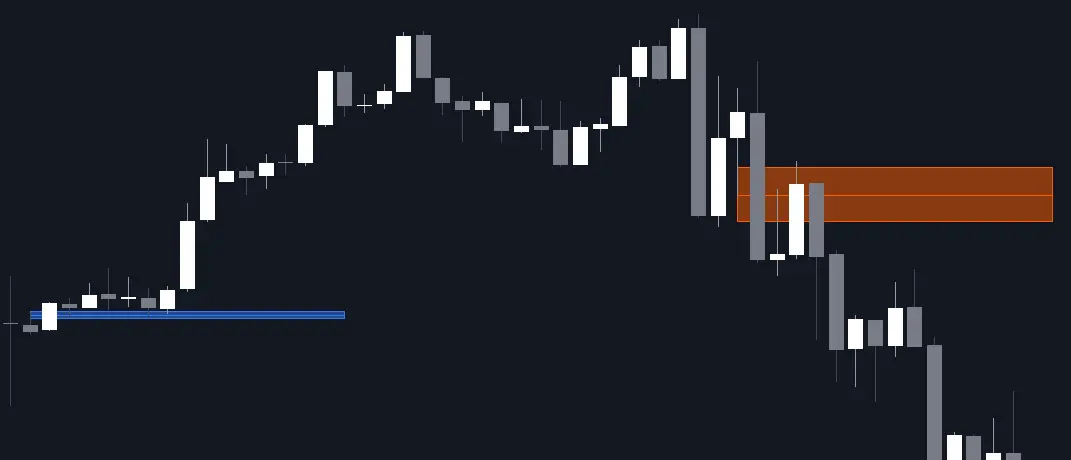
Bearish Implied Fair Value Gap Analysis
Bearish Implied Fair Value Gaps represent hidden resistance zones formed during significant downward momentum. These patterns often provide excellent shorting opportunities when price retraces to test these concealed levels of institutional selling interest.
Identifying High-Quality Bearish IFVGs
Strong Bearish IFVGs typically exhibit:
- Momentum Characteristics: Large bearish body with minimal lower wick
- Selling Pressure: Clear evidence of institutional distribution
- Structural Context: Formation at resistance levels or during downtrends
- Mathematical Precision: Clean Fibonacci relationships in the wick measurements
Bearish IFVG Trading Approach
Trading bearish IFVGs requires patience and precision:
- Zone Approach: Wait for price to rally into the IFVG zone
- Rejection Signals: Look for signs of selling pressure at the zone
- Confirmation: Seek additional bearish signals before entering
- Risk Management: Place stops above the zone with appropriate sizing
Advanced IFVG Trading Strategies
Successfully trading Implied Fair Value Gaps requires sophisticated strategies that account for their hidden nature and mathematical precision. These approaches combine traditional price action analysis with modern algorithmic understanding.
The Confluence Strategy
The most effective IFVG trades occur when multiple analytical factors align:
- Structural Confluence: IFVG zones that align with other key levels
- Timeframe Harmony: IFVGs that appear on multiple timeframes
- Volume Validation: Historical volume at IFVG levels supporting the concept
- Market Context: IFVGs that fit broader market narrative
Multi-Touch Strategy
This approach focuses on IFVGs that have been tested multiple times:
- Identify IFVG zones that have shown previous reactions
- Wait for subsequent tests of the same zone
- Analyze the quality of each reaction for pattern strength
- Enter trades on the most technically sound retest
Scalping Strategy
For shorter-term traders, IFVGs provide excellent scalping opportunities:
- Focus on lower timeframe IFVGs (5-minute to 1-hour charts)
- Target quick reactions at zone boundaries
- Use tight stops just beyond the mathematical zone
- Take profits at logical technical levels
Risk Management for IFVG Trading
Trading Implied Fair Value Gaps requires specialized risk management approaches that account for their mathematical precision and hidden nature. Traditional support and resistance risk management may not be optimal for these sophisticated patterns.
Zone-Based Stop Management
Since IFVGs are mathematical zones rather than precise levels, stop placement requires careful consideration:
- Conservative Approach: Place stops beyond the entire IFVG zone
- Aggressive Approach: Use the opposite boundary of the zone
- Mathematical Approach: Calculate stops based on the zone's mathematical properties
- Time-Based Approach: Exit if the zone doesn't react within expected timeframes
Position Sizing Considerations
IFVG trading often involves different risk parameters than traditional methods:
- Account for potential slippage at hidden levels
- Consider the mathematical precision of entry and exit points
- Adjust sizing based on timeframe and volatility
- Maintain consistent risk across different IFVG qualities
Integration with Other Smart Money Concepts
Implied Fair Value Gaps become exponentially more powerful when integrated with other Smart Money Concepts. This holistic approach provides deeper insights into institutional behavior and creates higher-probability trading scenarios.
IFVG and Order Block Confluence
When IFVGs align with Order Blocks, the combination creates extremely powerful zones:
- Enhanced Probability: Two institutional concepts reinforcing each other
- Precise Entries: Mathematical zones within broader order block areas
- Clear Invalidation: Defined levels for trade management
- Target Clarity: Better profit target identification
Market Structure and IFVG Alignment
IFVGs that form during significant market structure events offer superior trading opportunities:
- Break of Structure (BOS): IFVGs forming during BOS events
- Change of Character (CHoCH): Hidden zones at major turning points
- Liquidity Sweeps: IFVGs near liquidity collection zones
- Market Structure Shifts: Hidden patterns during structural changes
Liquidity and IFVG Relationships
Understanding how IFVGs interact with liquidity concepts enhances trading precision:
- IFVGs often form near areas of liquidity collection
- Hidden zones can act as intermediate targets for institutional algorithms
- IFVG reactions may indicate the quality of available liquidity
- Multiple IFVGs can create liquidity ladders for large position building
Common Mistakes in IFVG Analysis
Trading Implied Fair Value Gaps successfully requires avoiding several common pitfalls that can lead to poor performance and frustration. Understanding these mistakes helps develop better analytical habits.
Over-Identification of Patterns
The Problem: Seeing IFVGs where none exist due to forced pattern recognition.
The Solution: Maintain strict criteria for IFVG identification. Not every three-candle formation with overlapping wicks constitutes a valid IFVG. Focus on quality over quantity.
Ignoring Mathematical Precision
The Problem: Approximating Fibonacci levels instead of calculating precise 50% measurements.
The Solution: Use proper tools to ensure accurate Fibonacci calculations. The power of IFVGs lies in their mathematical precision - approximations reduce effectiveness.
Poor Market Context Analysis
The Problem: Trading IFVGs without considering broader market structure and trends.
The Solution: Always analyze IFVGs within the context of higher timeframe trends, market structure, and institutional flow. Context determines pattern quality.
Inadequate Risk Management
The Problem: Using traditional stop-loss approaches that don't account for IFVG characteristics.
The Solution: Develop risk management approaches specific to zone-based trading. Consider the mathematical nature of IFVGs in stop placement and position sizing.
Advanced IFVG Concepts and Applications
As traders develop proficiency with basic IFVG identification and trading, several advanced concepts can further enhance their understanding and effectiveness. These sophisticated applications represent the cutting edge of modern price action analysis.
Nested IFVG Patterns
Complex market moves sometimes create multiple IFVGs within the same price structure. These nested patterns require sophisticated analysis but offer exceptional trading opportunities:
- Multiple timeframe IFVG alignment
- Layered mathematical zones within broader patterns
- Sequential IFVG development during extended moves
- Interaction between different IFVG timeframes
Algorithmic IFVG Recognition
Modern algorithmic trading systems are increasingly sophisticated in IFVG recognition. Understanding how algorithms identify and trade these patterns provides competitive advantages:
- Mathematical pattern recognition algorithms
- Automated Fibonacci calculation systems
- Machine learning applications in IFVG identification
- Institutional algorithm behavior at IFVG zones
IFVG Pattern Validation
Advanced traders develop sophisticated validation methods for IFVG patterns:
- Statistical analysis of IFVG success rates
- Volume profile validation techniques
- Market microstructure analysis
- Cross-market IFVG correlation studies
Technology and Tools for IFVG Analysis
Effective IFVG analysis requires appropriate technological tools and setups. Having the right equipment and software significantly enhances pattern recognition and trading execution quality.
Essential Software Features
- Precise Fibonacci Tools: Accurate measurement capabilities for wick analysis
- Multi-Timeframe Analysis: Simultaneous viewing of multiple timeframes
- Custom Indicators: IFVG detection and marking tools
- Alert Systems: Notifications for IFVG zone tests
- Historical Analysis: Backtesting capabilities for pattern validation
Recommended Analysis Workflow
- Market Scan: Daily review of multiple markets for IFVG formations
- Pattern Documentation: Recording identified IFVGs with mathematical precision
- Context Analysis: Evaluating broader market structure and trends
- Trade Planning: Developing specific entry and exit strategies
- Performance Review: Analyzing trade outcomes for continuous improvement
Market Psychology and IFVG Effectiveness
The effectiveness of Implied Fair Value Gaps stems partly from market psychology and the behavior of different participant groups. Understanding these psychological elements enhances trading success and pattern recognition.
Institutional vs. Retail Recognition
The hidden nature of IFVGs creates a natural advantage for sophisticated traders:
- Institutional Awareness: Algorithms designed to recognize and exploit IFVGs
- Retail Blindness: Most retail traders miss these hidden patterns
- Education Gap: Limited understanding of mathematical pattern analysis
- Technology Disparity: Institutional tools vs. retail platforms
Psychological Trading Advantages
Trading IFVGs provides several psychological benefits:
- Reduced competition at entry levels
- Higher conviction due to mathematical precision
- Better risk-reward ratios from hidden levels
- Improved patience due to pattern sophistication
Case Studies: Real Market IFVG Examples
Examining real market examples of Implied Fair Value Gaps helps solidify understanding and provides practical insights into how these patterns develop and resolve in live trading conditions.
Case Study 1: Index Future Bullish IFVG
A major index future formed a Bullish IFVG during a key economic announcement. The pattern demonstrated:
- Clean mathematical relationships in the Fibonacci measurements
- Strong institutional volume during the momentum candle
- Multiple successful tests of the IFVG zone
- Excellent integration with broader market structure
- High-probability continuation signals from the hidden zone
Case Study 2: Currency Pair Bearish IFVG
A major currency pair developed a Bearish IFVG following central bank policy statements. The setup showed:
- Precise wick overlap creating the implied zone
- Strong selling interest at the mathematical level
- Clear rejection signals from the hidden resistance
- Excellent risk-reward characteristics
- Sustained follow-through from the IFVG rejection
Future Evolution of IFVG Analysis
As markets continue to evolve and become increasingly algorithmic, the analysis and application of Implied Fair Value Gaps will likely become more sophisticated. Understanding these trends helps traders prepare for future developments.
Technological Advancement
- AI Pattern Recognition: Machine learning systems identifying IFVGs
- Automated Analysis: Real-time IFVG detection and classification
- Enhanced Visualization: Better tools for pattern display and analysis
- Cross-Market Analysis: Systematic IFVG correlation studies
Market Structure Evolution
As more traders learn about IFVGs, market dynamics may shift:
- Increased awareness reducing pattern effectiveness
- Evolution of new hidden pattern variations
- Institutional adaptation to retail IFVG recognition
- Development of counter-IFVG strategies
Conclusion: Mastering Implied Fair Value Gaps
Implied Fair Value Gaps represent the frontier of modern price action analysis, combining mathematical precision with institutional insight to create powerful trading opportunities. These hidden patterns provide access to the same analytical framework used by professional algorithmic trading systems, leveling the playing field for sophisticated retail traders.
The journey to mastering IFVGs requires dedication to mathematical precision and a deep understanding of market microstructure. Unlike obvious chart patterns that attract widespread attention, IFVGs reward the patient analyst who invests time in proper identification and validation techniques. This educational barrier creates a natural advantage for those willing to develop these advanced skills.
Perhaps most importantly, IFVG analysis represents a fundamental shift toward algorithmic thinking in manual trading. By understanding how institutional algorithms identify and exploit these hidden inefficiencies, traders gain insights into the mechanical processes that drive modern markets. This knowledge creates opportunities to position alongside institutional flow rather than against it.
As markets continue to evolve and become increasingly sophisticated, concepts like Implied Fair Value Gaps will likely become standard tools in professional trading arsenals. Traders who master these techniques today position themselves advantageously for the future of market analysis and execution.
Key Takeaways
- IFVGs are hidden inefficiencies identified through overlapping wick analysis and Fibonacci measurements
- Mathematical precision is crucial - use exact 50% levels for consequent encroachment calculations
- These patterns are less crowded than obvious support/resistance, providing better risk-reward ratios
- Integration with other Smart Money Concepts significantly enhances IFVG effectiveness
- Proper risk management must account for zone-based rather than level-based characteristics
- Technology and systematic analysis workflows improve pattern identification and validation
- Understanding institutional algorithm behavior enhances trading precision and success rates