New Day Opening Gap (NDOG)
What is a New Day Opening Gap (NDOG)?
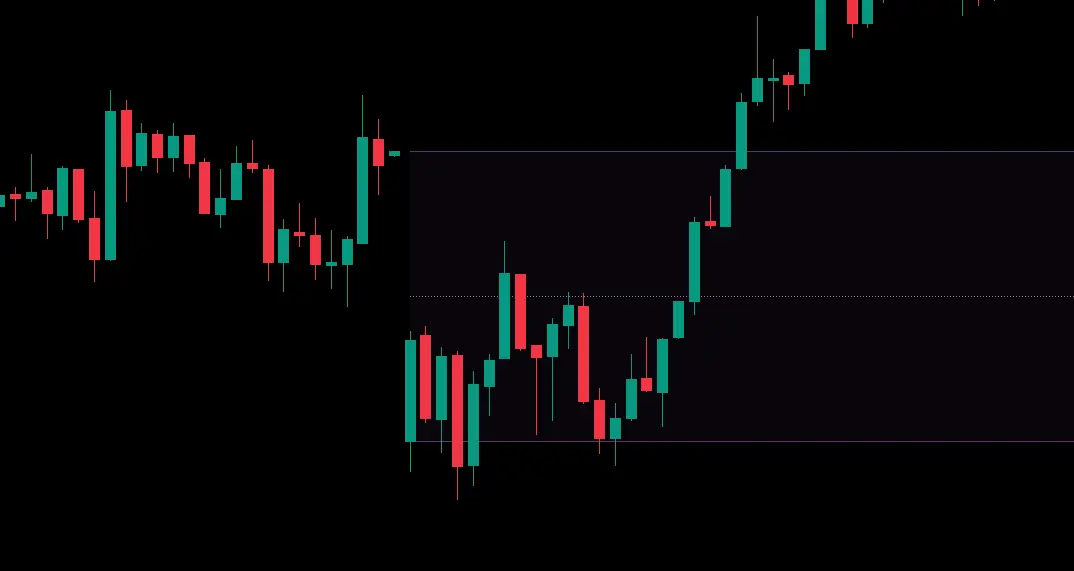
A New Day Opening Gap (NDOG), a key concept in ICT (Inner Circle Trader) methodologies, refers to the price difference between the previous day's closing price (typically 5:00 PM EST for futures markets) and the current day's opening price (typically 6:00 PM EST after the one-hour market break from Monday to Thursday). This gap represents a liquidity void, an area where no trading activity occurred, creating an imbalance that often acts as a magnet for price during the trading day.
Visual representation of a New Day Opening Gap (NDOG) showing the price void between the previous day's close and current day's open.
In Smart Money Concepts (SMC), NDOGs are viewed as significant market inefficiencies or Fair Value Gaps that institutional traders (Smart Money) may seek to rebalance. Understanding and identifying these gaps provides traders with insights into potential intraday price targets and high-probability trading opportunities. These gaps highlight where price has moved without sufficient transaction volume, signaling an imbalance that the market may later correct.
The formation of NDOGs is primarily driven by market activity, news releases, or economic data that emerges after the previous session's close and before the new session's open. When markets reopen, these factors are priced in, potentially causing the opening price to differ significantly from the prior close, thus creating the NDOG.
Types of New Day Opening Gaps
Bullish NDOG
A Bullish NDOG forms when the current day's opening price is higher than the previous day's closing price.
A Bullish NDOG occurs when the market opens at a higher price than its previous day's close. This upward gap often indicates strong underlying buying pressure or positive sentiment from overnight developments. Key characteristics include:
- Formation: Current day's opening price > Previous day's closing price.
- Market Implication: Suggests potential bullish sentiment or the continuation/strengthening of an existing intraday uptrend.
- Behavior as Support: If price is trading above the Bullish NDOG, the gap area often acts as a support level during the session.
- Gap Fill Dynamics: The market may retrace downwards to "fill the gap" by returning to the previous day's closing price.
- Institutional Significance: Can indicate areas where institutional buying interest is present.
Bullish NDOGs are particularly noteworthy when they form after a consolidation phase or at significant support levels, potentially heralding a new intraday upward move. The size of the gap can also be indicative; larger gaps might suggest stronger institutional backing or more impactful catalysts.
Bearish NDOG
A Bearish NDOG forms when the current day's opening price is lower than the previous day's closing price.
A Bearish NDOG occurs when the market opens at a lower price than its previous day's close. This downward gap often points to strong selling pressure or negative sentiment from overnight events. Key characteristics include:
- Formation: Current day's opening price < Previous day's closing price.
- Market Implication: Suggests potential bearish sentiment or the continuation/strengthening of an existing intraday downtrend.
- Behavior as Resistance: If price is trading below the Bearish NDOG, the gap area often acts as a resistance level during the session.
- Gap Fill Dynamics: The market may rally upwards to "fill the gap" by returning to the previous day's closing price.
- Institutional Significance: Can indicate areas where institutional selling or distribution is occurring.
Bearish NDOGs are particularly relevant when they appear after a strong rally or at key resistance levels, potentially signaling an intraday reversal or the continuation of a downtrend. The market context surrounding the gap's formation is crucial for its interpretation.
How to Identify and Calculate NDOG
Identifying and calculating a New Day Opening Gap is a precise process within ICT and SMC frameworks:
1. Identify Key Price Levels (Using NY Local Time - EST/EDT)
- Mark Previous Day's Closing Price:
- For markets like Index Futures (e.g., E-mini S&P 500), this is typically the 5:00 PM EST/EDT closing price.
- This marks the final transacted price before the daily 1-hour break.
- Mark Current Day's Opening Price:
- Continuing with Index Futures, this is the 6:00 PM EST/EDT opening price when the market reopens after the break.
- This is the first transacted price of the new trading day (Monday to Thursday).
- Note: The gap between Friday's close and Sunday's/Monday's open is a New Week Opening Gap (NWOG), a related but distinct concept.
- Define the Gap Zone:
- The space between these two prices (previous close and current open) constitutes the NDOG.
- Example: If ES closes at 4500.00 at 5 PM EST and reopens at 4505.00 at 6 PM EST, there's a 5-point bullish NDOG.
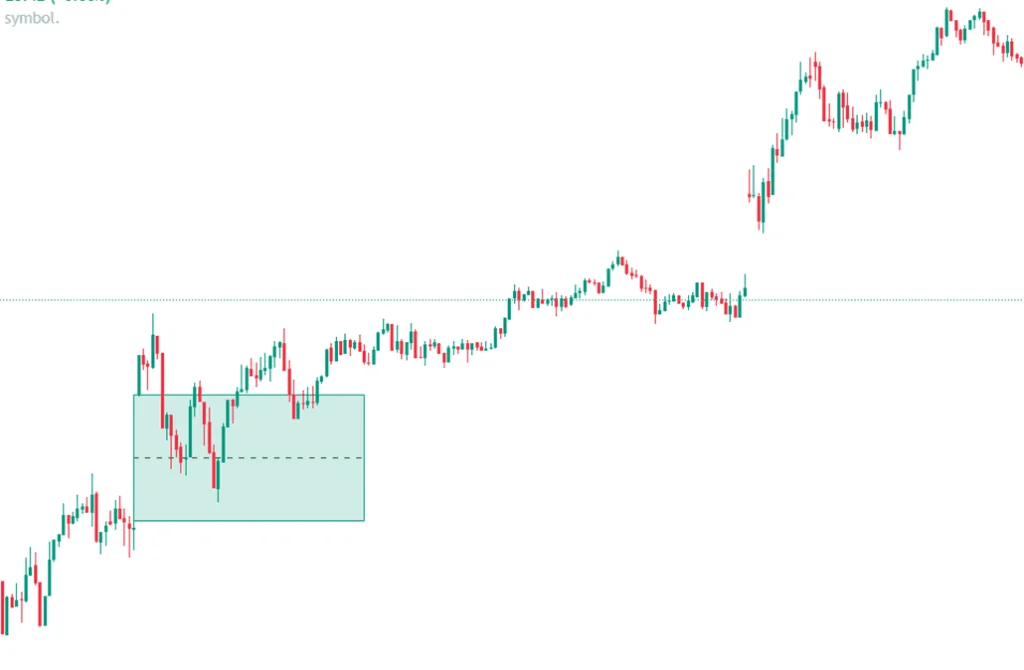
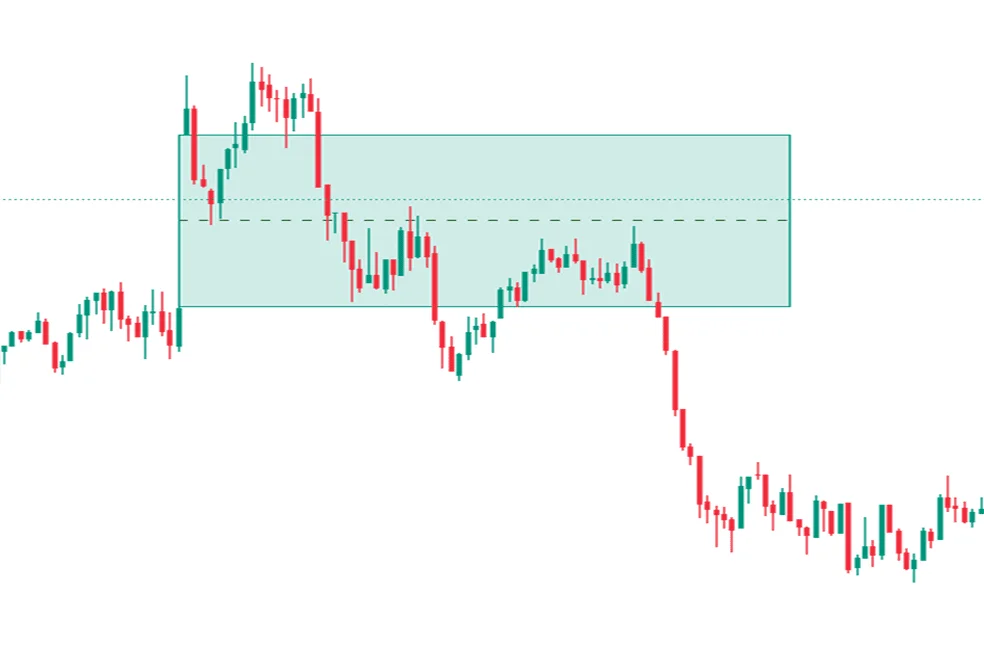
2. Calculate Consequent Encroachment (CE)
The Consequent Encroachment (CE) is the 50% midpoint of the NDOG. According to ICT, this is often the most reactive level within the gap.
- Apply Fibonacci Tool:
- Use a Fibonacci retracement tool with levels set at 0, 0.5, and 1.0.
- For a Bullish NDOG: Draw from the previous day's close (0 level) up to the current day's open (1 level).
- For a Bearish NDOG: Draw from the previous day's close (0 level) down to the current day's open (1 level).
- Identify the 50% Level (0.5):
- This 0.5 Fibonacci level marks the Consequent Encroachment.
- Example: For a bullish NDOG from 4500.00 to 4505.00, the CE is at 4502.50.
- Mark on Chart:
- Clearly mark the NDOG range and its CE level on your chart.
- Price interactions at the CE level are key for potential trade entries or reactions.
ICT recommends annotating at least the last 5 New Day Opening Gaps on your chart. These levels can remain influential for several days, providing a framework of fair value, support/resistance, and potential draws on liquidity.
Trading Strategies for New Day Opening Gaps
Effective NDOG trading involves assessing market bias, observing price interaction with the gap, and waiting for confirmation. Here are established ICT-based strategies:
1. Trading with Bullish Bias
Scenario A: Price is Above the NDOG
- Action: Wait for price to retrace and test the NDOG (or its CE level).
- Confirmation: Look for bullish confirmation on a lower timeframe (e.g., 5-min or 15-min Market Structure Shift, bullish engulfing, etc.) as price interacts with the NDOG.
- Entry: Consider a long entry after confirmation.
- Stop Loss: Typically placed below the low of the NDOG or a key structural point.
- Target: Aim for the next draw on liquidity (e.g., a previous high, another Fair Value Gap).
Scenario B: Price is Below the NDOG
- View: The NDOG acts as a draw on liquidity.
- Action: Wait for price to trade up into the NDOG and ideally close above it (or above its CE).
- Confirmation: A close above the NDOG signifies strength and the NDOG may then act as support.
- Entry: Look for long entries on retests of the reclaimed NDOG as support.
2. Trading with Bearish Bias
Scenario A: Price is Below the NDOG
- Action: Wait for price to retrace and test the NDOG (or its CE level).
- Confirmation: Look for bearish confirmation on a lower timeframe (e.g., Market Structure Shift down) as price interacts with the NDOG.
- Entry: Consider a short entry after confirmation.
- Stop Loss: Typically placed above the high of the NDOG or a key structural point.
- Target: Aim for the next draw on liquidity (e.g., a previous low).
Scenario B: Price is Above the NDOG
- View: The NDOG acts as a draw on liquidity.
- Action: Wait for price to trade down into the NDOG and ideally close below it (or below its CE).
- Confirmation: A close below the NDOG signifies weakness and the NDOG may then act as resistance.
- Entry: Look for short entries on retests of the reclaimed NDOG as resistance.
3. Gap Fill Strategy (General Market Tendency)
While ICT focuses on NDOGs as Fair Value Gaps, a common market tendency is for gaps to "fill." This means price returns to the previous day's close.
- Observation: Many NDOGs, especially smaller ones in less volatile conditions, tend to get filled during the same trading session.
- Strategy: If price opens with a gap and then shows signs of reversing towards the previous close, traders might play for the gap fill.
- Caution: This is a more general market observation. Always combine with ICT principles like market structure and liquidity draws for higher probability. Not all gaps fill, especially larger, news-driven ones.
4. Consequent Encroachment (CE) as a Key Level
The 50% level (CE) of the NDOG is highly significant in ICT.
- Precision: The CE often acts as a precise level of support or resistance.
- Reaction Point: Watch for strong reactions (rejection or price breaking through and retesting) at the CE.
- Entry Trigger: A clear reaction at CE, confirmed by lower timeframe price action, can be an entry trigger.
NDOG in Different Trading Sessions & Markets
NDOGs primarily apply to markets with a daily close and reopen, such as index futures (ES, NQ, YM). Their identification is based on the New York local time for these instruments.
- Forex: While Forex is a 24-hour market from Sunday evening to Friday evening, some traders adapt the NDOG concept to specific session opens (e.g., London Open, New York Open) if there's a discernible price gap relative to a previous reference point. However, the classic ICT NDOG is most clearly defined in markets with daily settlement and reopening like futures.
- Stocks: Individual stocks also gap at the market open (9:30 AM EST) relative to their previous day's close (4:00 PM EST). The principles of gaps as liquidity voids can be applied, though ICT's specific NDOG timing (5 PM/6 PM EST) is tailored to futures.
- Asian Session: NDOGs (based on NY close/open) are already established before the Asian session begins. Price during the Asian session might interact with these pre-existing NDOG levels.
- London Session: This session often sees significant moves that may target or react to existing NDOGs. The London Open Killzone is a key time to watch for NDOG interaction.
- New York Session: This is the primary session for NDOGs formed on US instruments. High volume and volatility during the NY session often lead to NDOGs being tested, filled, or respected.
Integration with Other Smart Money Concepts
NDOGs are most powerful when used in confluence with other ICT concepts:
NDOG with Order Blocks (OB)
- Confluence: An Order Block located within or at the edge of an NDOG creates a high-probability support/resistance zone.
- Mitigation: Price returning to an NDOG might also be mitigating an OB within that gap.
NDOG with Other Fair Value Gaps (FVG) / Imbalances
- Stacked Imbalances: An NDOG is a type of FVG. If other FVGs from intraday price action align with or are contained within an NDOG, that area becomes more significant.
- Draw on Liquidity: Unfilled NDOGs, like other FVGs, act as a draw on liquidity, pulling price towards them.
NDOG with Liquidity Pools
- Targeting Liquidity: Smart Money may use an NDOG as a staging ground to target nearby liquidity (e.g., old highs/lows). Price might sweep liquidity then react off an NDOG.
- Stop Hunts: Price might push through an NDOG to grab stops, then reverse.
NDOG with Market Structure Shifts (MSS)
- Confirmation: A Market Structure Shift on a lower timeframe after price interacts with an NDOG (or its CE) can confirm a reversal and provide an entry signal.
Common Mistakes When Trading NDOGs
- Ignoring Higher Timeframe Bias: Trading NDOGs without aligning with the broader market direction.
- No Confirmation: Entering solely because price touches an NDOG, without waiting for a reaction or lower timeframe confirmation.
- Trading Every NDOG: Not all NDOGs are created equal. Consider the market environment and confluence factors.
- Incorrect Gap Identification: Using incorrect closing/opening times for the specific market being traded. The 5PM/6PM EST timing is specific to certain futures contracts.
- Chasing Gap Fills: Assuming every gap will fill completely or quickly.
- Poor Risk Management: Not using appropriate stop-loss placements.
Advanced NDOG Considerations
- Multiple NDOGs: Keep track of several recent NDOGs. Older, unfilled NDOGs can still be relevant.
- Gap Size: Larger gaps formed on high volume may be more significant and less likely to fill quickly. Small gaps might fill easily.
- Time of Day: NDOGs are often most reactive during high-volume periods like the London and New York Killzones.
- News Impact: NDOGs created by significant news events might behave differently than those formed in quieter conditions.
Conclusion
The New Day Opening Gap (NDOG) is a potent tool in the ICT trader's arsenal for intraday analysis. By correctly identifying the gap between the previous day's close and the current day's open (specifically 5 PM - 6 PM EST for key futures), and by paying close attention to its Consequent Encroachment, traders can pinpoint significant areas of imbalance. These gaps often serve as support/resistance or draw price towards them.
Successful NDOG trading hinges on combining this concept with overall market structure, liquidity analysis, and other ICT tools. Always seek confirmation and practice disciplined risk management. While primarily an intraday concept, the principles behind NDOGs, liquidity voids and fair value, are fundamental to understanding price action across all timeframes.
Mastery comes from diligent chart study, consistent application of the rules for identification and trading, and adapting to the specific characteristics of the market you are trading. By doing so, NDOGs can significantly enhance your ability to anticipate intraday price movements and trade in harmony with institutional order flow.