SMT Divergence: Trading Smart Money Technique Divergences
What is SMT Divergence?
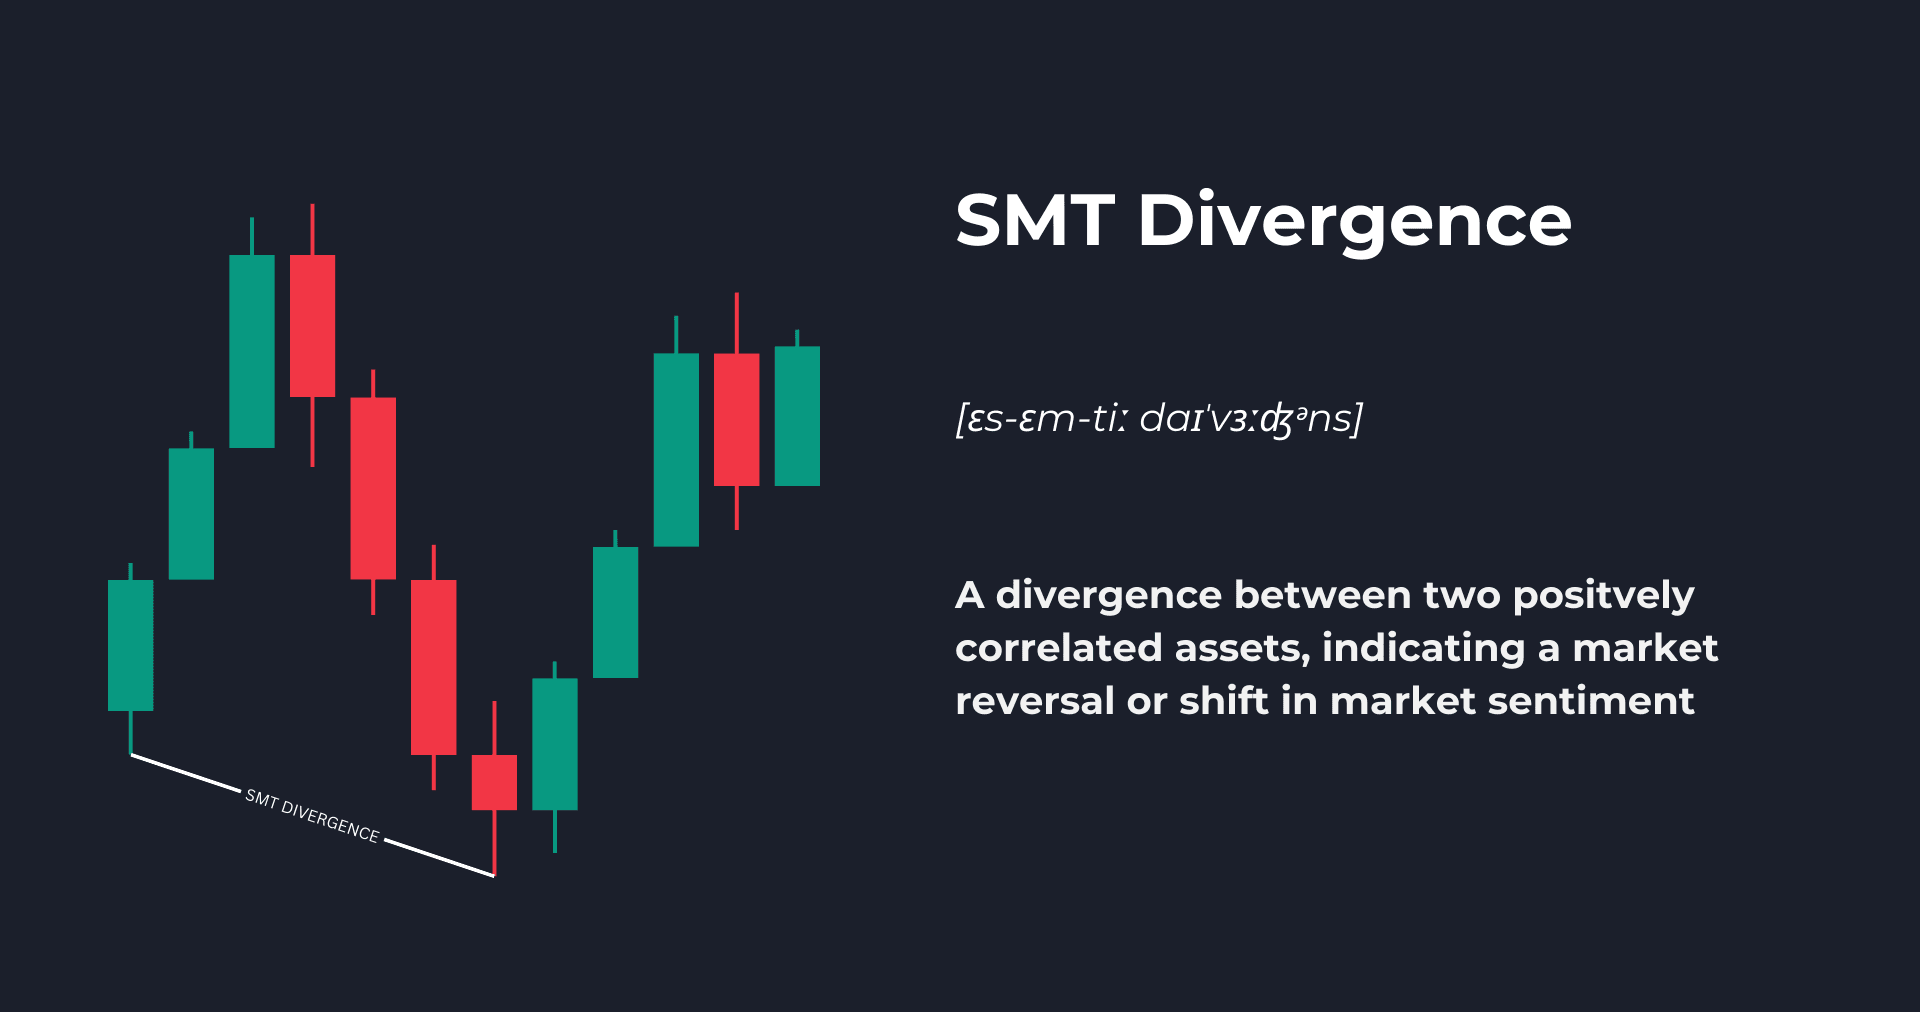
SMT Divergence (Smart Money Technique Divergence) is a powerful trading concept within the Smart Money Concept (SMC) and Inner Circle Trader (ICT) methodologies. It identifies situations where two correlated assets exhibit opposing market structure or price movement patterns. This divergence between assets that typically move together (or oppositely for negatively correlated pairs) provides insights into potential market reversals.
Unlike traditional technical indicator divergences (such as RSI or MACD divergence), SMT Divergence compares the price action between two related financial instruments. It operates on the principle that when correlated assets fail to confirm each other's movements, it often signals a weakening trend and potential reversal in the near future.
This concept was popularized by the Inner Circle Trader (ICT) and has become an essential tool for traders looking to identify institutional positioning and smart money footprints in the market. By recognizing these divergences, retail traders can gain insights into potential market manipulation and align their trades with institutional order flow.
Understanding Market Correlations
Before diving deeper into SMT Divergence, it's essential to understand market correlations, as these form the foundation for identifying meaningful divergences. There are three primary types of correlation between assets:
Positive Correlation
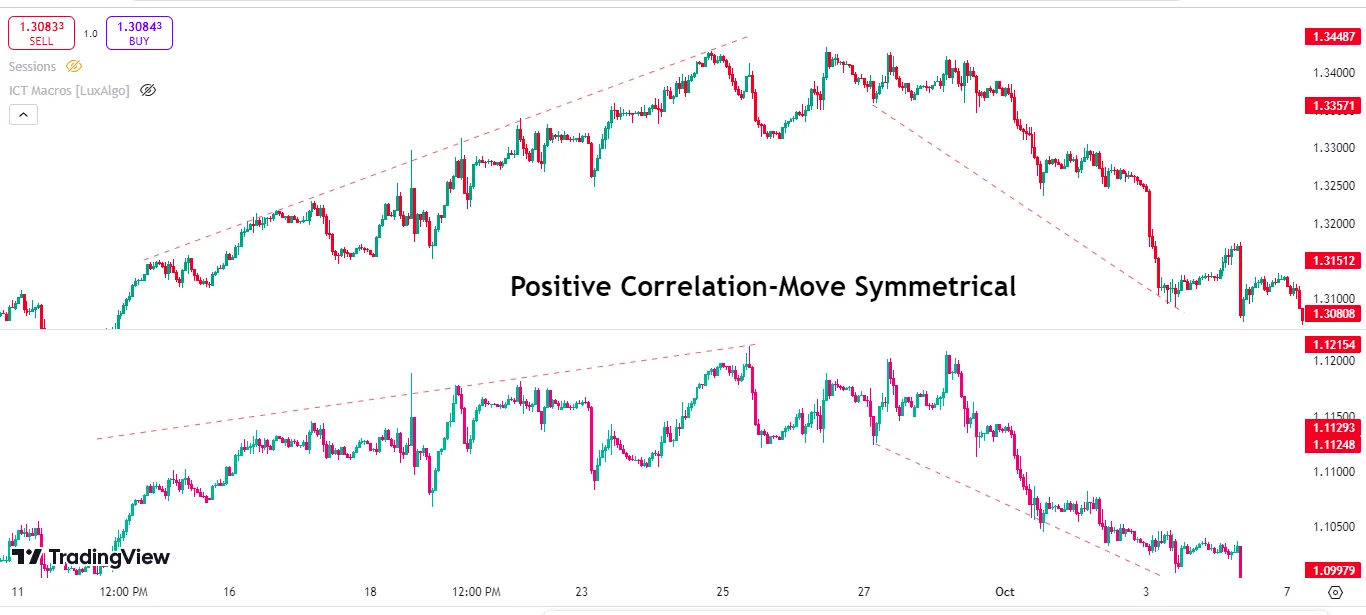
Positively correlated assets tend to move in the same direction. When one asset rises, the other typically rises as well. This correlation occurs when assets are influenced by similar economic factors or belong to the same market sector.
Examples of positively correlated assets include:
- EUR/USD and GBP/USD - These currency pairs often move in tandem as they're both quoted against the US dollar and influenced by similar economic factors
- S&P 500 (ES) and Nasdaq 100 (NQ) - These major US indices generally move in the same direction, though with varying magnitudes
- Bitcoin (BTC) and Ethereum (ETH) - Major cryptocurrencies frequently display strong positive correlations
- Oil companies within the same sector - Stocks like Exxon Mobil and Chevron often move together as they respond to similar market conditions
Negative Correlation
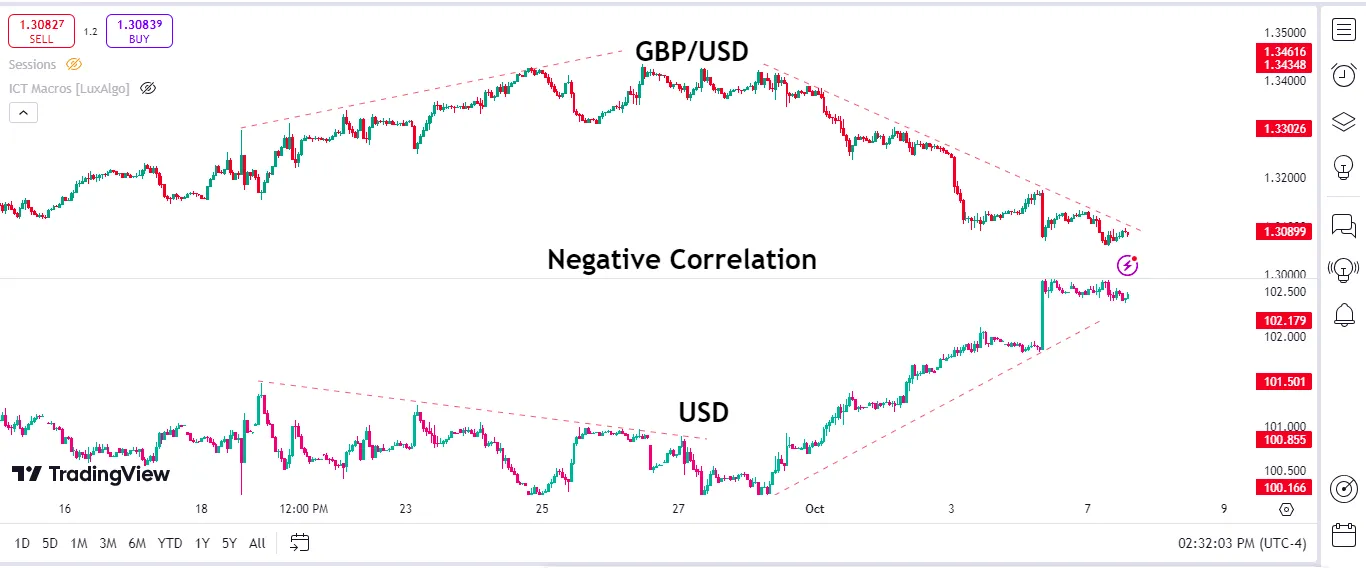
Negatively correlated assets tend to move in opposite directions. When one asset rises, the other typically falls. This relationship exists between assets that respond differently to economic conditions or represent competing interests.
Examples of negatively correlated assets include:
- US Dollar Index (DXY) and EUR/USD - These generally move inversely as the Euro comprises a significant portion of the Dollar Index
- Gold (XAU/USD) and US Dollar Index (DXY) - Gold typically strengthens when the dollar weakens and vice versa
- Bond prices and interest rates - When interest rates rise, existing bond prices tend to fall
- Volatility Index (VIX) and S&P 500 (SPX) - Market volatility often increases when equities fall, creating an inverse relationship
No Correlation
Some assets show little to no correlation with each other, moving independently based on their own specific market factors. These assets don't provide useful information for SMT Divergence analysis.
Examples might include:
- A technology stock vs. an agricultural commodity
- A regional currency pair vs. an unrelated market sector index
- Assets from entirely different classes with no economic relationship
Types of SMT Divergence
There are two primary types of SMT Divergence that traders look for, each providing different insights into potential market reversals:
Bullish SMT Divergence
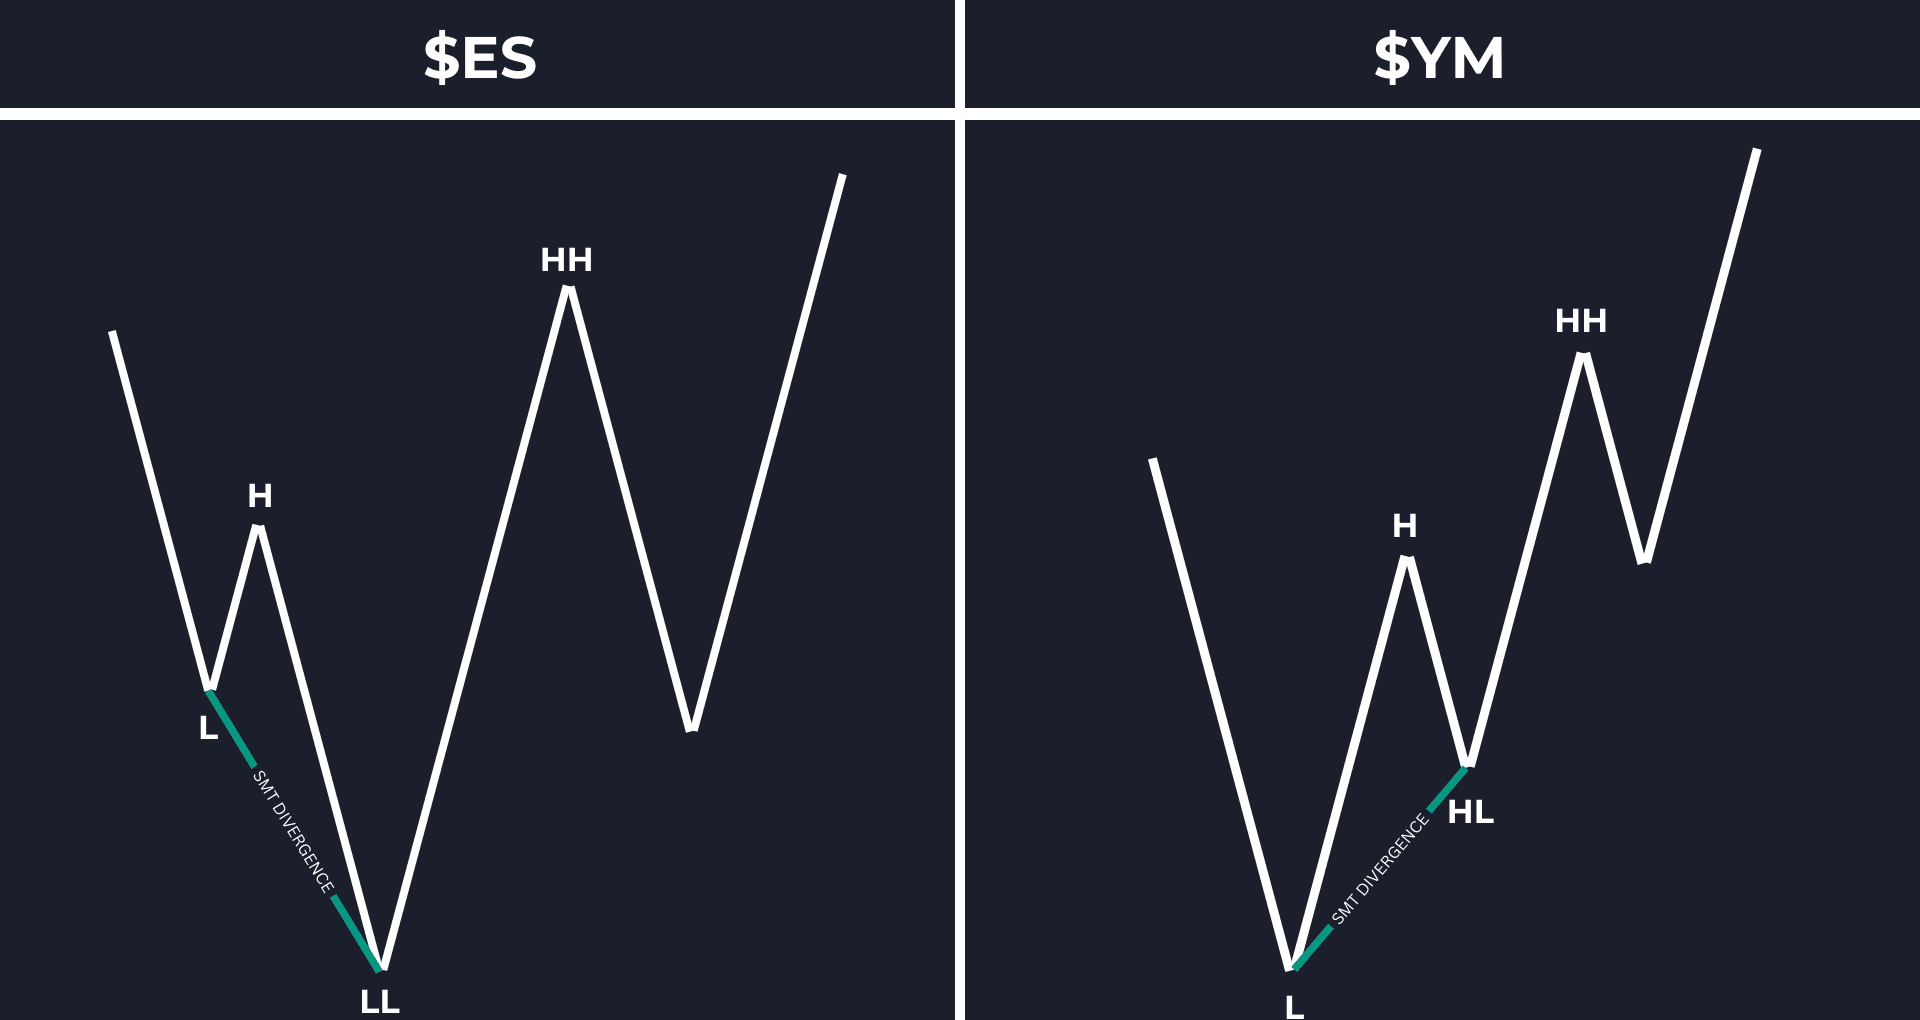
A bullish SMT Divergence occurs at market lows and signals a potential upward reversal. For positively correlated assets, it forms when:
- Asset A creates a lower low (LL)
- Asset B, which typically moves similarly, creates a higher low (HL) instead of also making a lower low
- This divergence suggests weakness in the downtrend and potential buying pressure entering the market
For negatively correlated assets, a bullish SMT Divergence occurs when:
- Asset A creates a higher low (HL)
- Asset B, which typically moves oppositely, creates a lower high (LH) instead of making a higher high (which would align with Asset A's higher low)
Bearish SMT Divergence
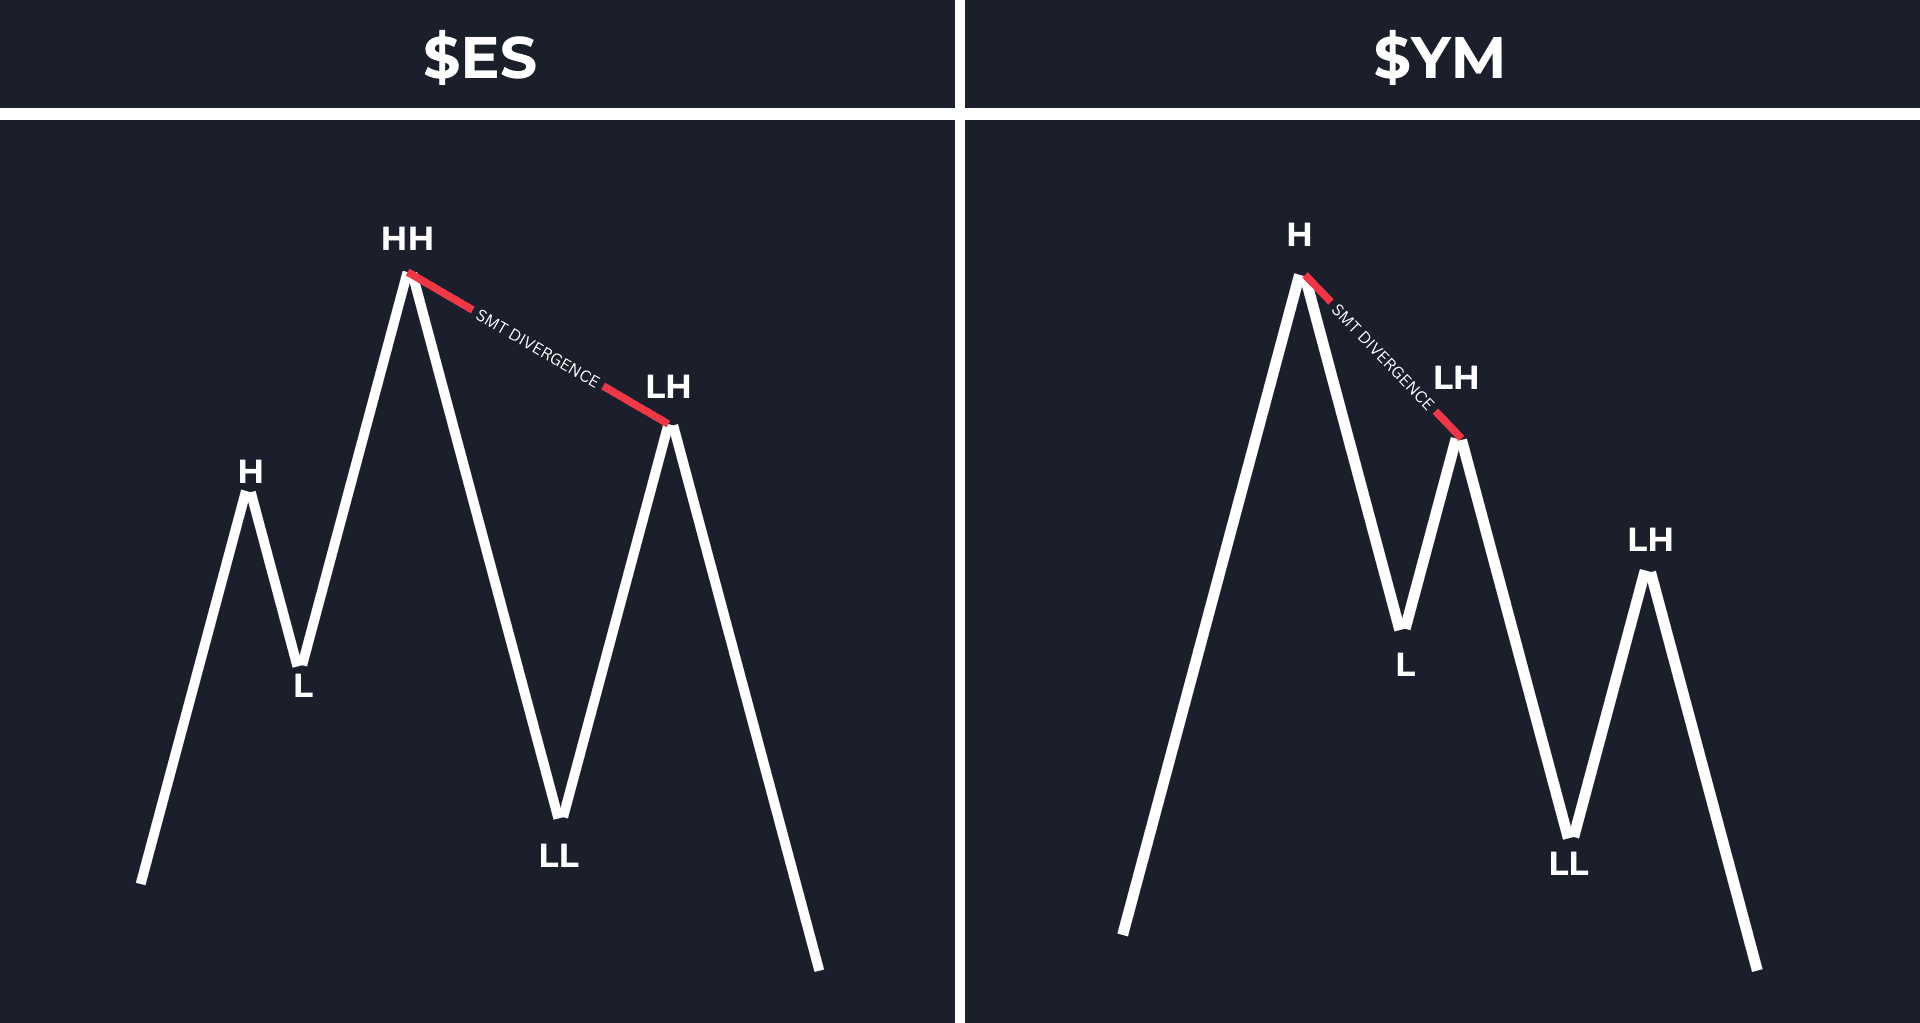
A bearish SMT Divergence occurs at market highs and signals a potential downward reversal. For positively correlated assets, it forms when:
- Asset A creates a higher high (HH)
- Asset B, which typically moves similarly, creates a lower high (LH) instead of also making a higher high
- This divergence suggests weakness in the uptrend and potential selling pressure entering the market
For negatively correlated assets, a bearish SMT Divergence occurs when:
- Asset A creates a lower high (LH)
- Asset B, which typically moves oppositely, creates a higher low (HL) instead of making a lower low (which would align with Asset A's lower high)
How to Identify SMT Divergence
Identifying SMT Divergence requires attention to detail and a systematic approach:

- Select Correlated Assets
- Choose two assets with a strong historical correlation (positive or negative)
- Common pairs include EUR/USD and GBP/USD, ES and NQ, or DXY and Gold
- Ensure both charts are set to the same timeframe for proper comparison
- Identify Key Swing Points
- Look for important swing highs and lows on both charts
- Focus on areas where price creates higher highs/lows or lower highs/lows
- Pay special attention to recent market structure development
- Compare Swing Patterns
- For bullish divergence: Compare the pattern of lows between both assets
- For bearish divergence: Compare the pattern of highs between both assets
- Identify instances where one asset fails to make the same structural pattern as the other
- Confirm the Divergence
- For bullish SMT in positively correlated assets: Confirm that one asset makes a LL while the other makes a HL
- For bearish SMT in positively correlated assets: Confirm that one asset makes a HH while the other makes a LH
- For correlated pairs, adjust the expected patterns accordingly based on whether they're positively or negatively correlated
How to Trade SMT Divergence
Trading with SMT Divergence requires careful execution and integration with other trading concepts:
1. Use SMT Divergence as Confluence
SMT Divergence is most powerful when used as a confirmatory signal rather than a standalone entry trigger:
- Combine with Order Blocks or Fair Value Gaps for higher-probability setups
- Look for divergence at key support/resistance levels or Fibonacci retracement zones
- Use in conjunction with Market Structure Breaks (MSB) for confirmation
- SMT Divergence can provide excellent confluence when price approaches higher timeframe liquidity zones
2. Long Trade Example (Bullish SMT Divergence)
When spotting a bullish SMT Divergence between positively correlated assets:
- Identify when one asset makes a lower low (LL) while the other forms a higher low (HL)
- Look for a bullish Order Block or Fair Value Gap near the divergence zone
- Wait for price to retest this zone before considering an entry
- Enter a long position when price shows rejection from the zone with a small candle pattern (pin bar, engulfing, etc.)
- Place your stop loss below the most recent swing low or below the order block
- Target the next significant resistance level or previous swing high
3. Short Trade Example (Bearish SMT Divergence)
When spotting a bearish SMT Divergence between positively correlated assets:
- Identify when one asset makes a higher high (HH) while the other forms a lower high (LH)
- Look for a bearish Order Block or Fair Value Gap near the divergence zone
- Wait for price to retest this zone before considering an entry
- Enter a short position when price shows rejection from the zone with a small candle pattern
- Place your stop loss above the most recent swing high or above the order block
- Target the next significant support level or previous swing low
4. Risk Management Considerations
Proper risk management is crucial when trading SMT Divergence:
- Never risk more than 1-2% of your trading account on a single SMT Divergence trade
- Use a minimum risk-to-reward ratio of 1:2 or greater
- Consider scaling into positions if conviction is high
- Have clear invalidation criteria - if price breaks beyond your stop level, accept that the divergence has failed
- Higher timeframe divergences typically require wider stops but offer larger potential rewards
Best Practices for SMT Divergence Trading
- Timeframe Selection
SMT Divergence can be identified on any timeframe, but different timeframes serve different trading styles:
- Higher timeframes (Daily, 4H) produce more reliable but less frequent signals
- Lower timeframes (15m, 1H) create more trading opportunities but with potentially lower reliability
- Consider using multi-timeframe analysis - identify divergence on higher timeframes and fine-tune entries on lower timeframes
- Optimal Asset Pairs
The strength of correlation between assets significantly impacts the reliability of SMT Divergence signals:
- Forex: EUR/USD and GBP/USD, USD/CAD and USD/JPY
- Indices: ES (S&P 500) and NQ (Nasdaq 100), Dow Jones and Russell 2000
- Commodities: Gold and Silver, WTI Crude and Brent Crude
- Cryptocurrencies: Bitcoin and Ethereum, Bitcoin and broader crypto indices
- Confirmation Signals
Wait for additional confirmation before entering trades based on SMT Divergence:
- Price action confirmation (rejection candles, engulfing patterns)
- Break and retest of key levels
- Volume confirmation (declining volume in the direction of the trend)
- Traditional indicator divergences (RSI, MACD) aligning with the SMT Divergence
- Integration with Trading Plan
Incorporate SMT Divergence into a comprehensive trading strategy:
- Define specific criteria for valid SMT Divergence setups
- Document and track the performance of different types of SMT Divergence trades
- Practice identifying divergences on historical charts before trading them live
- Consider market context and overall trend before taking SMT Divergence trades
Common Mistakes When Trading SMT Divergence
Avoid these pitfalls to improve your SMT Divergence trading results:
- Forcing Correlations - Not all assets maintain consistent correlations. Verify the historical relationship before using pairs for divergence analysis
- Ignoring Market Context - SMT Divergence is most powerful when aligned with the broader market narrative and key technical levels
- Trading Divergence Alone - Relying solely on SMT Divergence without additional confirmation reduces win rates
- Neglecting Timeframe Alignment - Divergence on lower timeframes may be invalidated by stronger trends on higher timeframes
- Impatience - Not waiting for price to return to a logical entry zone after identifying divergence often results in poor entries
- Improper Risk Management - Taking oversized positions on divergence trades can lead to significant losses when signals fail
Conclusion
SMT Divergence represents a powerful tool in the Smart Money Concept (SMC) trading methodology, offering traders insight into potential institutional positioning and market reversals. By comparing price action between correlated assets, traders can identify moments when market structure suggests weakness in the prevailing trend, creating high-probability trading opportunities.
When properly identified and used in conjunction with other technical analysis tools like Order Blocks, Fair Value Gaps, and Market Structure analysis, SMT Divergence can significantly enhance trading performance. However, like all trading concepts, it requires practice, patience, and disciplined risk management to implement effectively.
Remember that SMT Divergence is most powerful as part of a comprehensive trading approach rather than a standalone strategy. By integrating it into your existing technical framework and focusing on high-quality setups, you can leverage this institutional trading technique to improve your market analysis and trading results.