The Relative Strength Index (RSI) in Trading
What is the Relative Strength Index (RSI)?
The Relative Strength Index (RSI) is a momentum oscillator developed by J. Welles Wilder Jr. and introduced in his 1978 book, "New Concepts in Technical Trading Systems." It has since become one of the most popular and widely used technical indicators among traders and analysts across all financial markets.
The RSI measures the speed and magnitude of price movements on a scale from 0 to 100. It primarily helps traders identify:
- Overbought conditions (typically above 70)
- Oversold conditions (typically below 30)
- Bullish and bearish divergences between price and momentum
- Trend strength and potential reversal points
The beauty of the RSI lies in its simplicity and versatility. It can be applied to virtually any tradable asset and timeframe, making it an essential tool in many traders' arsenals.
How is the RSI Calculated? The Complete Formula
The RSI calculation involves several steps that measure the relative strength of average gains versus average losses over a specified period (traditionally 14 periods):
Step-by-Step RSI Calculation:
1. Calculate price changes for each period:
For each candle/bar, calculate the difference between the current close and previous close.
2. Separate gains from losses:
Positive changes = Gains (U)
Negative changes = Losses (D) (absolute values)
3. Calculate average gains and losses:
First calculation (initial averaging):
First Average Gain = Sum of Gains over past n periods / n
First Average Loss = Sum of Losses over past n periods / n
Subsequent calculations (smoothed):
Average Gain = [(Previous Average Gain) × (n-1) + Current Gain] / n
Average Loss = [(Previous Average Loss) × (n-1) + Current Loss] / n
Where n is the number of periods (typically 14)
4. Calculate the Relative Strength (RS):
5. Convert RS to the Relative Strength Index (RSI):
Note: This formula ensures that the RSI always fluctuates between 0 and 100.
The default period setting is 14, but traders often adjust this based on their trading style:
- Shorter periods (e.g., 7 or 9) create a more responsive oscillator better suited for short-term trading
- Longer periods (e.g., 21 or 25) create a smoother oscillator better suited for longer-term analysis
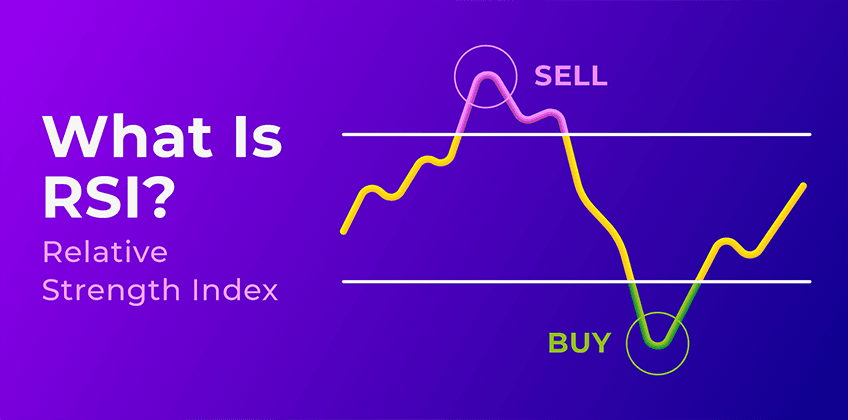
Interpreting the RSI: Overbought and Oversold Conditions
The most common application of the RSI is identifying potential overbought and oversold conditions in the market:
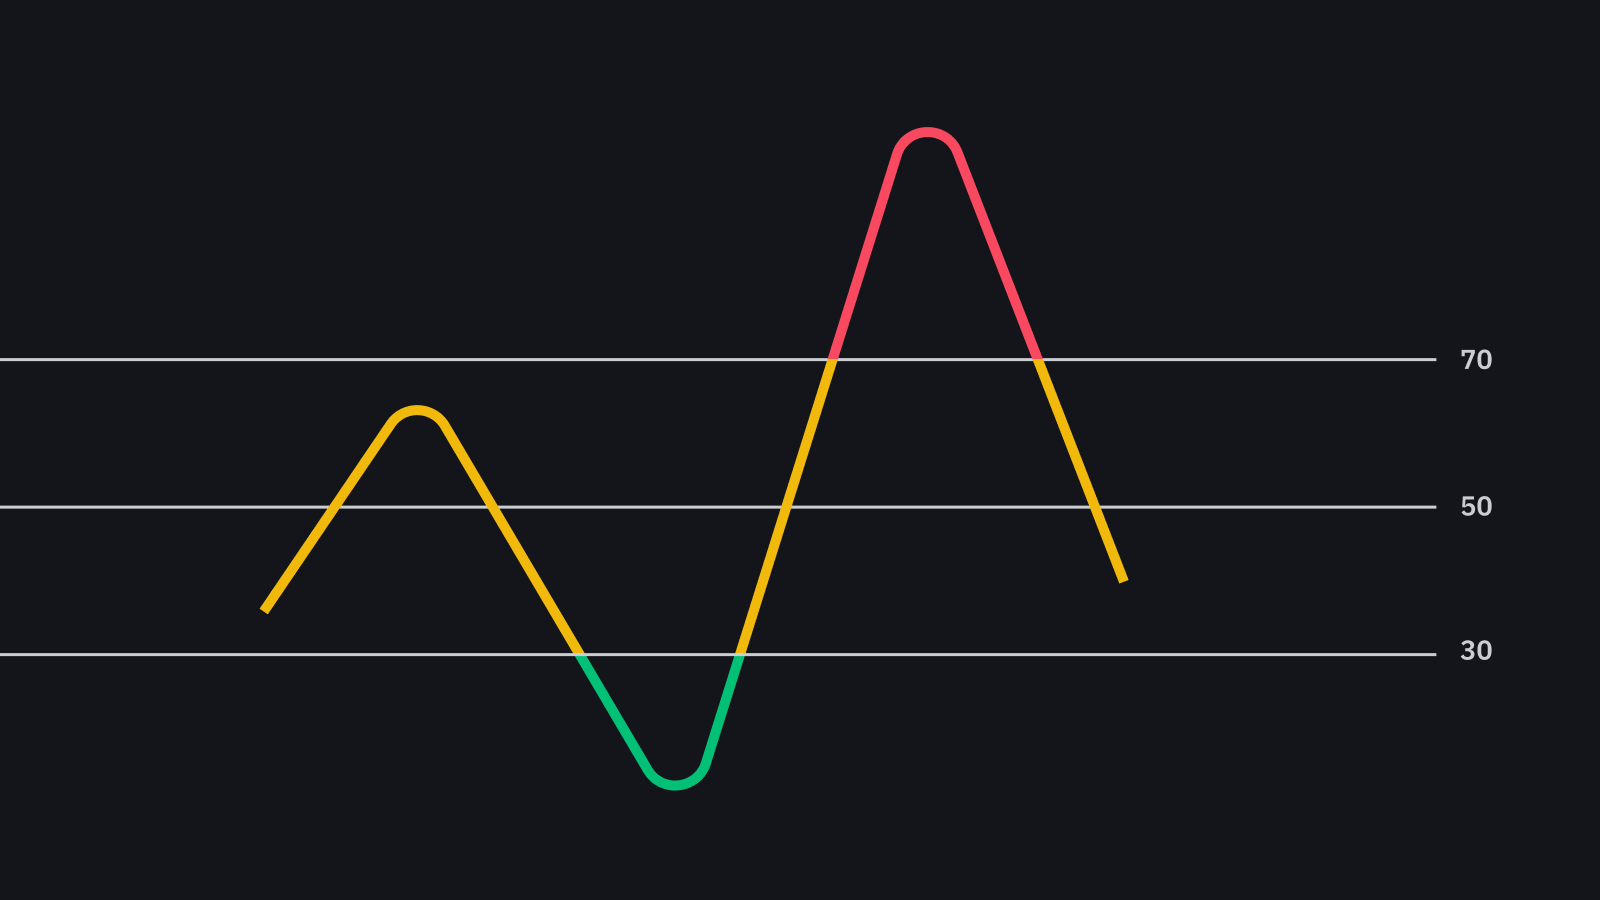
Overbought Conditions (RSI > 70)
When the RSI rises above 70, it suggests that the asset may be overbought or overvalued. This indicates that:
- The asset has been experiencing consistent upward momentum
- Buying pressure may be reaching exhaustion
- A potential price correction or reversal might be imminent
- The market may be becoming temporarily unsustainable
Oversold Conditions (RSI < 30)
When the RSI falls below 30, it suggests that the asset may be oversold or undervalued. This indicates that:
- The asset has been experiencing consistent downward momentum
- Selling pressure may be reaching exhaustion
- A potential price bounce or reversal might be imminent
- The market may have overreacted to negative stimuli
It's important to note that during strong trends, the RSI can remain in overbought or oversold territory for extended periods. In bullish trends, the RSI often fluctuates between 40 and 90, while in bearish trends, it often ranges between 10 and 60.
Advanced RSI Trading Strategies
Beyond simple overbought and oversold readings, the RSI can be used in more sophisticated ways:
Understanding RSI Divergences: Regular and Hidden
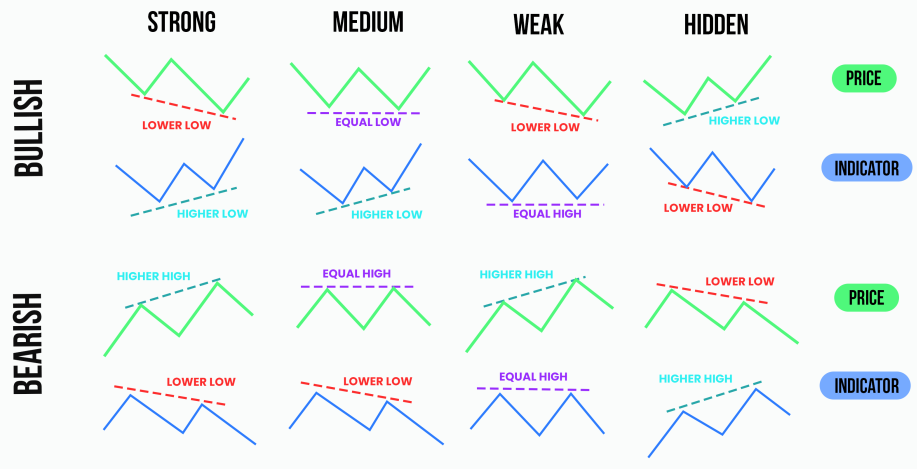
Divergence occurs when the price movement and the RSI movement are heading in opposite directions, signaling a potential trend weakening or reversal. There are two main types of divergences: regular (classic) and hidden.
Regular (Classic) Divergences - Trend Reversal Signals
Bullish Regular Divergence
- Price action: Lower lows (LL)
- RSI action: Higher lows (HL)
- Occurs: During downtrends
- Signal: Potential upward reversal
- Interpretation: Selling momentum is weakening despite lower prices
- Trading action: Look for long entries after confirmation
Bearish Regular Divergence
- Price action: Higher highs (HH)
- RSI action: Lower highs (LH)
- Occurs: During uptrends
- Signal: Potential downward reversal
- Interpretation: Buying momentum is weakening despite higher prices
- Trading action: Look for short entries after confirmation
Regular divergences are powerful signals for potential trend reversals. They work best when formed in overbought or oversold territory and can provide early warning signs before price action confirms the reversal.
Hidden Divergences - Trend Continuation Signals
Bullish Hidden Divergence
- Price action: Higher lows (HL)
- RSI action: Lower lows (LL)
- Occurs: During uptrends (pullbacks)
- Signal: Potential uptrend continuation
- Interpretation: Underlying momentum remains strong despite correction
- Trading action: Look for long entries in the direction of the trend
Bearish Hidden Divergence
- Price action: Lower highs (LH)
- RSI action: Higher highs (HH)
- Occurs: During downtrends (bounces)
- Signal: Potential downtrend continuation
- Interpretation: Underlying weakness remains despite bounce
- Trading action: Look for short entries in the direction of the trend
Hidden divergences are excellent tools for trend traders. While regular divergences signal potential reversals, hidden divergences indicate the trend is likely to continue after a temporary correction. They provide optimal entry points for traders looking to trade in the direction of the existing trend.
Key Points for Trading Divergences:
- Always wait for confirmation before entering a trade based on divergence (candlestick patterns, breakouts, etc.)
- Higher timeframe divergences (daily, weekly) are more significant than lower timeframe ones
- The distance between swing points matters – wider divergences generally have more impact
- Divergences work best when the RSI is in extreme territories (above 70 or below 30)
- Multiple timeframe alignment of divergences significantly increases probability of success
- Regular divergences are stronger signals in ranging markets; hidden divergences work better in trending markets
RSI Centerline Crossovers
The 50 level on the RSI is considered the centerline and can be used to gauge the overall trend:
- When RSI crosses above 50, it suggests strengthening upward momentum
- When RSI crosses below 50, it suggests strengthening downward momentum
Traders often use centerline crossovers as confirmation signals in trend-following strategies or to identify shifts in momentum.
RSI Failure Swings
Failure swings are specific RSI patterns that can signal potential reversals without requiring price confirmation:
Bullish Failure Swing:
- RSI drops below 30 (oversold)
- RSI rallies above this oversold reading
- RSI pulls back but stays above 30
- RSI then breaks above its previous high
- This pattern often precedes an upward price movement
Bearish Failure Swing:
- RSI rises above 70 (overbought)
- RSI drops below this overbought reading
- RSI bounces but fails to reach above 70
- RSI then breaks below its previous low
- This pattern often precedes a downward price movement
RSI Support and Resistance
The RSI can form its own support and resistance levels, trendlines, and chart patterns:
- RSI trendlines can identify momentum shifts before they appear in price
- RSI chart patterns (like double tops or bottoms) can forecast potential price movements
- Historical RSI support and resistance levels can provide future reference points
RSI Modifications and Variations
Over the years, traders and analysts have developed several variations of the RSI to enhance its applicability:
- Stochastic RSI: Applies the Stochastic oscillator formula to RSI values instead of price, creating a more sensitive indicator
- Connors RSI: Incorporates price change, duration of up/down moves, and a ranking of the most recent close versus previous closes
- Dynamic RSI: Uses adaptive period lengths based on market volatility instead of a fixed period
- Cutler's RSI: A simplified version that uses simple moving averages instead of the smoothing technique used in Wilder's original RSI
Common Mistakes When Trading with RSI
Despite its popularity, there are several common pitfalls traders should avoid when using the RSI:
- Ignoring the Trend - RSI signals work best when aligned with the overall trend
- Rigid Level Interpretation - The 30/70 thresholds aren't sacred; some markets naturally have different equilibrium levels
- Premature Entries - Entering solely on an RSI crossing a threshold can lead to catching "falling knives" or missing extended trends
- Isolation Analysis - Using RSI alone without confirmation from other indicators or price action can lead to false signals
- Inappropriate Timeframes - Using the same RSI settings across all timeframes without considering the trading context
Optimizing RSI for Different Market Conditions
While the standard RSI settings are valuable, optimizing them for specific market conditions can enhance performance:
For Trending Markets:
- Use longer periods (21 or more) to reduce false signals
- Adjust overbought/oversold thresholds (80/20 instead of 70/30)
- Focus more on centerline crossovers than overbought/oversold readings
- Look for hidden divergences that confirm the trend
For Ranging Markets:
- Use standard or shorter periods (14 or less) for more responsive signals
- Stick with traditional 70/30 thresholds
- Pay closer attention to overbought/oversold readings for potential reversals
- Look for regular divergences that signal range boundaries
For Volatile Markets:
- Consider longer periods to filter out noise
- Use extreme thresholds (80/20 or even 90/10)
- Combine with volatility indicators like ATR for context
- Wait for RSI to exit overbought/oversold zones before taking action
Conclusion
The Relative Strength Index stands as one of the most versatile and widely used technical indicators in modern trading. Its ability to gauge momentum, identify potential reversals, and provide context to price movements makes it valuable across all markets and timeframes.
While no indicator is perfect or should be used in isolation, the RSI offers significant analytical power when properly understood and applied. By learning to interpret its signals within the context of overall market conditions and combining it with complementary analysis techniques, traders can enhance their decision-making process and potentially improve their trading results.
Remember that mastering the RSI, like any trading tool, requires practice, patience, and continuous refinement of your approach based on market experience and results.