Fibonacci Retracement Levels in Trading
The Origins of Fibonacci Numbers
Before we dive into how Fibonacci retracement levels are used in trading, let's understand where these numbers come from. The Fibonacci sequence was first introduced to the Western world by Italian mathematician Leonardo of Pisa, known as Fibonacci, in his book "Liber Abaci" in 1202.
The sequence begins with 0 and 1, and each subsequent number is the sum of the two preceding ones: 0, 1, 1, 2, 3, 5, 8, 13, 21, 34, 55, 89, 144...
What makes this sequence remarkable is that as it progresses, the ratio of any number to the next one in the sequence approaches 0.618 (or its inverse, 1.618). This ratio, known as the Golden Ratio or Phi (φ), appears repeatedly in nature, art, architecture, and remarkably, financial markets.
From Mathematics to Market Analysis
The application of Fibonacci numbers to financial markets began in the early 20th century when traders observed that markets often retrace a predictable portion of a move before continuing in the original direction. These retracement levels frequently corresponded with key Fibonacci ratios.
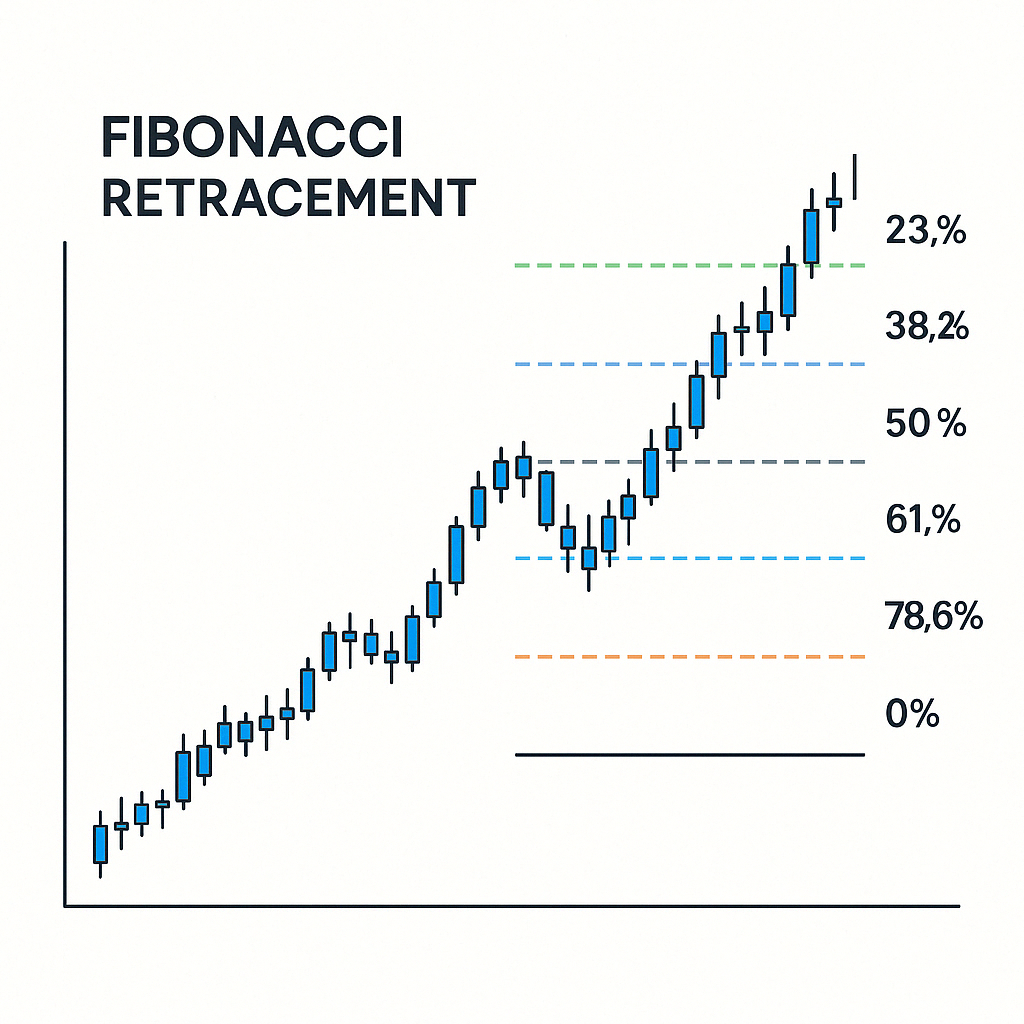
The most commonly used Fibonacci retracement levels in trading are:
- 23.6% - Derived from the ratio of any Fibonacci number divided by the number three places higher
- 38.2% - Result of dividing any Fibonacci number by the number two places higher
- 50% - Not a Fibonacci ratio but included due to its significance in Dow Theory and overall market behavior
- 61.8% - The Golden Ratio, found by dividing any Fibonacci number by the next higher number
- 78.6% - The square root of 0.618 (the Golden Ratio)
What Are Fibonacci Retracement Levels?
Fibonacci retracement levels are horizontal lines on a price chart that indicate potential support and resistance areas where a price trend may reverse or pause. These levels are created by first identifying a significant price move (either up or down), then drawing the retracement levels at the key Fibonacci percentages of that move.
These levels work because they represent psychological price points where many traders make decisions, creating a self-fulfilling prophecy effect. When enough market participants use these levels, they can indeed become significant areas of support and resistance.
The Mathematical Harmony in Markets
The remarkable aspect of Fibonacci retracement levels is how consistently they appear to influence market behavior across different asset classes, timeframes, and market conditions. This consistency has led many to believe that markets, as a collective expression of human psychology, follow natural mathematical proportions found throughout the universe.
The Golden Ratio (1.618) and its inverse (0.618) appear in countless natural formations:
- The spiral arrangement of leaves around a plant stem
- The branching of trees
- The spiral of shells
- The arrangement of seeds in a sunflower
- The proportions of the human body
This same ratio now guides traders in finding harmony and predictable patterns in seemingly chaotic market movements.
How to Draw Fibonacci Retracement Levels
Drawing Fibonacci retracement levels correctly is essential for their effectiveness:
For an Uptrend (Finding Support)
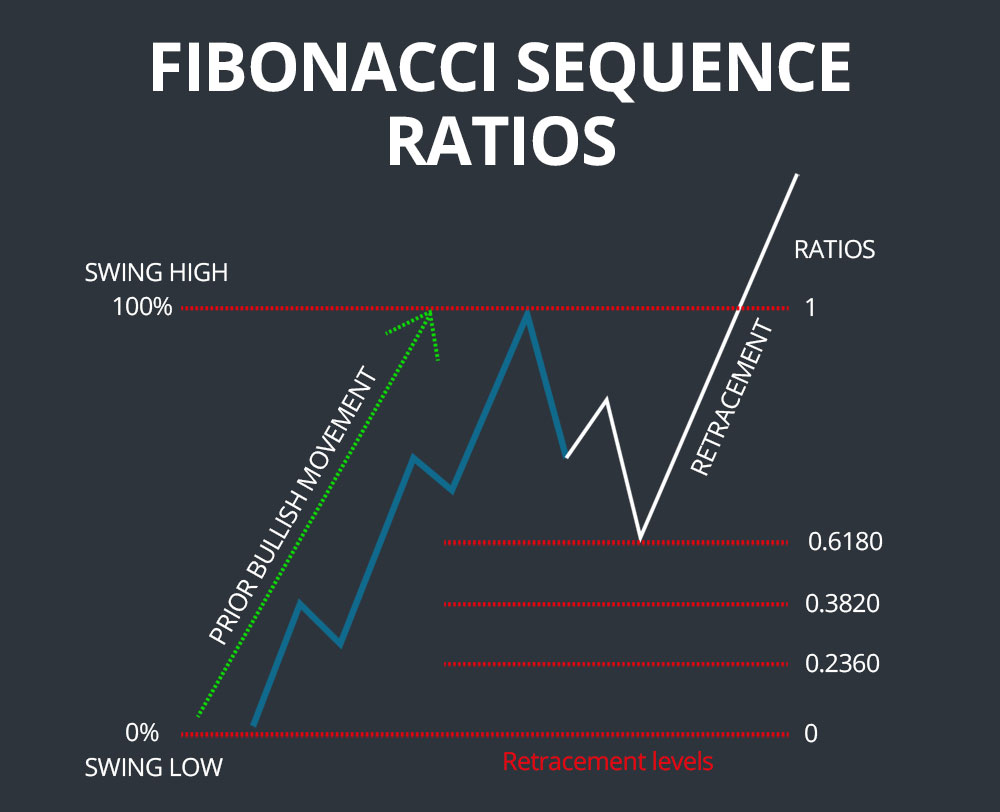
- Identify a clear upward move (swing low to swing high)
- Draw the Fibonacci tool from the swing low (start of the move) to the swing high (end of the move)
- The tool will automatically create horizontal lines at key retracement levels (23.6%, 38.2%, 50%, 61.8%, 78.6%)
- These levels now act as potential support areas during pullbacks
For a Downtrend (Finding Resistance)
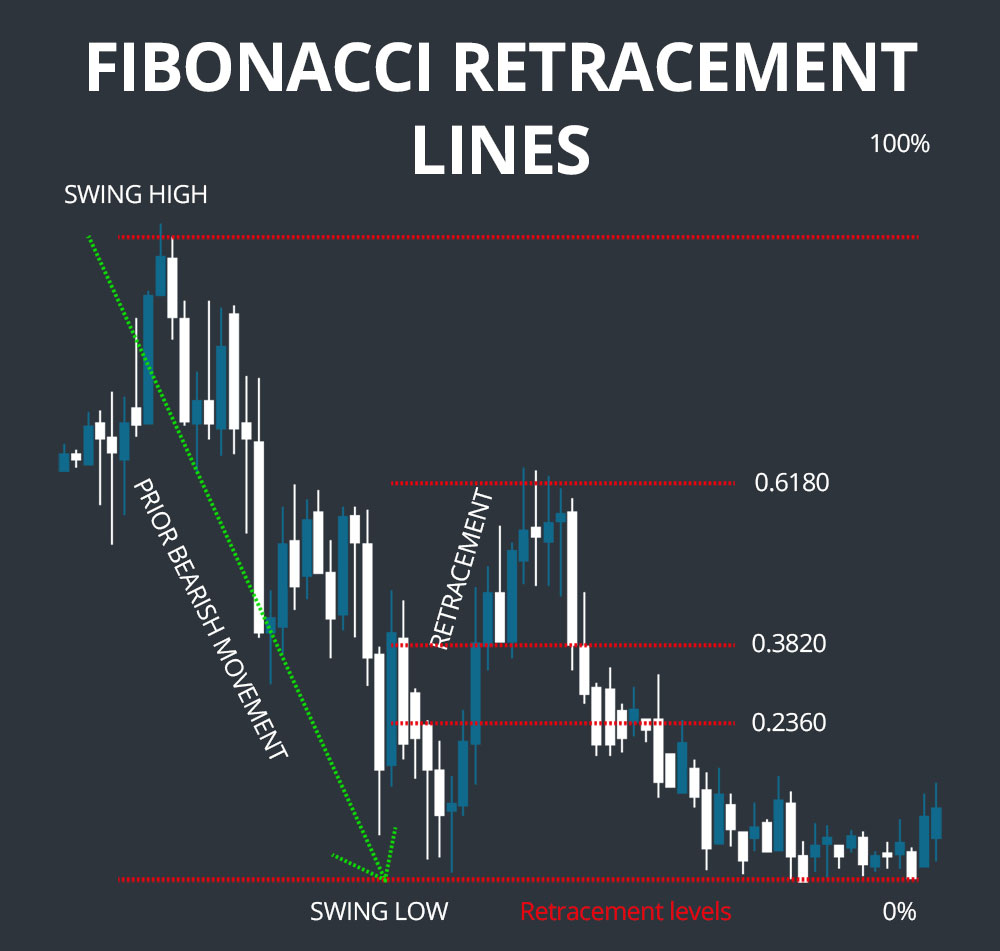
- Identify a clear downward move (swing high to swing low)
- Draw the Fibonacci tool from the swing high (start of the move) to the swing low (end of the move)
- The tool will automatically create horizontal lines at key retracement levels
- These levels now act as potential resistance areas during bounces
Why Do Fibonacci Retracement Levels Work?
The effectiveness of Fibonacci retracement levels can be attributed to several factors:
- Psychological Self-Fulfillment - When enough traders watch and act on these levels, they become self-fulfilling
- Natural Market Rhythms - Markets may naturally follow the same mathematical relationships found in nature
- Institutional Usage - Large financial institutions incorporate these levels into their algorithmic trading systems
- Confluence with Other Techniques - Fibonacci levels often align with other technical analysis tools, strengthening their significance
Advanced Fibonacci Trading Strategies
1. The Fibonacci Confluence Method
Professional traders look for confluence zones where multiple Fibonacci levels from different swing points align. These areas often provide the strongest support and resistance levels.
How to Find Confluence Zones:
- Identify multiple significant swing points on your chart
- Draw Fibonacci retracements from each swing high to swing low
- Look for areas where 2-3 different Fibonacci levels cluster together
- These confluence zones often provide high-probability reversal points
2. Fibonacci Extensions for Profit Targets
While retracements help identify entry points, Fibonacci extensions project potential profit targets beyond the original move:
- 127.2% Extension - Most common first target for trend continuation
- 161.8% Extension - Golden ratio extension, often a strong resistance/support
- 261.8% Extension - Extreme target for very strong trends
Practical Extension Strategy:
After price retraces to a Fibonacci level and resumes the trend:
- Draw extension levels from the original swing point
- Use 127.2% as your first profit target
- Move stops to breakeven when first target is hit
- Hold remaining position for 161.8% extension
3. The 50% Rule in Practice
Although not a true Fibonacci ratio, the 50% retracement level deserves special attention. It represents the psychological midpoint and often acts as a decisive level:
- Shallow retracements (23.6-38.2%) - Indicate very strong trends
- 50% retracement - Critical decision point for trend continuation vs. reversal
- Deep retracements (61.8-78.6%) - Suggest weakening trend, prepare for potential reversal
Real-World Trading Examples
Example 1: EUR/USD Daily Chart Strategy
Let's examine a practical Fibonacci trading scenario on EUR/USD:
- Setup: EUR/USD rallies from 1.0500 to 1.1200 (700 pips move)
- Retracement: Price pulls back and finds support at 61.8% level (1.0767)
- Entry: Enter long position at 61.8% retracement with confirmation candle
- Stop Loss: Place below 78.6% level at 1.0650 (117 pips risk)
- Target 1: 127.2% extension at 1.1390 (623 pips reward)
- Risk:Reward: 5.3:1 ratio
Example 2: Bitcoin Weekly Reversal
Fibonacci levels work exceptionally well on cryptocurrency charts due to their high volatility:
- Major Move: Bitcoin drops from $65,000 to $15,000
- Golden Ratio: 61.8% retracement targets $45,900
- Strategy: Watch for rejection at this level for short entry
- Confluence: 61.8% level aligns with previous support-turned-resistance
- Execution: Enter short on bearish confirmation with tight risk management
Advanced Fibonacci Tools
Fibonacci Fans and Time Zones
Beyond basic retracements, sophisticated traders use additional Fibonacci-based tools:
- Fibonacci Fans - Diagonal trend lines at Fibonacci angles for dynamic support/resistance
- Fibonacci Arcs - Curved lines that combine price and time analysis
- Fibonacci Time Zones - Vertical lines to predict timing of reversals
- Fibonacci Spirals - Advanced tool for identifying turning points in both price and time
Pro Tip: Fibonacci Time Analysis
Fibonacci time zones can predict when a reversal might occur. Count the number of periods (bars) in a significant move, then apply Fibonacci ratios (1, 1, 2, 3, 5, 8, 13...) to project future reversal dates.
Risk Management with Fibonacci Levels
Proper risk management is crucial when trading Fibonacci retracements. Here's a professional approach:
Position Sizing Formula
Calculate your position size based on the distance to your stop loss:
Example: Risk 2% of $10,000 account on EUR/USD trade with 50-pip stop = $200 ÷ $5 per pip = 40,000 units
Multi-Level Entry Strategy
Instead of entering all at once, scale into positions at multiple Fibonacci levels:
- 25% position at 38.2% - Early entry for strong trends
- 50% position at 50% - Core position at psychological level
- 25% position at 61.8% - Final entry at golden ratio
This approach reduces risk while ensuring you don't miss the move if price doesn't reach the deeper retracement levels.
Market-Specific Fibonacci Applications
Forex Markets
- EUR/USD, GBP/USD: 61.8% level particularly reliable during London session
- USD/JPY: Often respects 50% retracement due to Bank of Japan intervention levels
- Commodity currencies (AUD, NZD): 78.6% level frequently tested during reversals
Cryptocurrency Markets
- Bitcoin: 61.8% retracements often coincide with major psychological levels
- Altcoins: More volatile, focus on 38.2% and 61.8% levels for entries
- Weekly timeframes: Most reliable for crypto due to 24/7 trading
Stock Markets
- Individual stocks: Combine with earnings dates and support/resistance
- Indices (S&P 500, NASDAQ): 50% retracement often marks major turning points
- Sector ETFs: Use monthly charts for long-term investment entries
Common Mistakes and How to Avoid Them
Critical Mistakes to Avoid:
- Forcing swing points: Don't manipulate levels to fit your bias
- Ignoring overall trend: Fibonacci works best with the trend, not against it
- Using wrong timeframes: Match your timeframe to your trading style
- No confirmation: Always wait for price action confirmation at Fibonacci levels
- Overleveraging: Don't risk more than 2% per trade, regardless of how "perfect" the setup looks
Conclusion: Building a Complete Fibonacci Trading System
Fibonacci retracement levels are not just mathematical curiosities—they represent actionable trading opportunities when applied with proper risk management and market context. The key to success lies not in the levels themselves, but in how you integrate them into a complete trading system.
Your Fibonacci Trading Checklist:
- ✓ Identify clear trend direction on higher timeframe
- ✓ Mark significant swing points objectively
- ✓ Look for confluence with other technical levels
- ✓ Wait for price action confirmation at Fibonacci levels
- ✓ Calculate proper position size based on stop distance
- ✓ Set realistic profit targets using extensions
- ✓ Keep detailed records for continuous improvement
Remember that markets are constantly evolving, and what works today may need adjustment tomorrow. Use Fibonacci retracements as part of a diversified analytical approach, always prioritizing capital preservation over profit maximization. With practice and proper application, these mathematical relationships can become a valuable component of your trading arsenal.