Bollinger Bands: The Complete Guide to Trading with Volatility
What Are Bollinger Bands?
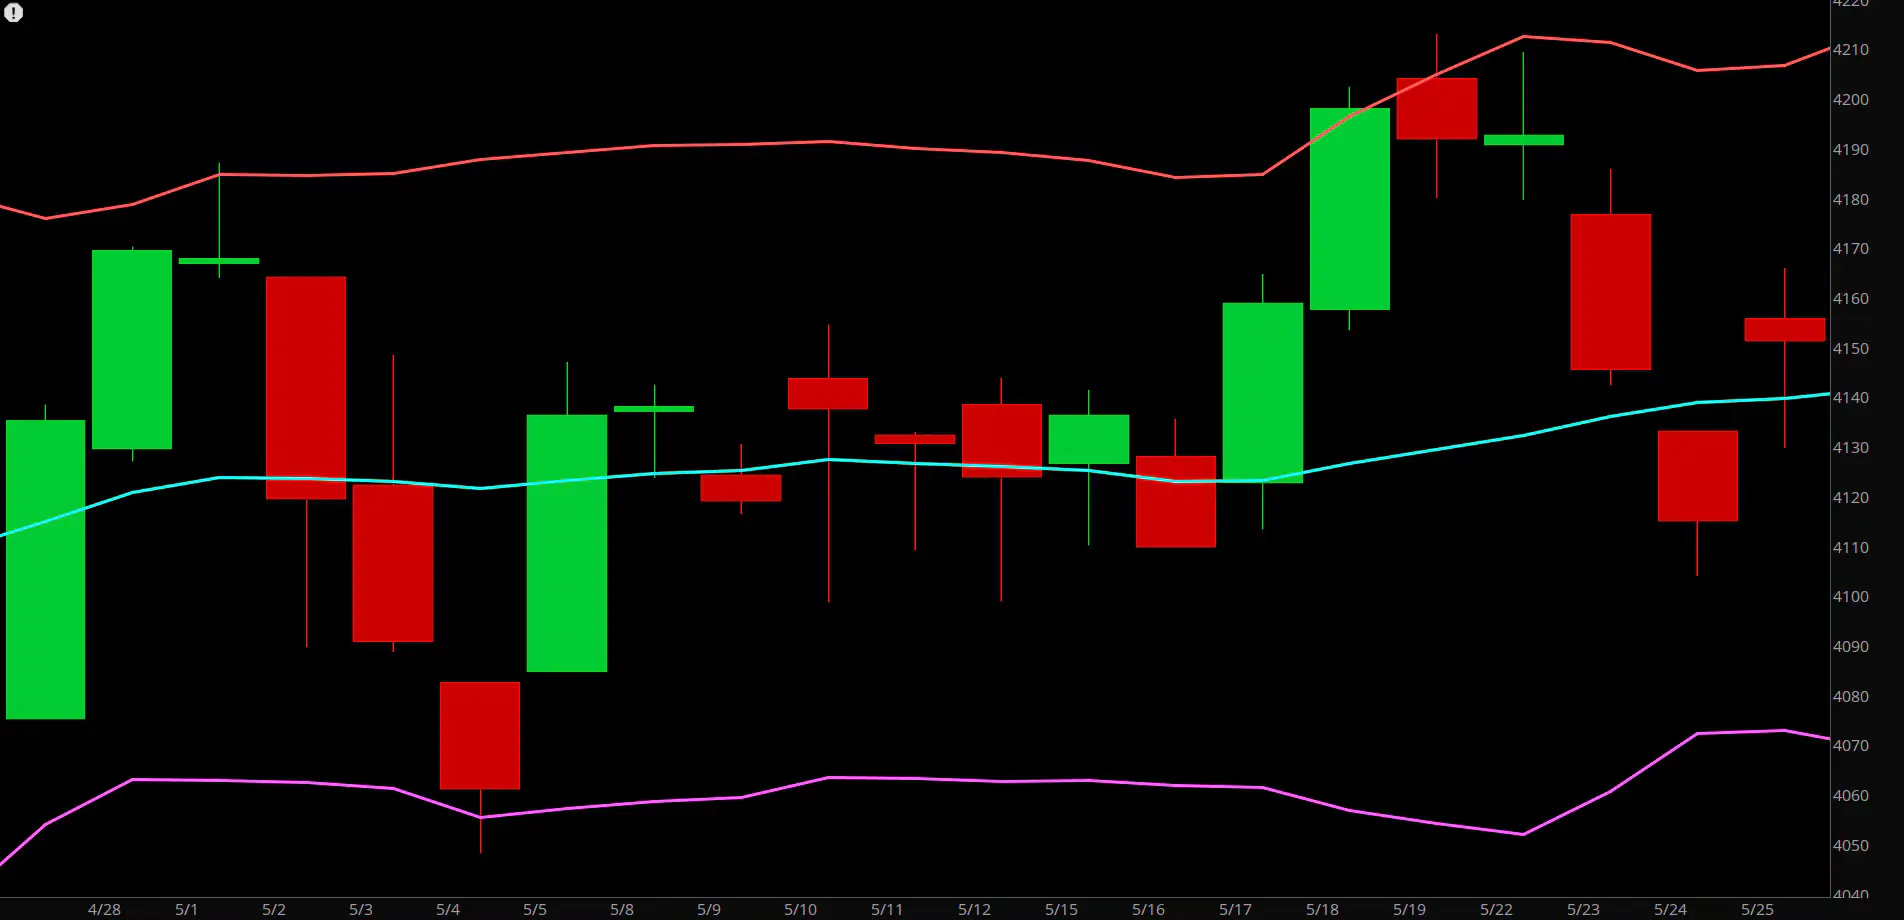
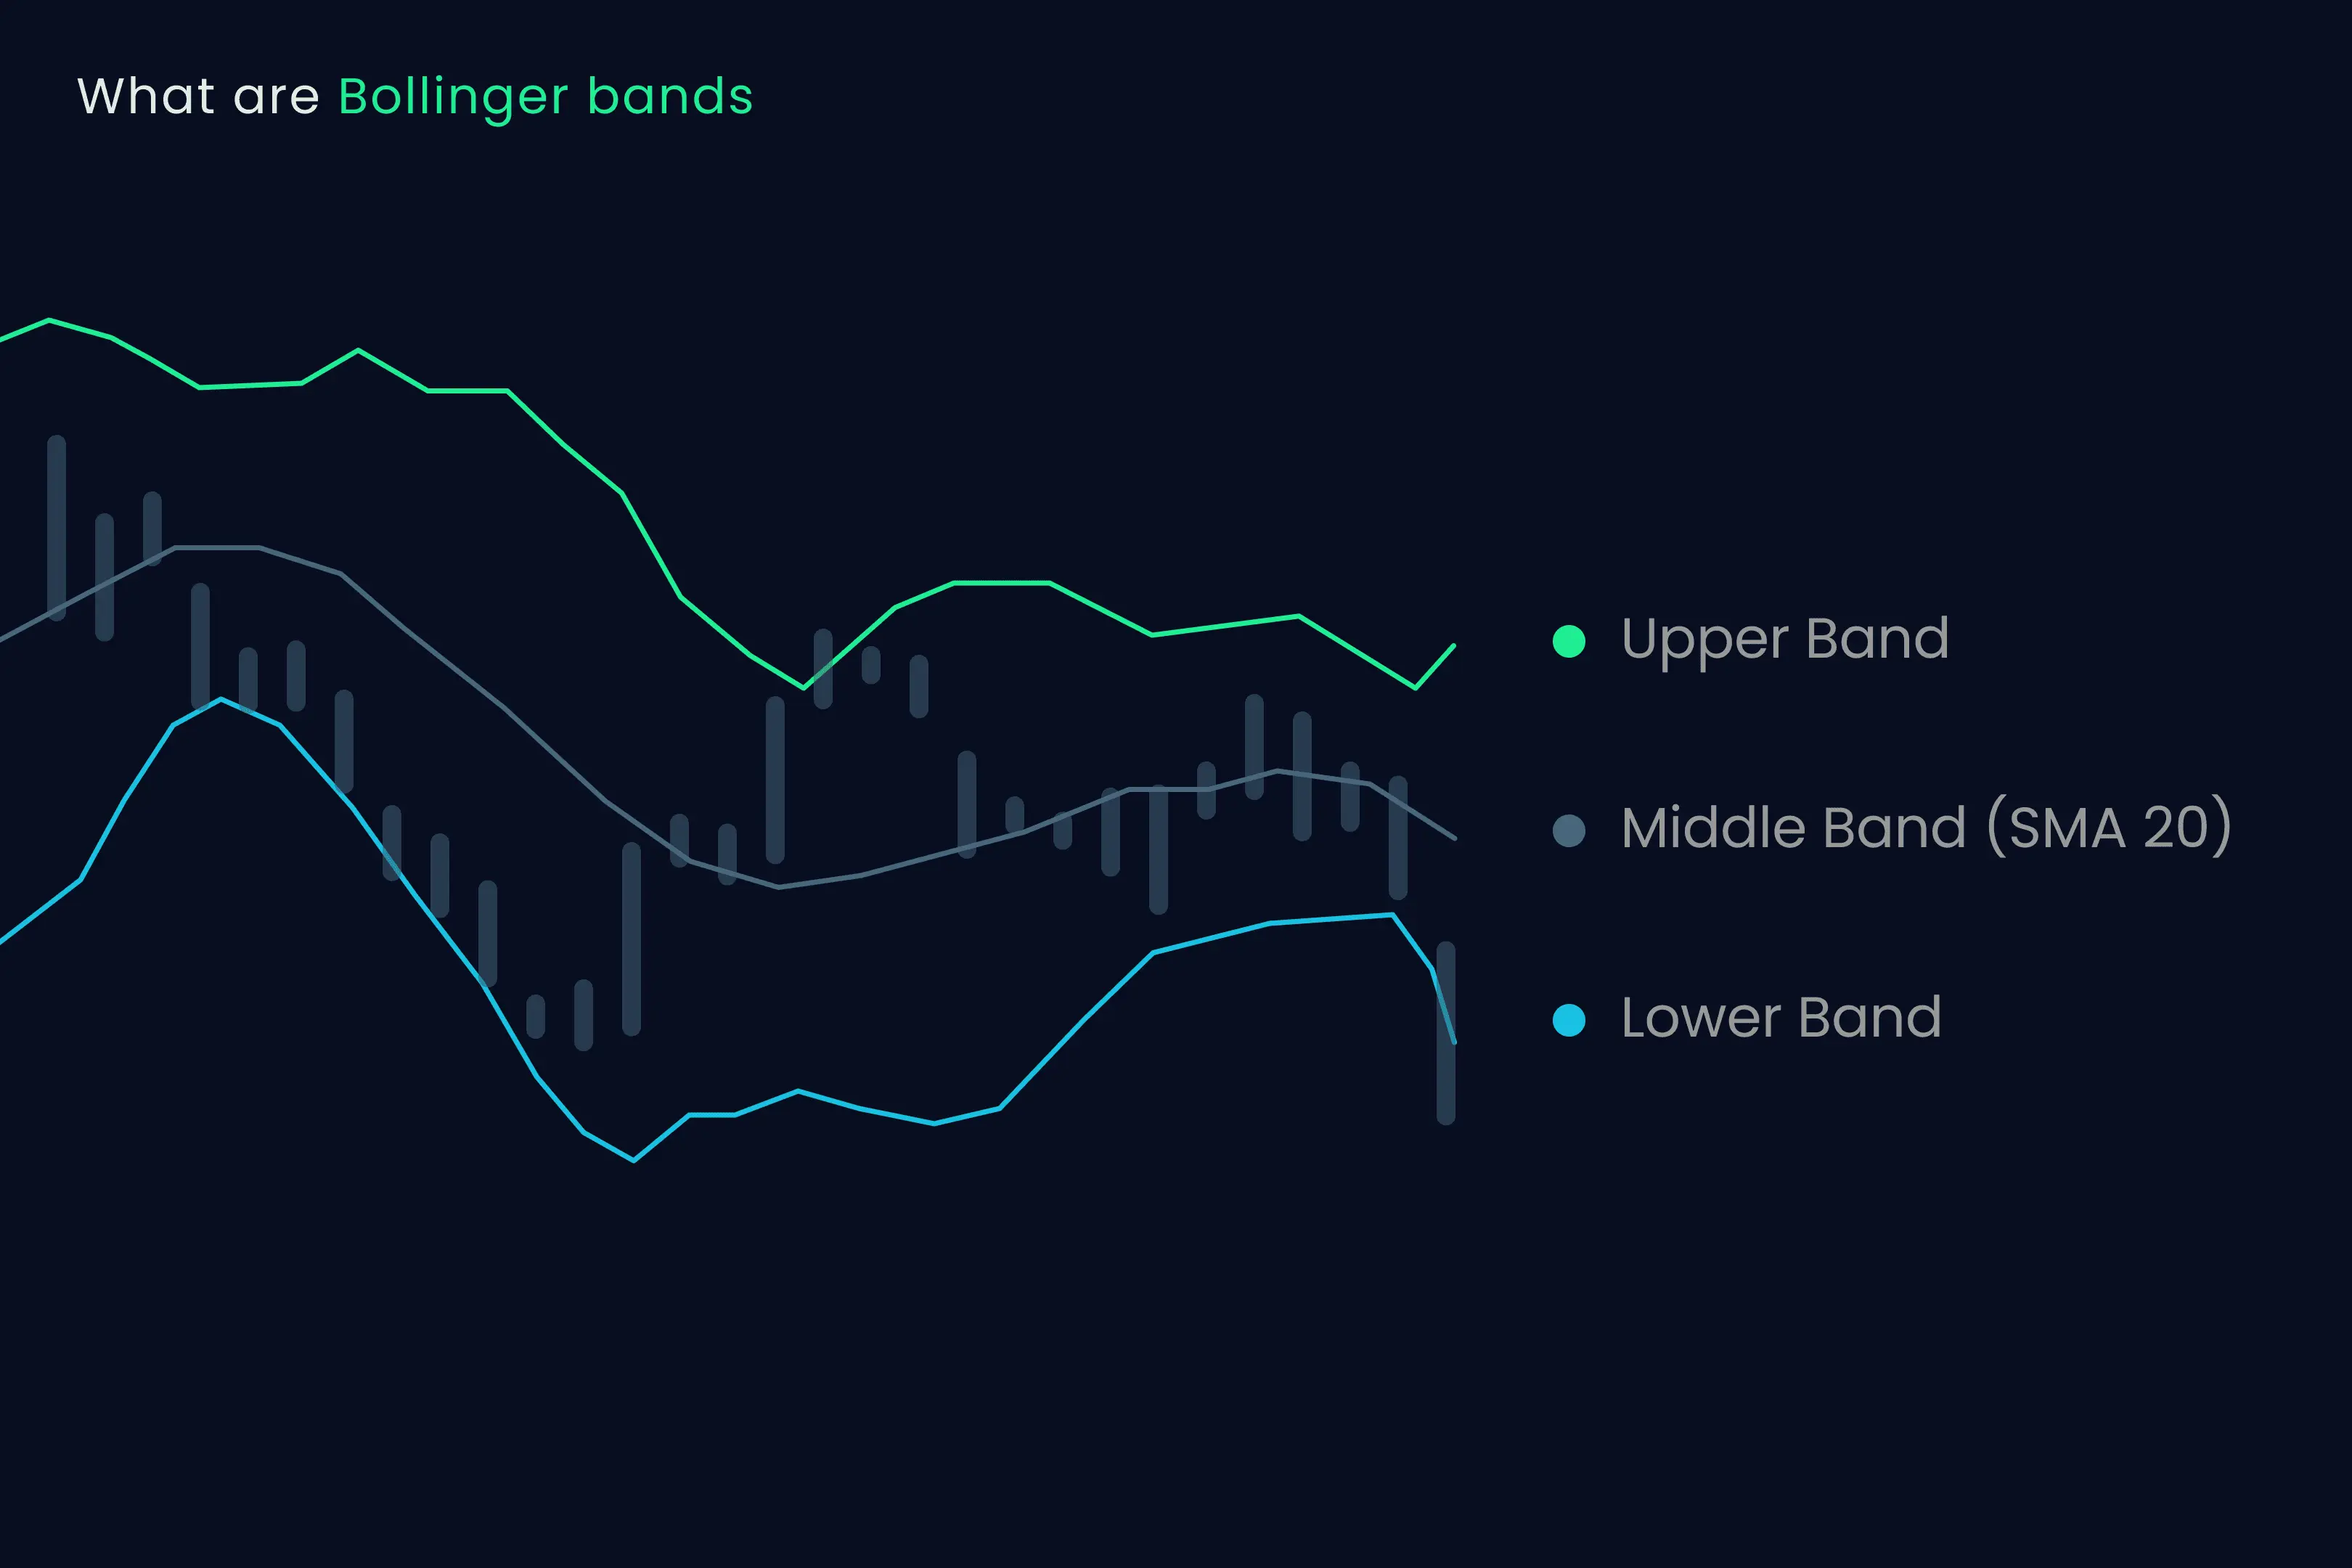
Bollinger Bands are one of the most popular and versatile technical analysis tools, developed by John Bollinger in the early 1980s. They consist of three lines plotted on a price chart:
- Middle Band: Usually a 20-period Simple Moving Average (SMA)
- Upper Band: The middle band plus two standard deviations
- Lower Band: The middle band minus two standard deviations
The primary purpose of Bollinger Bands is to provide a relative definition of high and low prices. By measuring price volatility, they adjust automatically to market conditions, widening during volatile markets and contracting during less volatile periods. This dynamic nature makes them useful across different markets and timeframes.
The Formula: How Bollinger Bands Are Calculated
Understanding the calculation helps traders grasp what Bollinger Bands are actually measuring. The formula consists of three components:
Middle Band (SMA):
SMA = (P₁ + P₂ + ... + Pₙ) / n
Where P = price (typically closing price) and n = number of periods (typically 20)
Standard Deviation (SD):
SD = √[ ∑(Pᵢ - SMA)² / n ]
Where Pᵢ is the price for period i
Upper and Lower Bands:
Upper Band = SMA + (SD × m)
Lower Band = SMA - (SD × m)
Where m = multiplier (typically 2)
The standard deviation is a statistical measure of market volatility. By incorporating it into the bands, Bollinger Bands automatically adjust to volatility changes. The multiplier (usually 2) determines how sensitive the bands are to price movements.
Interpreting Bollinger Bands
1. Volatility Measurement
The width of the bands represents market volatility:
- Widening bands: Indicate increasing volatility
- Narrowing bands: Indicate decreasing volatility
- Bollinger Squeeze: Occurs when volatility reaches a low point (bands narrow significantly), often preceding a major price movement
2. Overbought and Oversold Conditions
Price interactions with the bands can suggest potential reversal points:
- Price touching/exceeding upper band: Potentially overbought condition
- Price touching/exceeding lower band: Potentially oversold condition
Important note: Price touching a band alone is NOT a buy or sell signal. Additional confirmation is typically required.
3. Trend Identification
Bands can help identify and confirm trends:
- Price consistently touching upper band: Suggests strong uptrend
- Price consistently touching lower band: Suggests strong downtrend
- Price moving between bands: May indicate ranging market
4. Mean Reversion Tendencies
Bollinger Bands operate on the principle that prices tend to return to the mean (middle band):
- When price deviates far from the middle band, it often tends to move back toward it
- This tendency is strongest in ranging markets and weaker in strongly trending markets
Common Bollinger Band Trading Strategies
1. Bollinger Band Squeeze
This strategy capitalizes on low volatility periods that often precede significant price moves:
- Identify when the bands narrow significantly (the squeeze)
- Wait for a breakout - price moving outside the bands with increased volume
- Trade in the direction of the breakout
The squeeze occurs when volatility falls to a very low level, as shown by the bands narrowing. When price later breaks out from this low volatility state, it often signals the start of a new trend.
2. Mean Reversion (Bollinger Bounce)
This strategy works well in ranging markets where price tends to bounce between the bands:
- Wait for price to touch or exceed the upper or lower band
- Look for price to start reversing (using candlestick patterns or momentum indicators)
- Enter a counter-trend trade anticipating price will move back toward the middle band
This strategy works best in sideways markets without strong trends. Additional confirmation from indicators like RSI can improve success rates.
3. Trend Continuation (Walking the Bands)
In strong trends, price can "walk the bands" by consistently touching the upper or lower band:
- Identify a strong trend (price consistently near one band)
- Enter trades in the trend direction after slight pullbacks toward the middle band
- Use the middle band as a potential trailing stop level
This strategy acknowledges that, in strong trends, overbought/oversold conditions can persist as price continues to move in the trend direction.
4. W-Bottoms and M-Tops
This pattern-recognition strategy looks for specific formations:
- W-Bottom: Price touches the lower band twice, forming a W pattern, with the second touch having a higher low and not breaching the lower band
- M-Top: Price touches the upper band twice, forming an M pattern, with the second touch having a lower high and not breaching the upper band
These patterns often indicate potential reversals and can provide high-probability trading opportunities when combined with volume analysis.
Advanced Bollinger Band Concepts
Bollinger Bandwidth
Bollinger Bandwidth measures the width of the bands relative to the middle band:
Bandwidth = (Upper Band - Lower Band) / Middle Band
This indicator helps identify squeezes more precisely and can be used to compare volatility across different markets and timeframes.
%B (Percent Bandwidth)
%B shows where price is in relation to the bands:
%B = (Price - Lower Band) / (Upper Band - Lower Band)
This indicator helps quantify price position:
- %B = 1: Price is at the upper band
- %B = 0.5: Price is at the middle band
- %B = 0: Price is at the lower band
- %B > 1: Price is above the upper band
- %B < 0: Price is below the lower band
%B can be used to identify divergences and extreme conditions more precisely than visual inspection alone.
Multiple Timeframe Analysis
Using Bollinger Bands across multiple timeframes can provide more comprehensive insights:
- Higher timeframe: Identify the overall trend and major support/resistance
- Lower timeframe: Find specific entry and exit points
This approach helps avoid counter-trend trades in strongly trending markets and can improve timing on entries and exits.
Customizing Bollinger Bands
While the standard settings (20-period SMA, 2 standard deviations) work well in many situations, adjusting these parameters can optimize the indicator for specific markets and trading styles:
Period Length Adjustments
- Shorter periods (10-15): More responsive, ideal for shorter timeframes and more active trading
- Longer periods (50+): Smoother, better for longer-term trend analysis and position trading
Standard Deviation Multiplier
- Lower multiplier (1.5): Bands are closer to price, generating more signals but with higher false positive rate
- Higher multiplier (2.5-3): Bands are further from price, generating fewer but potentially more reliable signals
Moving Average Type
While SMA is standard, other moving averages can be used:
- Exponential Moving Average (EMA): More responsive to recent price changes
- Weighted Moving Average (WMA): Balances responsiveness and smoothness
Advantages and Limitations
Advantages
- Adaptive to Market Conditions: Automatically adjusts to volatility changes
- Versatility: Works across different markets and timeframes
- Multiple Applications: Can be used for volatility assessment, trend identification, and reversal signals
- Visual Clarity: Provides clear visual representation of price relative to its recent range
Limitations
- Lagging Nature: As with all indicators based on moving averages, there is inherent lag
- False Signals: Can generate false signals, especially in choppy markets
- Not Predictive: Bands describe current conditions; they don't predict future price movements with certainty
- Need for Confirmation: Most effective when used with other technical analysis tools
Bollinger Bands in Different Market Conditions
Trending Markets
In trending markets, price often moves along one of the bands:
- Uptrends: Price tends to stay between the middle and upper band
- Downtrends: Price tends to stay between the middle and lower band
- The middle band may act as dynamic support/resistance
In these conditions, mean reversion strategies may be less effective, while trend following approaches work better.
Ranging Markets
In sideways or ranging markets, price typically oscillates between the bands:
- Upper and lower bands act as resistance and support
- Price regularly returns to the middle band
- Bollinger Bounces are more reliable
Mean reversion strategies work well in these conditions, while trend following approaches may lead to more false signals.
High Volatility Markets
During periods of high volatility (wide bands):
- Price movements can be extreme and erratic
- Consider wider stop losses or reduced position sizes
- Look for volatility to stabilize before applying standard strategies
Practical Tips for Trading with Bollinger Bands
- Never use Bollinger Bands in isolation: Combine with volume analysis, support/resistance levels, or other indicators like RSI or MACD
- Understand market context: Adjust your strategy based on whether the market is trending or ranging
- Be patient with squeezes: Wait for confirmation of the breakout direction rather than trying to predict it
- Use appropriate time frames: Higher time frames provide more reliable signals, while lower time frames can help with precise entries
- Manage risk properly: Use appropriate stop losses, especially when trading reversals or breakouts
Conclusion: Mastering Bollinger Bands
Bollinger Bands provide traders with valuable insights into price volatility, potential reversals, and trend strength. Their adaptive nature makes them applicable across various markets and timeframes, while their visual clarity makes them accessible to traders of all experience levels.
By understanding the underlying principles and applying appropriate strategies for different market conditions, traders can effectively incorporate Bollinger Bands into their technical analysis toolkit. Remember that like all technical indicators, they work best when combined with other forms of analysis and sound risk management practices.
With practice and experience, you'll develop an intuitive understanding of how to interpret and trade with Bollinger Bands, making them a powerful component of your trading strategy.
Key Takeaways
- Bollinger Bands consist of a middle band (typically 20-period SMA) and upper/lower bands set at ±2 standard deviations
- They adapt automatically to market volatility, widening during volatile periods and narrowing during calm periods
- A Bollinger Squeeze (narrow bands) often precedes significant price movements
- Price touching the bands alone is not a buy/sell signal; look for confirmation
- Best results come from combining Bollinger Bands with other technical analysis tools and adapting strategies to current market conditions