Money Flow Index (MFI): The Complete Guide to Volume-Weighted Momentum

What Is the Money Flow Index (MFI)?
The Money Flow Index (MFI) is a momentum oscillator that measures the flow of money into and out of a security over a specified period. Developed by Gene Quong and Avrum Soudack, it is often referred to as a volume-weighted Relative Strength Index (RSI) because it incorporates both price and volume data.
Unlike many momentum indicators that rely solely on price, MFI adds the crucial element of volume to provide a more comprehensive view of market dynamics. This makes it particularly valuable for identifying potential reversals, as significant price movements accompanied by high volume tend to be more reliable signals than those occurring on low volume.
The Formula: How Money Flow Index Is Calculated
Understanding how MFI is calculated helps traders interpret its signals more effectively. The calculation process involves several steps:
Step 1: Calculate the Typical Price (TP)
TP = (High + Low + Close) / 3
Step 2: Calculate Raw Money Flow (RMF)
Raw Money Flow = TP × Volume
Step 3: Determine Positive and Negative Money Flow
If TP(current) > TP(previous) → Positive Money Flow
If TP(current) < TP(previous) → Negative Money Flow
Note: If the typical price is unchanged, it's typically excluded
Step 4: Calculate Money Flow Ratio
Money Flow Ratio = (n-period Positive Money Flow) / (n-period Negative Money Flow)
Where n is typically 14 periods
Step 5: Calculate Money Flow Index
MFI = 100 - (100 / (1 + Money Flow Ratio))
The resulting MFI value ranges from 0 to 100, similar to other oscillators like RSI. This formula effectively combines price movement dynamics with volume confirmation, providing a more robust signal than price-only indicators.
Interpreting Money Flow Index
1. Overbought and Oversold Conditions
Like many oscillators, MFI identifies potential reversal zones:
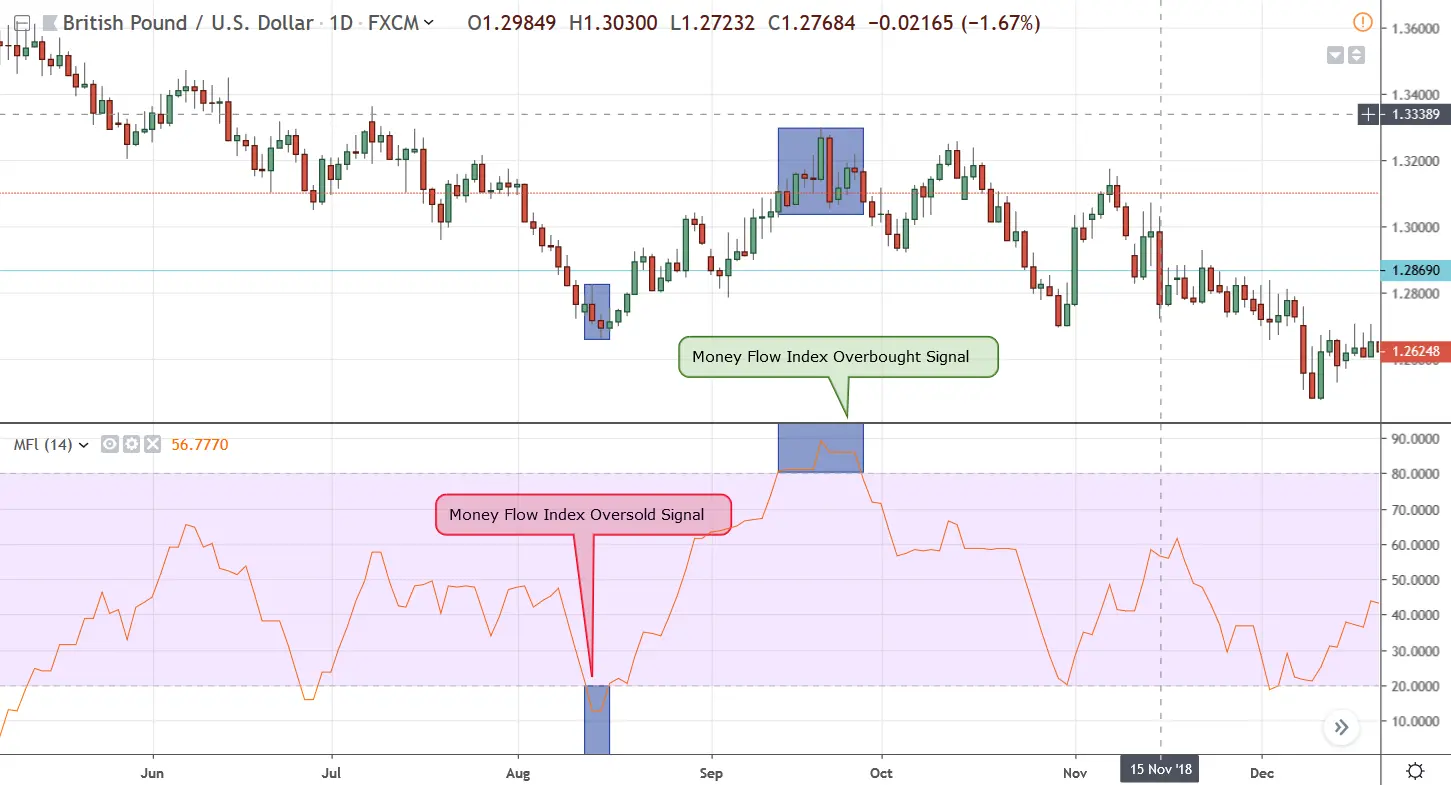
- Overbought: MFI readings above 80 indicate potentially overbought conditions, suggesting a possible bearish reversal
- Oversold: MFI readings below 20 indicate potentially oversold conditions, suggesting a possible bullish reversal
These thresholds can be adjusted based on market conditions or individual security characteristics. Some traders use 90 and 10 for more extreme signals, while others might use 70 and 30 for more conservative approaches.
2. Divergences
Divergences between price action and MFI can signal potential reversals:
- Bullish Divergence: When price makes a lower low but MFI makes a higher low, indicating potential upward reversal
- Bearish Divergence: When price makes a higher high but MFI makes a lower high, indicating potential downward reversal
Divergences are particularly powerful when they occur in overbought or oversold territory and are often among the most reliable MFI signals.
3. Centerline Crossovers
The 50 level represents a neutral boundary between bullish and bearish territory:
- Bullish Signal: MFI crosses above 50, suggesting increasing positive money flow
- Bearish Signal: MFI crosses below 50, suggesting increasing negative money flow
These crossovers can be used to confirm trend direction or identify potential shifts in momentum.
4. Failure Swings
Failure swings occur when MFI reverses direction without reaching a new extreme:
- Bullish Failure Swing: MFI drops below 20, rises, pulls back without dropping below 20 again, then breaks above its previous high
- Bearish Failure Swing: MFI rises above 80, drops, bounces without rising above 80 again, then breaks below its previous low
These patterns can signal strong reversal potential, especially when they form after extended trends.
Money Flow Index Trading Strategies
1. Overbought/Oversold Reversal Strategy
This basic strategy capitalizes on extreme MFI readings:
- Wait for MFI to reach overbought (>80) or oversold (<20) territory
- Look for price to show signs of reversal (candlestick patterns, support/resistance)
- Enter a counter-trend position when MFI begins to move away from the extreme reading
- Set stop loss beyond the recent swing high/low
- Target the next significant support/resistance level or use a trailing stop
This strategy works best in ranging markets and should be used with caution during strong trends.
2. Divergence Trading Strategy
This more advanced strategy looks for disconnects between price and money flow:
- Identify when price makes a new high/low but MFI fails to confirm (divergence)
- Wait for additional confirmation (candlestick patterns, trend line breaks)
- Enter in the direction of the expected reversal
- Set a stop loss beyond the divergence high/low
- Target previous support/resistance levels
Divergences can provide powerful signals, especially when they form after extended trends and in extreme overbought/oversold conditions.
3. Trend Confirmation Strategy
This approach uses MFI to confirm trend direction and identify entry points:
- Identify the underlying trend using other methods (moving averages, trend lines)
- Use MFI centerline (50) crosses to confirm trend direction
- Enter trades only in the direction of the confirmed trend
- For long positions: Wait for MFI to drop toward but remain above 50, then turn upward
- For short positions: Wait for MFI to rise toward but remain below 50, then turn downward
This strategy helps avoid counter-trend trades and can improve the win rate by aligning with the prevailing market direction.
4. MFI-Volume Confirmation Strategy
This strategy enhances MFI signals with direct volume analysis:
- Identify potential signals from MFI (overbought/oversold, divergences, centerline crosses)
- Confirm these signals by analyzing raw volume patterns
- Look for increasing volume in the direction of the expected move
- Enter trades only when both MFI signals and volume analysis align
By combining MFI with direct volume analysis, this strategy provides additional confirmation and can help filter out false signals.
Advanced Money Flow Index Concepts
Multiple Timeframe Analysis
Analyzing MFI across different timeframes can provide more comprehensive insights:
- Higher timeframe MFI: Determines the overall money flow trend
- Lower timeframe MFI: Identifies specific entry and exit points
This approach helps avoid trading against significant money flow trends and can improve timing on entries and exits.
MFI Rate of Change
Beyond the absolute value, the rate at which MFI changes can provide additional insights:
- Rapid changes in MFI often precede significant price movements
- Slowing MFI momentum can signal potential trend exhaustion
- Steady MFI changes typically indicate sustainable trends
Some traders apply rate-of-change indicators to MFI itself to identify acceleration or deceleration in money flow.
Combining MFI with Other Indicators
MFI works particularly well when combined with complementary indicators:
- Price-based momentum indicators (RSI, Stochastic): Provide confirmation from different mathematical approaches
- Trend indicators (Moving Averages, MACD): Help define the broader trend context
- Volatility indicators (Bollinger Bands, ATR): Adjust position sizing based on market conditions
Creating a comprehensive system that incorporates multiple indicator types can provide more robust trading signals than relying on MFI alone.
Customizing Money Flow Index
While the standard 14-period MFI works well in many situations, adjusting parameters can optimize the indicator for specific markets and trading styles:
Timeframe Adjustments
- Shorter periods (7-10): More responsive, produces more signals but higher false positive rate
- Longer periods (21-30): Smoother, fewer but potentially more reliable signals
Short-term traders might prefer more responsive settings, while swing and position traders might opt for longer periods.
Overbought/Oversold Threshold Adjustments
- More conservative thresholds (70/30): Generate more signals, suitable for ranging markets
- More extreme thresholds (90/10): Generate fewer but potentially stronger signals, better during trends
These thresholds can be tailored to individual securities based on historical MFI behavior.
Comparing MFI with Related Indicators
MFI vs. RSI
The most common comparison is between MFI and RSI:
- Similarity: Both are momentum oscillators ranging from 0-100 with similar interpretation methods
- Key Difference: MFI incorporates volume while RSI is purely price-based
- Practical Impact: MFI may provide earlier and more reliable signals during significant market turns due to volume confirmation
When price and volume align, MFI and RSI typically provide similar signals. Divergence between these indicators can itself be a valuable analytical insight.
MFI vs. On-Balance Volume (OBV)
- Similarity: Both incorporate volume to confirm price movements
- Difference: MFI is a bounded oscillator (0-100) while OBV is an unbounded cumulative indicator
- Practical Impact: MFI is better for identifying overbought/oversold conditions, while OBV excels at confirming trend strength
Using both indicators can provide complementary insights into volume-price relationships.
Advantages and Limitations of Money Flow Index
Advantages
- Volume Incorporation: Adds valuable volume confirmation to momentum analysis
- Early Signal Potential: Can often identify reversals earlier than price-only indicators
- Versatility: Works across different markets and timeframes
- Multiple Applications: Can be used for overbought/oversold conditions, divergences, and trend confirmation
Limitations
- Lagging Element: Despite volume incorporation, still contains lagging components
- False Signals: Can generate false signals, especially in strongly trending markets
- Volume Reliability: In some markets, volume data may be incomplete or misleading
- Need for Confirmation: Most effective when used with other technical analysis tools
Understanding these limitations helps traders use MFI appropriately as part of a comprehensive trading approach rather than relying on it exclusively.
Practical Tips for Trading with Money Flow Index
- Use MFI in the right context: Understand whether the market is trending or ranging and adjust your MFI strategy accordingly
- Combine with price action: Look for candlestick patterns, support/resistance levels, and trend lines to confirm MFI signals
- Consider multiple timeframes: Align your MFI analysis across different timeframes for more robust signals
- Be patient with divergences: Wait for confirmation before acting on MFI divergences, as they can sometimes take time to play out
- Adjust settings for your market: Different markets and securities may respond better to different MFI periods and thresholds
Conclusion: Mastering the Money Flow Index
The Money Flow Index stands out in the world of technical indicators by combining price action with volume data to provide a more comprehensive view of market dynamics. Its ability to measure the pressure behind price movements makes it particularly valuable for identifying potential reversals and confirming trend strength.
While no indicator is perfect, MFI's unique incorporation of volume gives traders an additional edge in understanding market behavior. By using MFI as part of a well-rounded technical analysis approach—alongside price action analysis, complementary indicators, and sound risk management—traders can enhance their ability to identify high-probability trading opportunities.
As with all technical tools, practice and experience are key to developing intuition for how MFI behaves across different markets and conditions. With time, traders can learn to distinguish between routine MFI fluctuations and the truly significant signals that can lead to profitable trading decisions.
Key Takeaways
- Money Flow Index combines price and volume data to measure the strength of money flowing in and out of a security
- Standard MFI settings use a 14-period calculation with 80/20 as overbought/oversold thresholds
- Key MFI signals include overbought/oversold conditions, divergences, centerline crosses, and failure swings
- MFI can be more effective than price-only indicators like RSI for identifying significant market turns
- Best results come from combining MFI with price action analysis and complementary indicators