Williams %R: Momentum Oscillator Analysis
What is Williams %R?
Williams %R is a momentum oscillator developed by legendary trader Larry Williams in the 1960s. It measures the current closing price relative to the high-low range over a specific period, typically 14 periods. The indicator oscillates between 0 and -100, making it the inverse of the Fast Stochastic Oscillator.
Named after its creator, Williams %R is designed to identify overbought and oversold conditions in the market. Larry Williams, who famously turned $10,000 into over $1 million in a trading contest, developed this indicator based on his extensive experience in commodity trading. The indicator has since become a staple in technical analysis across all financial markets.
What makes Williams %R unique is its inverse scale and high sensitivity to price movements. Unlike other oscillators that use positive scales, Williams %R uses negative values, which can initially confuse new traders but provides a distinctive perspective on market momentum.
Williams %R Calculation Formula: Step-by-Step Breakdown
Understanding the Williams %R calculation helps traders grasp why the indicator behaves as it does and how to interpret its signals effectively:
Williams %R Formula:
Step-by-Step Calculation Process:
Step 1: Identify the Lookback Period
Determine the number of periods to analyze (typically 14 periods). This can be adjusted based on your trading timeframe and sensitivity preferences.
Step 2: Find the Highest High
Identify the highest price reached during the lookback period. This represents the peak value within your analysis window.
Step 3: Find the Lowest Low
Identify the lowest price reached during the same lookback period. This represents the trough value within your analysis window.
Step 4: Calculate the Numerator
Subtract the current closing price from the highest high: (Highest High - Current Close)
Step 5: Calculate the Denominator
Subtract the lowest low from the highest high: (Highest High - Lowest Low)
Step 6: Apply the Final Formula
Divide the numerator by the denominator and multiply by -100 to get the Williams %R value.
Example Calculation:
Highest High (14 periods): $52.00
Lowest Low (14 periods): $48.00
Current Close: $50.00
Williams %R = (52.00 - 50.00) / (52.00 - 48.00) × -100 = -50
Williams %R vs RSI vs Stochastic: Understanding the Differences
While Williams %R, RSI, and Stochastic are all momentum oscillators, they have distinct characteristics that make them suitable for different trading approaches:
| Indicator | Scale Range | Calculation Focus | Sensitivity | Best Use Case |
|---|---|---|---|---|
| Williams %R | 0 to -100 | Current close vs high-low range | High | Short-term momentum shifts |
| RSI | 0 to 100 | Average gains vs losses | Medium | Trend strength and reversals |
| Stochastic | 0 to 100 | Current close vs low-high range | Medium-High | Crossover signals with smoothing |
Key Distinguishing Features:
- Inverse Scale: Williams %R's negative scale (-100 to 0) makes it unique among oscillators
- Raw Sensitivity: No internal smoothing makes it more reactive to price changes than RSI or Stochastic
- Mathematical Relationship: Williams %R is essentially the inverse of the Fast Stochastic Oscillator
- Speed of Signals: Generates signals faster than RSI but may produce more false signals
Understanding Williams %R Levels: Overbought and Oversold Zones
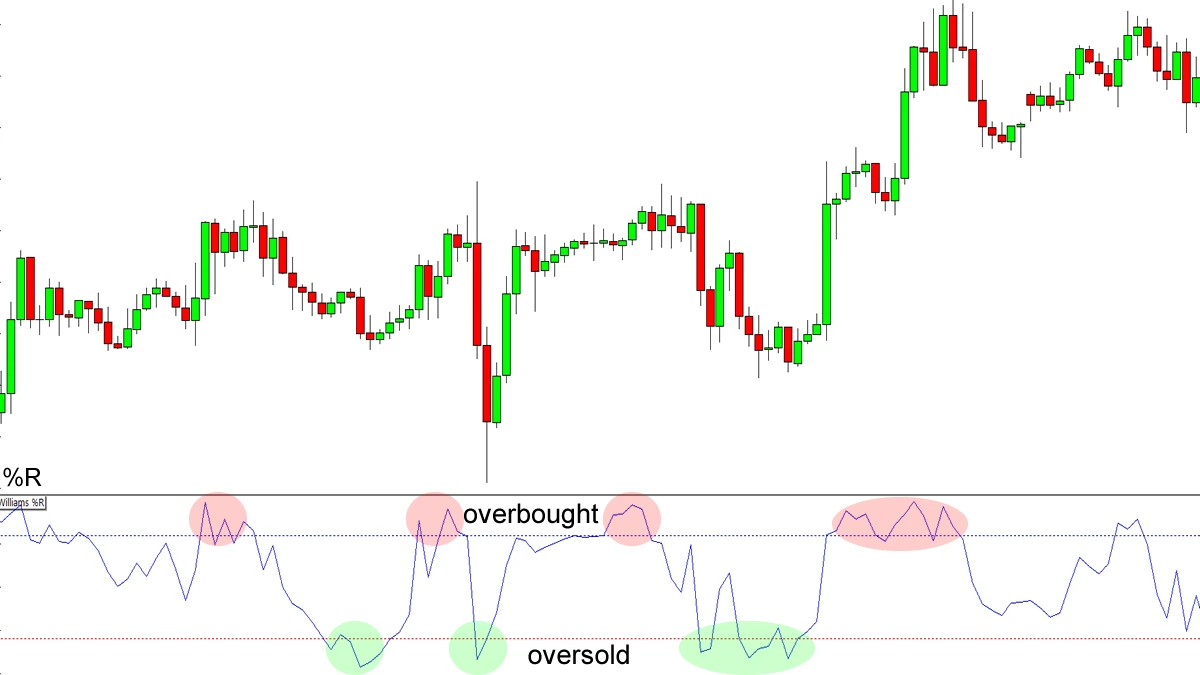
Williams %R uses specific levels to identify market conditions and potential trading opportunities:
Critical Williams %R Levels:
Overbought Zone: 0 to -20
- Price is near the recent high
- Potential selling opportunity
- Market may be due for correction
- Consider bearish reversal signals
Neutral Zone: -20 to -80
- Midpoint at -50 is key level
- Above -50: Bullish momentum
- Below -50: Bearish momentum
- Watch for crossover signals
Oversold Zone: -80 to -100
- Price is near the recent low
- Potential buying opportunity
- Market may be due for bounce
- Consider bullish reversal signals
⚠️ Important Considerations:
- Strong trends can keep Williams %R in extreme zones for extended periods
- In strong uptrends, the indicator may fluctuate between -20 and -60
- In strong downtrends, it may stay between -40 and -100
- Always consider the overall trend direction when interpreting levels
Proven Williams %R Trading Strategies
Williams %R can be used in various trading strategies, each suited to different market conditions and trading styles:
Strategy 1: Overbought/Oversold Mean Reversion
This strategy focuses on trading reversals from extreme levels:
Bullish Setup:
- Williams %R drops below -80 (oversold)
- Wait for the indicator to turn upward
- Enter long when %R crosses back above -80
- Set stop loss below recent swing low
- Target first resistance or -20 level
Bearish Setup:
- Williams %R rises above -20 (overbought)
- Wait for the indicator to turn downward
- Enter short when %R crosses back below -20
- Set stop loss above recent swing high
- Target first support or -80 level
Strategy 2: Midpoint Crossover Strategy
The -50 midpoint acts as a momentum gauge, providing more reliable signals than extreme levels:
- Bullish Signal: Williams %R crosses above -50, indicating strengthening upward momentum
- Bearish Signal: Williams %R crosses below -50, indicating strengthening downward momentum
- Advantage: Reduces false signals compared to trading extreme levels
- Best Markets: Works well in trending markets with clear directional bias
Strategy 3: Williams %R Divergence Trading
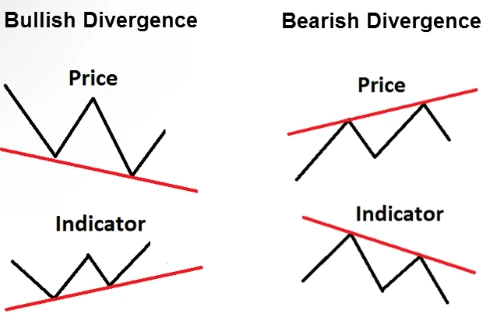
Divergence occurs when price and Williams %R move in opposite directions, often signaling potential reversals:
Bullish Divergence:
- Price Action: Makes lower lows
- Williams %R: Makes higher lows
- Signal: Potential upward reversal
- Entry: When price breaks above recent swing high
- Stop: Below the divergence low
Bearish Divergence:
- Price Action: Makes higher highs
- Williams %R: Makes lower highs
- Signal: Potential downward reversal
- Entry: When price breaks below recent swing low
- Stop: Above the divergence high
💡 Divergence Trading Tips:
- Divergences are most reliable when formed at extreme Williams %R levels
- Always wait for price confirmation before entering trades
- Multiple timeframe divergence alignment increases probability
- Combine with other indicators for additional confirmation
Best Timeframes and Market Conditions for Williams %R
Williams %R's effectiveness varies depending on the timeframe and market conditions. Understanding when and where to use it maximizes its potential:
Recommended Timeframes by Trading Style:
Scalping (1-5 min)
- Period: 5-10
- Focus: Quick reversals
- Risk: High false signals
- Best: Liquid markets
Day Trading (15min-1H)
- Period: 14 (standard)
- Focus: Intraday swings
- Risk: Moderate
- Best: Trending sessions
Swing Trading (4H-Daily)
- Period: 14-21
- Focus: Multi-day moves
- Risk: Lower
- Best: All conditions
Optimal Market Conditions:
- Trending Markets: Williams %R works best when there's a clear directional bias
- Moderate Volatility: High volatility can cause excessive false signals
- Liquid Markets: Ensures price moves are genuine and not manipulated
- Active Trading Sessions: Avoid using during low-volume periods
Common Williams %R Mistakes and How to Avoid Them
Understanding common pitfalls helps traders use Williams %R more effectively:
❌ Common Mistakes:
- Trading extreme levels without confirmation
- Ignoring the overall trend direction
- Using the same settings for all markets
- Expecting immediate reversals from extreme levels
- Not waiting for price action confirmation
- Over-relying on the indicator alone
✅ Best Practices:
- Always consider trend direction first
- Wait for Williams %R to turn before entering
- Use multiple timeframe analysis
- Combine with other technical indicators
- Practice proper risk management
- Backtest strategies before live trading
Key Limitations to Remember:
- Extreme Zone Persistence: Strong trends can keep the indicator in overbought/oversold zones for extended periods
- False Signals in Ranges: Choppy, sideways markets generate numerous false signals
- No Volume Information: Williams %R doesn't consider volume, which can be crucial for confirmation
- Sensitivity Issues: High sensitivity can lead to premature entries and exits
Advanced Williams %R Techniques
Experienced traders can enhance Williams %R effectiveness through advanced applications:
Multi-Timeframe Analysis:
- Use higher timeframes (4H/Daily) to determine overall trend direction
- Use lower timeframes (1H/15min) for precise entry and exit timing
- Look for Williams %R alignment across multiple timeframes for stronger signals
- Enter trades only when shorter-term signals align with longer-term trend
Combining with Other Indicators:
- Moving Averages: Use 20/50 EMA to confirm trend direction
- Volume Indicators: Add volume confirmation for stronger signals
- Support/Resistance: Combine Williams %R signals with key price levels
- Candlestick Patterns: Wait for reversal patterns to confirm Williams %R signals
Parameter Optimization:
While 14 is the standard period, consider adjusting based on market characteristics:
- Fast Markets (Crypto): 7-10 periods for quicker signals
- Slow Markets (Weekly charts): 21-28 periods for smoother signals
- Volatile Markets: Longer periods to reduce noise
- Trending Markets: Standard 14-period works well
Conclusion
Williams %R stands as one of the most responsive and useful momentum oscillators in technical analysis. Developed by legendary trader Larry Williams, this indicator offers unique insights into market momentum through its inverse scale and high sensitivity to price movements.
The key to successful Williams %R trading lies in understanding its strengths and limitations. While it excels at identifying short-term momentum shifts and potential reversal points, it should never be used in isolation. The most effective approach combines Williams %R signals with trend analysis, price action confirmation, and proper risk management.
Whether you're using the overbought/oversold strategy for mean reversion trades, the midpoint crossover for momentum confirmation, or divergence analysis for reversal signals, Williams %R provides valuable insights that can enhance your trading decisions. Remember to adapt the indicator's settings to your specific trading style and market conditions, and always practice proper risk management.
As with any technical indicator, mastering Williams %R requires practice and experience. Start by identifying the patterns on historical charts, then gradually incorporate it into your trading strategy with proper backtesting and risk management protocols.