Average True Range (ATR): The Complete Guide to Volatility Measurement
What Is the Average True Range (ATR)?
The Average True Range (ATR) is a technical analysis indicator developed by J. Welles Wilder Jr. in his 1978 book, "New Concepts in Technical Trading Systems." Originally designed for commodity markets, ATR has become one of the most widely used volatility indicators across all financial markets, including stocks, forex, and cryptocurrencies.
What makes ATR particularly valuable is its ability to measure market volatility without considering price direction. It provides traders with an objective measurement of how much an asset typically moves over a given time period, accounting for gaps and limit moves that simple range calculations might miss.
The Formula: How ATR Is Calculated
The ATR calculation involves finding the true range (TR) for each period, then averaging these values over a specified number of periods (typically 14). The true range captures the maximum change in price an asset experiences during a single period, accounting for gaps between trading sessions.
True Range (TR)
TR = Maximum of:
1. Current High - Current Low
2. |Current High - Previous Close|
3. |Current Low - Previous Close|
Average True Range (ATR)
First ATR = Simple average of TR values for initial periods
Subsequent ATR = ((Previous ATR × (n-1)) + Current TR) / n
Where n is the number of periods (typically 14)
This calculation method used by Wilder is a smoothed moving average that gives more weight to recent values while still accounting for historical data. The ATR's calculation specifically includes gaps between sessions by using the previous close in its formula, making it particularly useful for assets that can gap up or down between trading sessions.
Why ATR Is Important for Traders
The Average True Range provides several key insights that make it invaluable for traders:
- Objective Volatility Measurement: Unlike subjective assessments of market conditions, ATR provides a precise numerical value for volatility
- Market Characteristic Identification: Different markets and assets have characteristic ATR values that help traders understand their typical behavior
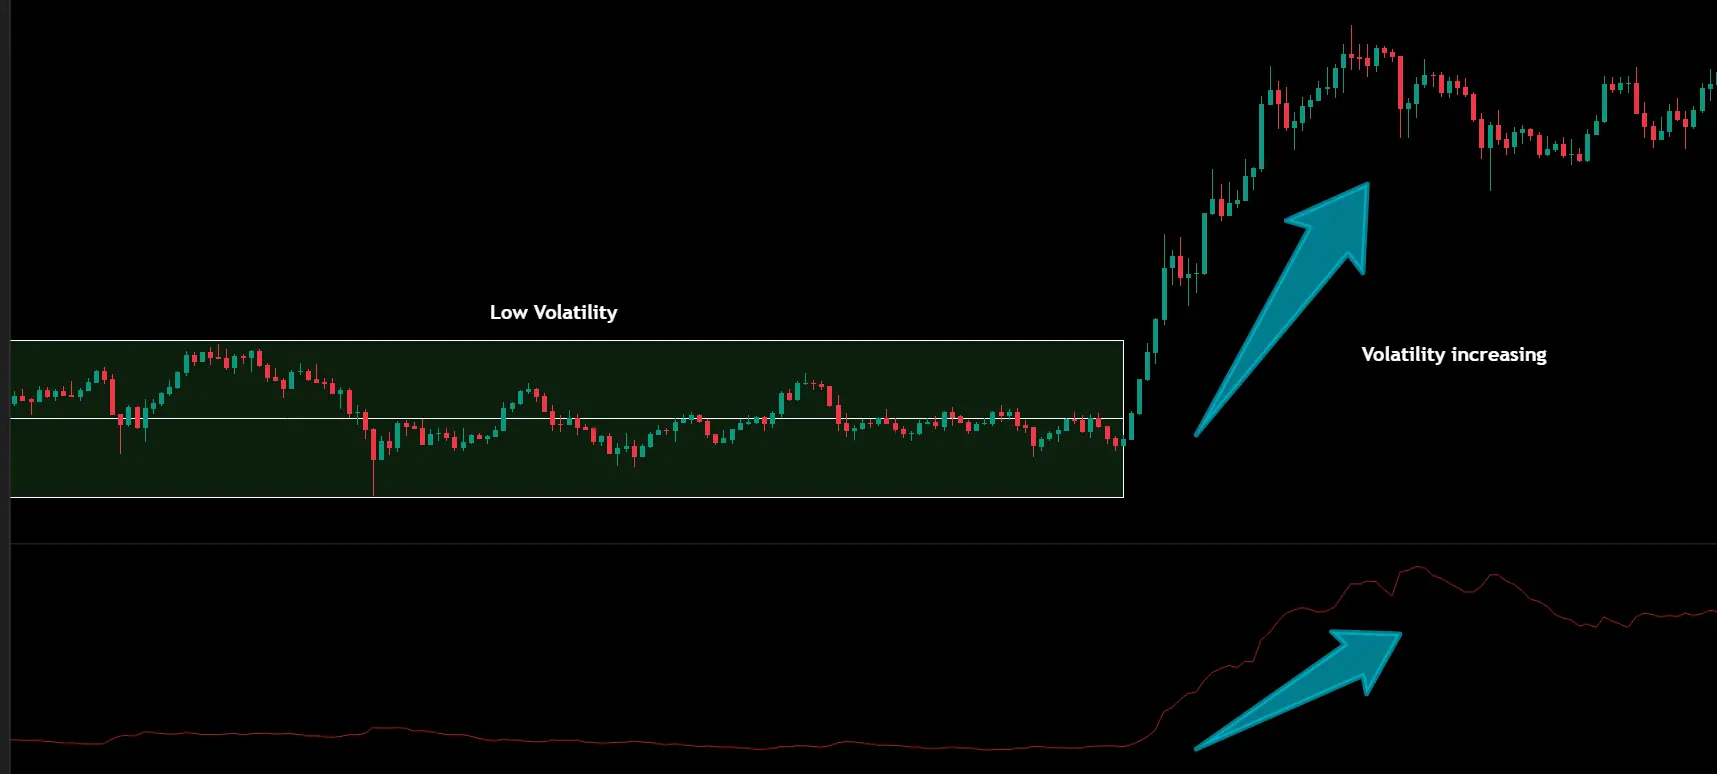
- Volatility Cycles Recognition: Markets typically cycle between periods of high and low volatility; ATR helps identify these transitions
- Market Condition Shifts: Significant changes in ATR can signal important shifts in market conditions before price trends become obvious
- Risk Management Parameter: ATR provides an objective basis for setting stop-loss levels, profit targets, and position sizes
Practical Applications of ATR
1. Stop-Loss Placement
One of the most common applications of ATR is using it to set rational stop-loss levels. Instead of using arbitrary fixed pip/point values or percentage-based stops, traders can set stops based on the actual volatility of the instrument:
- Conservative Stop: Entry price - (2 × ATR)
- Moderate Stop: Entry price - (1.5 × ATR)
- Aggressive Stop: Entry price - (1 × ATR)
This approach ensures stops are placed at levels that respect the instrument's normal price fluctuations, reducing the chance of being stopped out by normal market noise.
2. Position Sizing
ATR allows traders to adjust position sizes based on current market volatility rather than using fixed lot sizes:
- During high volatility (higher ATR): Reduce position size to maintain consistent risk
- During low volatility (lower ATR): Increase position size to maintain consistent risk
This volatility-adjusted position sizing helps maintain consistent risk exposure regardless of market conditions.
3. Trailing Stops
ATR-based trailing stops allow profits to run while providing dynamic protection against reversals:
- Chandelier Exit: Trail stops below the highest high (for longs) by a multiple of the ATR
- ATR Channels: Create dynamic channels around price using ATR multiples
These methods keep stops at a safe distance during normal fluctuations but close enough to protect profits if the trend reverses.
4. Volatility Breakouts
ATR can be used to identify potential breakout opportunities:
- Contraction Followed by Expansion: When ATR falls to historically low levels and then begins to rise, it often signals the start of a new trend
- Volatility-Based Breakout Entries: Enter trades when price moves a certain multiple of the ATR from a key level or support/resistance
This approach helps traders focus on breakouts with sufficient momentum to potentially develop into significant trends.
5. Price Targets and Take-Profit Levels
ATR provides objective measures for setting realistic profit targets:
- Measured Move Targets: Set targets at 2×, 3×, or more multiples of ATR from entry
- Risk-Reward Ratios: If stops are set at 1× ATR, targets might be set at 2× or 3× ATR to maintain favorable risk-reward ratios
These ATR-based targets are calibrated to the specific asset's volatility, making them more relevant than arbitrary targets.
ATR-Based Trading Strategies
1. ATR Channel Breakout Strategy
This strategy creates channels around a moving average using ATR values:
- Setup: Plot a 20-period moving average with upper and lower channels at 2× ATR
- Entry (Long): When price breaks above the upper channel after being below or within it
- Stop Loss: Below the moving average or 1× ATR below entry
- Take Profit: When price reaches 2× the risk (ATR multiple)
The bearish version uses the opposite conditions (break below lower channel, etc.).
2. ATR Volatility Expansion Strategy
This strategy focuses on capturing moves that follow periods of low volatility:
- Setup: Identify when ATR reaches a 20-day low (or other significant lookback period)
- Entry: Enter in the direction of the initial volatility expansion (first decisive move after contraction)
- Confirmation: Wait for price to move at least 0.5× ATR in the trade direction
- Stop Loss: 1× ATR from entry in the opposite direction
- Take Profit: 3× ATR from entry or at the next significant support/resistance
This strategy capitalizes on the tendency of markets to experience trending moves after periods of consolidation.
3. Chandelier Exit Strategy
While primarily an exit strategy, the Chandelier Exit can be incorporated into a complete trading system:
- Entry: Enter trades based on your preferred entry signals (moving average crossovers, pattern breakouts, etc.)
- Initial Stop: Set at a fixed multiple of ATR from entry (e.g., 3× ATR)
- Trailing Stop (Long): As price moves up, trail the stop at 3× ATR below the highest high since entry
- Exit: Exit when price hits the trailing stop or other exit criteria
This approach provides a systematic method for riding trends while protecting gains.
ATR vs. Other Volatility Indicators
ATR vs. Bollinger Bands
While both measure volatility, Bollinger Bands use standard deviation around a moving average, creating channels that expand and contract with volatility. ATR provides a single value representing volatility. Bollinger Bands visually show potential overbought/oversold conditions, while ATR is typically used for position sizing and stop placement.
ATR vs. Standard Deviation
Standard Deviation measures how far prices deviate from their average, focusing on variability around a central value. ATR measures the total range of price movement, including gaps, regardless of direction. Standard Deviation is more useful for statistical analysis, while ATR is typically more practical for day-to-day trading decisions.
ATR vs. Historical Volatility
Historical Volatility (HV) measures the dispersion of returns over a period, usually expressed as an annualized percentage. ATR measures the average range in price units. HV is more commonly used in options pricing and long-term analysis, while ATR is more frequently used for short-term trading decisions and risk management.
Best Practices for Using ATR
1. Choose Appropriate Time Periods
The standard 14-period setting works well for many applications, but consider adjusting based on your trading timeframe:
- Shorter periods (7-10): More responsive to recent volatility changes, better for short-term trading
- Longer periods (20-30): Smoother readings with less noise, better for position trading
2. Adjust ATR Multiples for Different Markets
Different markets have different volatility characteristics. Through experience, traders should determine the optimal ATR multiples for stops and targets in each market they trade:
- Highly volatile markets (like cryptocurrencies): Might require larger multiples (3-4× ATR)
- Less volatile markets (like major forex pairs): Might work well with smaller multiples (1-2× ATR)
3. Use ATR in Context
ATR is most powerful when used alongside other analysis tools:
- Combine ATR with trend analysis (moving averages, trendlines)
- Use in conjunction with support/resistance levels
- Pair with momentum indicators for confirmation
4. Compare Current ATR to Historical Levels
ATR becomes more meaningful when compared to its own historical values:
- Look for ATR reaching historical extremes (very high or very low)
- Track ATR relative to its moving average to identify changing volatility conditions
- Develop a feel for what constitutes "normal" ATR for your traded instruments
Common Mistakes When Using ATR
- Using fixed ATR multiples across all markets: Different markets require different ATR settings
- Ignoring timeframe considerations: The same ATR setting has different implications on different timeframes
- Treating ATR as a directional indicator: ATR only measures volatility, not direction
- Using ATR in isolation: ATR works best as part of a complete trading approach
- Setting stops too tight: Using too small an ATR multiple often results in premature stop-outs
Conclusion
The Average True Range is an essential tool for measuring market volatility and improving risk management. Unlike many indicators that focus on predicting price direction, ATR provides objective measurement of market volatility, which traders can use to make more informed decisions about position sizing, stop placement, and potential market breakouts.
By incorporating ATR into your trading approach, you can adapt to changing market conditions, maintain consistent risk parameters, and develop more robust trading strategies. Whether you're day trading or swing trading, in forex or cryptocurrencies, ATR provides valuable insights that can help protect capital and maximize opportunities.
Remember that ATR, like all technical indicators, works best when combined with other forms of analysis and within a comprehensive trading plan. With practice and experience, ATR can become an invaluable component of your trading toolkit.