Ichimoku Cloud: The Complete Guide to this All-in-One Trading Indicator
What Is the Ichimoku Cloud?
The Ichimoku Cloud, or Ichimoku Kinko Hyo (which translates to "one glance equilibrium chart"), is a comprehensive technical analysis indicator developed by Japanese journalist Goichi Hosoda in the late 1960s. This versatile indicator provides traders with a complete trading system in a single chart, offering insights into trend direction, momentum, support and resistance levels, and potential trading signals.
What makes the Ichimoku Cloud particularly valuable is its ability to provide a holistic view of the market at "one glance." Unlike many indicators that focus on a single aspect of market dynamics, the Ichimoku Cloud combines multiple elements to create a complete picture of price action, making it an all-in-one technical analysis tool.
The Five Components of Ichimoku Cloud
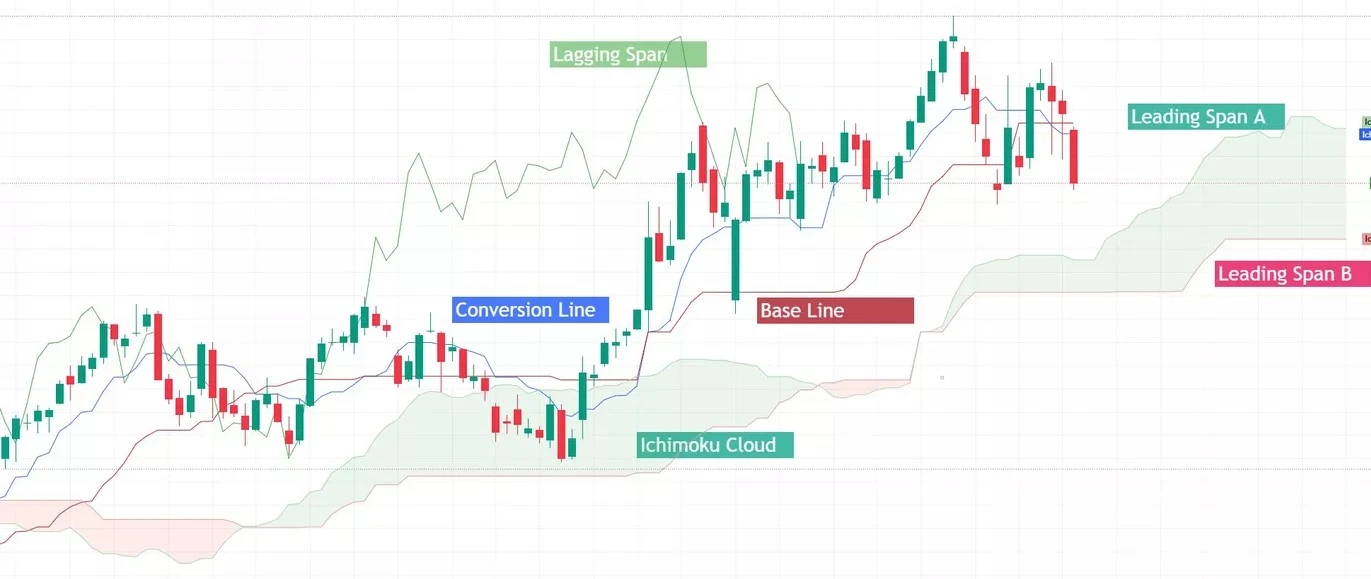
To understand the Ichimoku Cloud fully, you need to grasp its five distinct components, each serving a specific purpose in the overall analysis:
1. Tenkan-sen (Conversion Line)
The Tenkan-sen is the fastest-moving line in the Ichimoku system, calculated as the average of the 9-period high and 9-period low. It functions similarly to a short-term moving average and represents short-term market momentum. When the Tenkan-sen moves upward, it indicates short-term bullish momentum; when it moves downward, it suggests short-term bearish momentum.
2. Kijun-sen (Base Line)
The Kijun-sen is calculated as the average of the 26-period high and 26-period low. This line serves multiple functions: it can be used to identify market trend, as a trailing stop-loss level, and as a point of reference for potential trade entries when price crosses this line. The Kijun-sen represents medium-term market equilibrium.
3. Senkou Span A (Leading Span A)
Senkou Span A is calculated as the average of the Tenkan-sen and Kijun-sen, plotted 26 periods ahead. This forward projection creates the leading edge of the Ichimoku Cloud (Kumo). It's one of the two components that form the Cloud itself and represents potential future support or resistance levels.
4. Senkou Span B (Leading Span B)
Senkou Span B is calculated as the average of the 52-period high and 52-period low, also plotted 26 periods ahead. This line forms the second boundary of the Ichimoku Cloud. Senkou Span B is less reactive to price changes than Senkou Span A due to its longer lookback period, making it a stronger support/resistance level during trend changes.
5. Chikou Span (Lagging Span)
The Chikou Span is simply the current closing price plotted 26 periods back. This unique element allows traders to see how the current price compares to past price action and helps identify potential support and resistance areas. When the Chikou Span crosses above past price bars, it's considered bullish; when it crosses below past price bars, it's considered bearish.
The Formula: How Ichimoku Cloud Is Calculated
Understanding the mathematical calculations behind the Ichimoku Cloud helps traders better interpret its signals and potentially customize the settings for different markets or timeframes.
Tenkan-sen (Conversion Line)
Tenkan-sen = (9-period High + 9-period Low) / 2
Kijun-sen (Base Line)
Kijun-sen = (26-period High + 26-period Low) / 2
Senkou Span A (Leading Span A)
Senkou Span A = (Tenkan-sen + Kijun-sen) / 2
Plotted 26 periods ahead
Senkou Span B (Leading Span B)
Senkou Span B = (52-period High + 52-period Low) / 2
Plotted 26 periods ahead
Chikou Span (Lagging Span)
Chikou Span = Current closing price
Plotted 26 periods back
The traditional settings of 9, 26, and 52 periods were originally based on the Japanese trading week, which included Saturdays. Modern traders sometimes adjust these values to 7, 22, and 44 for markets with a five-day trading week, but the traditional values remain widely used across all markets and timeframes.
The Ichimoku Cloud (Kumo)
The "Cloud" or "Kumo" is the most distinctive visual element of the Ichimoku system, formed by the area between Senkou Span A and Senkou Span B. This shaded area represents dynamic support and resistance zones and provides immediate visual information about the market trend:
- Bullish Market: When price is above the Cloud
- Bearish Market: When price is below the Cloud
- Consolidation/Uncertainty: When price is inside the Cloud
The Cloud's thickness and direction also provide valuable information:
- Thick Cloud: Suggests strong support/resistance and low volatility
- Thin Cloud: Indicates weaker support/resistance and potential for easier breakouts
- Rising Cloud: Indicates bullish future bias
- Falling Cloud: Indicates bearish future bias
A "Kumo Twist" occurs when Senkou Span A crosses Senkou Span B, potentially signaling a change in market bias 26 periods in advance due to the forward projection of these lines.
Key Ichimoku Cloud Trading Signals
1. TK Cross (Tenkan-sen/Kijun-sen Cross)
One of the primary signals in the Ichimoku system is the TK Cross:
- Bullish TK Cross: Tenkan-sen crosses above Kijun-sen, indicating bullish momentum
- Bearish TK Cross: Tenkan-sen crosses below Kijun-sen, indicating bearish momentum
The strength of this signal is significantly enhanced when the cross occurs above the Cloud for bullish signals or below the Cloud for bearish signals, aligning with the overall trend.
2. Kumo Breakouts
Kumo breakouts occur when price penetrates the Cloud after being on the opposite side:
- Bullish Breakout: Price breaks above the Cloud, suggesting potential trend change to bullish
- Bearish Breakout: Price breaks below the Cloud, suggesting potential trend change to bearish
These breakout signals are stronger when the Cloud ahead of the breakout is thin and when the Cloud is twisting in the direction of the breakout.
3. Kijun-sen Cross
When price crosses the Kijun-sen (Base Line), it can signal a potential trend change or continuation:
- Bullish Kijun Cross: Price crosses above the Kijun-sen
- Bearish Kijun Cross: Price crosses below the Kijun-sen
This signal is particularly effective when price and the Kijun-sen are both above or below the Cloud, confirming the overall trend direction.
4. Chikou Span Confirmation
The Chikou Span provides confirmation signals based on its position relative to historical price:
- Bullish: Chikou Span is above price from 26 periods ago and has clear space above (no price bars blocking its path)
- Bearish: Chikou Span is below price from 26 periods ago and has clear space below
Many traders consider the Chikou Span the final confirmation required before entering a trade based on other Ichimoku signals.
5. Kumo Twist
A Kumo Twist occurs when Senkou Span A and Senkou Span B cross each other:
- Bullish Twist: Senkou Span A crosses above Senkou Span B
- Bearish Twist: Senkou Span A crosses below Senkou Span B
Because the Senkou Spans are projected 26 periods ahead, this signal can provide early warning of potential trend changes, although it should be confirmed by other signals.
Ichimoku Cloud Trading Strategies
1. Trend Following Strategy
This strategy focuses on trading in the direction of the established trend:
- Entry Conditions (Long): Price above Cloud, Tenkan-sen above Kijun-sen, Chikou Span above price from 26 periods ago
- Entry Trigger: Price pullback to Tenkan-sen or Kijun-sen followed by bullish candle pattern
- Stop Loss: Below the most recent swing low or below the Cloud
- Take Profit: Project the height of the Cloud or use previous resistance levels
The bearish version would use the opposite conditions (price below Cloud, etc.).
2. Kumo Breakout Strategy
This strategy focuses on capturing the beginning of new trends:
- Entry Conditions (Long): Price breaks above the Cloud after being below it
- Confirmation: Tenkan-sen crossing above Kijun-sen, Chikou Span above price
- Stop Loss: Below the Cloud or below recent swing low
- Take Profit: Measured move equal to the height of the Cloud or previous resistance levels
For higher probability trades, look for Kumo breakouts that coincide with a Kumo Twist in the same direction.
3. TK Cross Strategy
This strategy uses the crossover of the Tenkan-sen and Kijun-sen as the primary signal:
- Entry Conditions (Long): Tenkan-sen crosses above Kijun-sen while price is above the Cloud
- Confirmation: Chikou Span above price, flat or rising Cloud ahead
- Stop Loss: Below Kijun-sen or below the Cloud
- Take Profit: Previous resistance levels or fixed risk-reward ratio (2:1 or 3:1)
This strategy works best in trending markets rather than ranging or consolidating markets.
Ichimoku Cloud vs. Other Technical Indicators
Ichimoku Cloud vs. Moving Averages
While moving averages only show historical price averages, the Ichimoku Cloud provides dynamic support/resistance zones, future projections, and multiple components for confirmation. However, the Cloud is more complex visually and conceptually compared to simple moving averages.
Ichimoku Cloud vs. MACD
The MACD focuses primarily on momentum and trend through moving average convergence/divergence. The Ichimoku Cloud offers a more complete system with support/resistance levels, trend direction, and momentum signals. The MACD is simpler and easier to interpret, while the Ichimoku provides more context and potential signals.
Ichimoku Cloud vs. Bollinger Bands
Bollinger Bands measure volatility and potential overbought/oversold conditions based on standard deviations. The Ichimoku Cloud provides trend information, momentum signals, and future support/resistance projections. While Bollinger Bands adapt dynamically to changing volatility, the Ichimoku Cloud uses fixed calculation periods.
Advantages and Limitations of the Ichimoku Cloud
Advantages
- All-in-One System: Provides trend direction, momentum, support/resistance, and potential signals in a single indicator
- Forward Projection: The Cloud projects potential future support/resistance levels
- Multiple Timeframes: Works effectively across various timeframes and markets
- Objective Signals: Provides mechanical signals with less subjectivity than many other technical approaches
- Historical Context: The Chikou Span provides unique insights into price relative to historical action
Limitations
- Visual Complexity: Can appear overwhelming with multiple lines and colored areas
- Learning Curve: Takes time to understand all components and their interactions
- Lagging Elements: Like all indicators, contains some lagging elements in its calculations
- False Signals: Can generate false signals in choppy, sideways markets
- Parameter Sensitivity: Traditional settings may need adjustment for specific markets or conditions
Best Practices for Using the Ichimoku Cloud
1. Use Multiple Timeframes
Start analysis with higher timeframes to establish the overall trend, then move to lower timeframes for entry timing. This hierarchical approach ensures you're trading with the significant trend while optimizing entries.
2. Wait for Signal Alignment
The strongest Ichimoku signals occur when multiple components align. For example, a bullish TK Cross above the Cloud, with Chikou Span above price, and a rising Cloud ahead creates a robust bullish signal with higher probability of success.
3. Combine with Price Action
Use Ichimoku signals in conjunction with price action patterns like engulfing candles, pinbars, or dojis at key Ichimoku levels (like the Cloud edge or Kijun-sen) for higher probability entries.
4. Consider Market Context
The Ichimoku Cloud works best in trending markets. In ranging or highly volatile markets, signals may be less reliable. Adjust your trading approach or avoid trading during unclear Ichimoku conditions.
5. Practice Sound Risk Management
No indicator system is perfect. Always use appropriate position sizing and place stop losses at logical points, such as below the Cloud for long positions or at recent swing points.
Conclusion: Mastering the Ichimoku Cloud
The Ichimoku Cloud provides traders with a comprehensive technical analysis system that can identify trends, momentum, support/resistance, and potential trading opportunities—all in a single indicator. While it may appear complex initially, with practice, traders can learn to interpret its signals "at a glance" as its name suggests.
By understanding each component's role and how they interact, traders can develop robust strategies for various market conditions. The Ichimoku Cloud works across all timeframes and markets, making it a versatile addition to any technical trader's toolkit.
For best results, combine Ichimoku analysis with sound risk management principles, appropriate market selection, and confirmation from other technical approaches. With time and experience, the Ichimoku Cloud can become a powerful framework for trading decisions rather than just another indicator on your chart.