Average Directional Index (ADX): The Ultimate Trend Strength Indicator
What is the Average Directional Index (ADX)?
The Average Directional Index (ADX) is a trend strength indicator developed by J. Welles Wilder Jr. in 1978 as part of the Directional Movement System. Unlike many technical indicators that focus on trend direction, the ADX specifically measures the strength or weakness of a trend, regardless of whether it's bullish or bearish. This unique characteristic makes it an invaluable tool for traders seeking to identify when markets are trending strongly versus when they're in consolidation phases.
The ADX is part of a comprehensive indicator system that includes three components:
- ADX Line: Measures trend strength (ranges from 0 to 100)
- Plus Directional Indicator (+DI): Measures upward directional movement
- Minus Directional Indicator (-DI): Measures downward directional movement
Wilder, who also created the Relative Strength Index (RSI) and Parabolic SAR, designed the ADX based on his extensive experience trading commodities and currencies. The indicator has since become a cornerstone of technical analysis, particularly valued for its ability to help traders distinguish between trending and range-bound market conditions.
The ADX's primary purpose is to answer a crucial question that every trader faces: "Is this market trending strongly enough to justify a trend-following strategy, or should I use range-trading techniques?" This determination is essential for selecting appropriate trading strategies and managing risk effectively.
Understanding ADX Components: The Directional Movement System
Plus Directional Indicator (+DI)
The +DI measures the strength of upward price movement by comparing the current high to the previous high. It represents the percentage of the True Range that consists of upward directional movement. When +DI is rising, it indicates increasing bullish momentum, while a falling +DI suggests weakening upward pressure.
Minus Directional Indicator (-DI)
The -DI measures the strength of downward price movement by comparing the current low to the previous low. It represents the percentage of the True Range that consists of downward directional movement. Rising -DI indicates increasing bearish momentum, while falling -DI suggests weakening downward pressure.
ADX Line
The ADX line is derived from the relationship between +DI and -DI, measuring how separated these two indicators are. The greater the separation between +DI and -DI, the stronger the trend, regardless of direction. This makes ADX a non-directional indicator that focuses purely on trend strength.
ADX Calculation Formula: Step-by-Step Guide
The ADX calculation involves multiple steps that build upon each other to create the final trend strength measurement. Understanding this process helps traders better interpret the indicator's signals:
Step 1: Calculate Directional Movement (+DM and -DM)
Plus Directional Movement (+DM):
This measures upward price movement between periods.
Minus Directional Movement (-DM):
This measures downward price movement between periods.
Important Rule:
If both +DM and -DM are positive for the same period, only the larger value is used while the smaller value is set to zero. This ensures that only the dominant directional movement is counted.
Step 2: Calculate True Range (TR)
The True Range accounts for gaps and ensures accurate volatility measurement:
• Current High - Current Low
• Current High - Previous Close (absolute value)
• Current Low - Previous Close (absolute value)
True Range captures the full extent of price movement, including overnight gaps.
Step 3: Calculate Smoothed Directional Indicators
14-period smoothed values (using Wilder's smoothing):
-DI14 = (Smoothed -DM14 / Smoothed TR14) × 100
Wilder's Smoothing Formula:
First value = Sum of first 14 periods / 14
Subsequent values = ((Previous value × 13) + Current value) / 14
Step 4: Calculate Directional Movement Index (DX)
DX measures the absolute difference between +DI and -DI relative to their sum, providing a value between 0 and 100.
Step 5: Calculate ADX (Final Step)
The final ADX value applies Wilder's smoothing to the DX values, creating a stable trend strength measurement.
ADX Interpretation and Signal Levels
Understanding ADX levels is crucial for proper interpretation. The indicator provides clear thresholds that help traders classify market conditions:
| ADX Level | Trend Strength | Market Condition | Trading Approach |
|---|---|---|---|
| 0-20 | Weak/Absent | Sideways, choppy | Range trading, avoid trends |
| 20-25 | Emerging | Potential trend forming | Watch for breakouts |
| 25-50 | Strong | Trending market | Trend following strategies |
| 50-75 | Very Strong | Powerful trend | Stay with trend, trail stops |
| 75-100 | Extremely Strong | Exceptional trend | Consider profit taking |
Key ADX Signal Interpretations
🟢 Bullish Signals
- • ADX rising above 25 with +DI > -DI
- • +DI crossing above -DI while ADX > 20
- • ADX and +DI both rising simultaneously
- • Price making higher highs with rising ADX
🔴 Bearish Signals
- • ADX rising above 25 with -DI > +DI
- • -DI crossing above +DI while ADX > 20
- • ADX and -DI both rising simultaneously
- • Price making lower lows with rising ADX
⚠️ Caution Signals
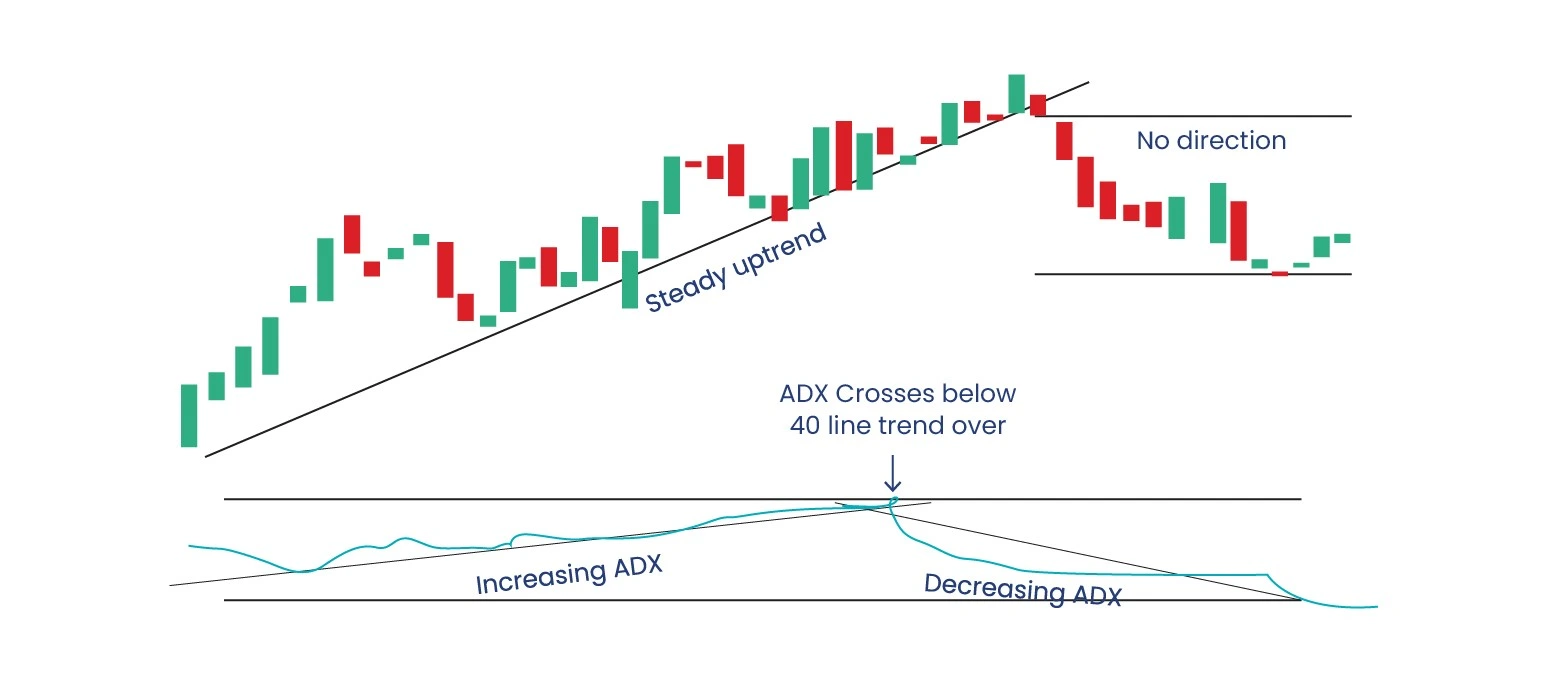
- • ADX falling from high levels (trend exhaustion)
- • ADX below 20 regardless of DI positions
- • +DI and -DI converging (indecision)
- • Extreme ADX readings above 70 (overextension)
ADX Trading Strategies
Strategy 1: ADX Trend Filter
Implementation Rules:
- • ADX above 25: Use trend-following strategies
- • ADX below 20: Use range-trading strategies
- • ADX 20-25: Neutral zone - wait for clearer signals
Conclusion
The Average Directional Index is a powerful tool for measuring trend strength and selecting appropriate trading strategies. Success with ADX requires understanding that it is most effective when used as a market regime filter rather than a standalone signal generator.
Key Takeaways:
- • ADX measures trend strength (0-100), not direction
- • Use ADX greater than 25 for trend strategies
- • Use ADX less than 20 for range strategies
- • Always confirm ADX signals with price action