On-Balance Volume (OBV): The Ultimate Volume-Price Analysis Tool
What is On-Balance Volume (OBV)?
On-Balance Volume (OBV) is a momentum indicator that uses volume flow to predict changes in stock price. Developed by Joseph Granville in 1963 in his book “Granville’s New Key to Stock Market Profits,” the OBV has become one of the most widely used volume-based technical indicators among professional traders and analysts.
The core principle behind OBV is that volume precedes price movements. Granville believed that smart money (institutional investors) moves into or out of securities before retail investors, causing volume to increase while price remains relatively stable. This theory forms the foundation of using OBV to:
- Identify accumulation and distribution phases
- Confirm price trend strength or weakness
- Spot potential trend reversals through divergences
- Distinguish between smart money and retail investor behavior
- Validate breakouts from support and resistance levels
Unlike other volume indicators that focus on price-volume relationships within individual trading sessions, OBV creates a cumulative running total that reflects the overall buying and selling pressure over time. This makes it particularly valuable for identifying long-term trends and institutional activity patterns.
How is On-Balance Volume Calculated? Complete Formula Guide
The On-Balance Volume calculation is elegantly simple yet powerful in its application. The indicator follows three basic rules that determine whether volume should be added to, subtracted from, or left unchanged in the running total:
OBV Calculation Rules:
Rule 1: If today's closing price > yesterday's closing price:
This indicates buying pressure, so volume is added to the cumulative total.
Rule 2: If today's closing price < yesterday's closing price:
This indicates selling pressure, so volume is subtracted from the cumulative total.
Rule 3: If today's closing price = yesterday's closing price:
No change in price means no change in OBV - the indicator remains flat.
Key Calculation Notes:
- • OBV is always cumulative - each day builds on the previous total
- • The absolute OBV value is less important than the trend direction
- • Volume is weighted equally regardless of the magnitude of price change
- • Starting point can be set to zero or any arbitrary number
Step-by-Step OBV Calculation Example
| Day | Closing Price | Volume | Price Direction | OBV Calculation | OBV Value |
|---|---|---|---|---|---|
| 1 | $50.00 | 10,000 | - | Starting Point | 10,000 |
| 2 | $50.25 | 15,000 | Up | 10,000 + 15,000 | 25,000 |
| 3 | $49.75 | 12,000 | Down | 25,000 - 12,000 | 13,000 |
| 4 | $49.75 | 8,000 | Unchanged | 13,000 + 0 | 13,000 |
| 5 | $51.00 | 20,000 | Up | 13,000 + 20,000 | 33,000 |
Interpreting On-Balance Volume Signals
Understanding OBV signals requires analyzing the relationship between the OBV line movement and price action. The indicator provides several types of signals that help traders make informed decisions:
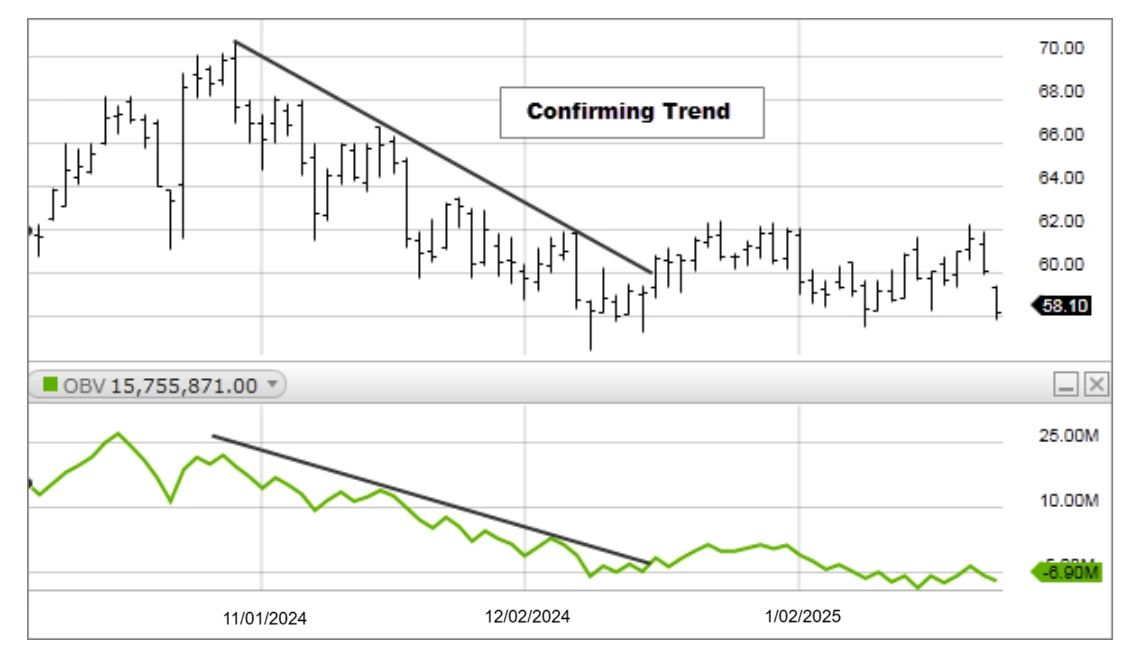
1. Trend Confirmation Signals
When both price and OBV move in the same direction, it confirms the strength of the current trend:
- Bullish Confirmation: Rising prices accompanied by rising OBV indicate strong buying pressure and healthy uptrend continuation
- Bearish Confirmation: Falling prices with declining OBV suggest sustained selling pressure and downtrend strength
- Trend Acceleration: Steep OBV slopes during price trends indicate increasing momentum
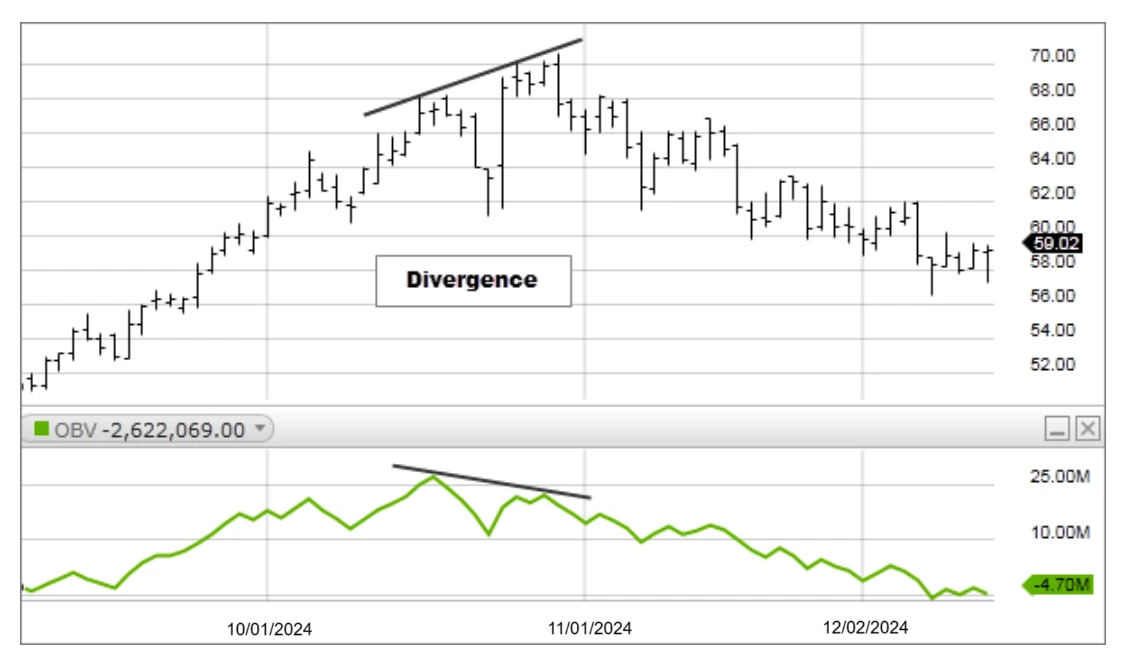
2. Divergence Signals
Divergences between price and OBV often provide early warning signals of potential trend reversals:
Bullish Divergence
- • Price makes lower lows
- • OBV makes higher lows
- • Suggests accumulation by smart money
- • Often precedes upward price reversals
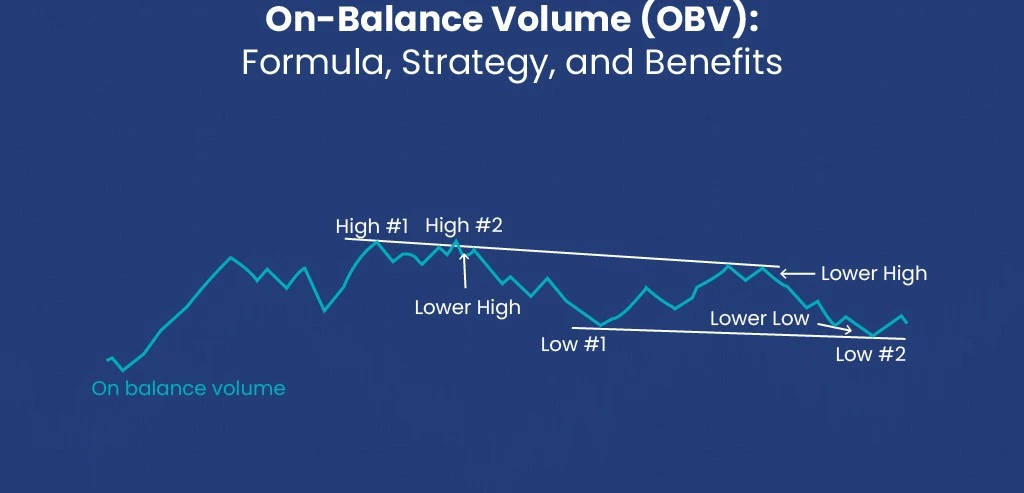
Bearish Divergence
- • Price makes higher highs
- • OBV makes lower highs
- • Indicates distribution by institutions
- • Often precedes downward price reversals
3. Breakout Confirmation
OBV can help validate the authenticity of price breakouts from key support and resistance levels:
- Valid Breakouts: Price breakouts accompanied by OBV breakouts in the same direction indicate genuine moves with volume support
- False Breakouts: Price breakouts without corresponding OBV movement suggest weak volume and potential reversal
- Volume Precedes Price: OBV breakouts often occur before price breakouts, providing early entry opportunities
Advanced OBV Trading Strategies
Strategy 1: OBV Divergence Trading
This strategy focuses on identifying and trading divergences between price and OBV:
Entry Rules:
- • Identify clear divergence between price and OBV
- • Wait for price to break key support/resistance levels
- • Enter trade in direction of expected reversal
- • Use additional confirmation from other indicators
Risk Management:
- • Set stop-loss beyond recent swing high/low
- • Target previous support/resistance levels
- • Use 2:1 or 3:1 risk-reward ratio
- • Monitor OBV for trend continuation signals
Strategy 2: OBV Breakout Strategy
This approach uses OBV to confirm and trade price breakouts from consolidation patterns:
Setup Requirements:
- • Identify consolidation pattern (triangle, rectangle, etc.)
- • Draw trendlines on both price and OBV charts
- • Wait for simultaneous breakouts
- • Confirm with increased volume
Trade Execution:
- • Enter when both price and OBV break trendlines
- • Place stop-loss below/above breakout level
- • Target measured move from pattern
- • Trail stops as trend develops
Strategy 3: OBV Trend Following
This long-term strategy uses OBV to identify and ride strong trends:
Trend Identification:
- • Look for sustained OBV uptrends or downtrends
- • Confirm with price trend in same direction
- • Enter on pullbacks to moving averages
- • Exit when OBV shows signs of trend exhaustion
OBV vs. Other Volume Indicators
| Indicator | Calculation Method | Best Use Case | Key Advantage |
|---|---|---|---|
| OBV | Cumulative volume based on closing price direction | Long-term trend analysis, divergence trading | Simple interpretation, early signals |
| A/D Line | Considers position of close relative to high-low range | Intraday analysis, precise accumulation detection | More sensitive to price positioning |
| Volume-Price Trend | Multiplies volume by percentage price change | Momentum analysis, breakout confirmation | Considers magnitude of price moves |
| Money Flow Index | Volume-weighted RSI using typical price | Overbought/oversold conditions | Bounded oscillator with clear levels |
Common OBV Trading Mistakes to Avoid
❌ Common Mistakes
- • Focusing only on absolute OBV values
- • Ignoring overall market trend context
- • Trading every small divergence
- • Not waiting for price confirmation
- • Using OBV in isolation without other indicators
- • Expecting immediate results from signals
✅ Best Practices
- • Focus on OBV trend direction and slope
- • Consider multiple timeframe analysis
- • Wait for significant divergences to develop
- • Always confirm with price action
- • Combine with momentum and trend indicators
- • Practice patience for signal development
OBV in Different Market Conditions
Trending Markets
In strong trending markets, OBV serves as an excellent trend confirmation tool. Rising OBV during uptrends and falling OBV during downtrends indicate healthy trend continuation. Traders should focus on:
- Using pullbacks in trending markets as entry opportunities when OBV remains strong
- Watching for OBV momentum divergences that might signal trend exhaustion
- Employing trailing stops based on OBV support and resistance levels
Range-Bound Markets
During sideways market phases, OBV can help identify accumulation and distribution patterns:
- Rising OBV during price consolidation suggests accumulation by smart money
- Falling OBV during sideways price action indicates distribution
- OBV breakouts from consolidation patterns often precede price breakouts
Volatile Markets
In highly volatile conditions, OBV helps filter noise and identify genuine moves:
- Price spikes without OBV confirmation are often false moves
- Sustained OBV movement during volatility indicates institutional participation
- Use longer timeframes to smooth out short-term volatility effects
Advanced OBV Analysis Techniques
OBV Moving Averages
Applying moving averages to the OBV line can provide additional insights:
- OBV above its moving average: Indicates bullish volume momentum
- OBV below its moving average: Suggests bearish volume momentum
- Moving average crossovers: Can signal changes in volume momentum direction
OBV Support and Resistance
The OBV line can form its own support and resistance levels that provide trading opportunities:
- Previous OBV highs can act as resistance in future rallies
- Previous OBV lows may provide support during declines
- Breakouts from OBV support/resistance often confirm price movements
Multiple Timeframe OBV Analysis
Analyzing OBV across different timeframes provides a comprehensive view:
- Daily OBV: Shows intermediate-term institutional activity
- Weekly OBV: Reveals long-term accumulation/distribution patterns
- Hourly OBV: Helps with precise entry and exit timing
Limitations and Considerations
While OBV is a powerful tool, traders must understand its limitations:
Key Limitations:
- • Lagging Nature: OBV requires price confirmation, which can delay entries
- • False Signals: Not all divergences lead to price reversals
- • Volume Quality: Cannot distinguish between institutional and retail volume
- • Market Context: Effectiveness varies across different market conditions
- • Single Volume Spikes: Unusual volume events can distort the indicator
Combining OBV with Other Indicators
To maximize effectiveness, OBV should be combined with complementary technical analysis tools:
Trend Indicators
- • Moving Averages
- • MACD
- • ADX
- • Parabolic SAR
Momentum Oscillators
- • RSI
- • Stochastic
- • Williams %R
- • CCI
Support/Resistance
- • Fibonacci Retracements
- • Pivot Points
- • Bollinger Bands
- • Volume Profile
Practical Tips for OBV Trading Success
📊 Chart Analysis Tips
- • Always analyze OBV in context of the overall price trend
- • Look for clear, significant divergences rather than minor variations
- • Pay attention to the slope and acceleration of the OBV line
- • Use multiple timeframes to confirm signals
🎯 Risk Management
- • Never rely solely on OBV signals for trading decisions
- • Set clear stop-loss levels based on technical support/resistance
- • Use position sizing appropriate for signal strength
- • Monitor OBV continuously for trend changes
⏰ Timing Considerations
- • Be patient for clear signal development
- • Consider market hours and volume patterns
- • Avoid trading during low-volume periods
- • Wait for price confirmation before acting on OBV signals
Real-World OBV Trading Examples
Case Study 1: Technology Stock Breakout
In this example, a major technology stock spent several weeks in a consolidation pattern between $150-$160. During this period, while price remained range-bound, OBV showed steady accumulation, rising from 2.5 million to 3.2 million. This divergence between sideways price action and rising OBV suggested institutional accumulation.
When the stock finally broke above $160 resistance, OBV simultaneously broke above its own resistance level, confirming the validity of the breakout. Traders who recognized this OBV accumulation pattern could have positioned themselves ahead of the breakout, which eventually led to a 25% price increase over the following month.
Case Study 2: Banking Sector Distribution
A major banking stock showed a classic bearish divergence pattern during a market rally. While the stock price made new highs at $45, $47, and $48 over three months, the OBV line made successively lower highs, indicating that institutional investors were distributing shares during the price advance.
This distribution pattern preceded a significant decline when negative banking sector news emerged. The stock fell 30% over two weeks, validating the early warning provided by the OBV divergence. Traders who recognized this pattern could have either avoided losses or positioned for the decline.
Conclusion: Mastering On-Balance Volume
On-Balance Volume remains one of the most valuable tools in technical analysis for understanding the relationship between volume and price movement. Its simplicity in calculation belies its sophistication in revealing institutional activity and market sentiment. By focusing on cumulative volume flow, OBV provides insights that traditional price-based indicators often miss.
Success with OBV requires understanding that it's not just about the absolute values, but about the trends, patterns, and relationships between the OBV line and price action. The most powerful signals often come from divergences and confirmations that develop over time, requiring patience and discipline from traders.
Whether you're a swing trader looking for trend reversals, a position trader seeking confirmation of long-term trends, or a day trader timing precise entries, OBV can enhance your trading decisions when used properly. Remember to always combine OBV with other technical analysis tools, maintain proper risk management, and focus on high-probability setups that align with the broader market context.
📚 Key Takeaways:
- • OBV measures cumulative volume flow to predict price movements
- • Focus on trends and divergences rather than absolute values
- • Volume often precedes price, making OBV a leading indicator
- • Combine with other indicators for comprehensive analysis
- • Practice patience and wait for clear signal confirmation
- • Apply proper risk management to all OBV-based trades