Commodity Channel Index (CCI): The Complete Guide to Momentum Analysis
What is the Commodity Channel Index (CCI)?
The Commodity Channel Index (CCI) is one of the most versatile and widely-used momentum oscillators in technical analysis. Developed by renowned technical analyst Donald Lambert in 1980, the CCI was originally designed to identify cyclical trends in commodity markets. However, its effectiveness and adaptability have made it a popular tool for analyzing all types of financial instruments, including stocks, forex, cryptocurrencies, and bonds.
Despite its name suggesting a focus on commodities, the CCI is a universal momentum indicator that measures the current price level relative to an average price level over a specified period. This unique approach allows traders to identify when an asset is overbought or oversold, detect potential trend reversals, and spot divergences that may signal future price movements.
The genius of the CCI lies in its mathematical foundation, which normalizes price movements regardless of the asset's absolute price level or market volatility. By measuring how far the current price deviates from its statistical mean, the CCI provides clear, actionable signals that work across different markets and timeframes.
Understanding CCI's Core Principles
The Commodity Channel Index operates on several fundamental principles that make it an effective tool for market analysis. At its core, the CCI measures price deviation from a statistical norm, providing insights into market momentum and potential reversal points.
The Statistical Foundation
The CCI is built on the concept of measuring how far prices have moved away from their average. When prices are significantly above their mean, the market may be overbought. When prices are significantly below their mean, the market may be oversold. This statistical approach provides objectivity to market analysis.
Key Components of CCI Analysis
- Typical Price: The foundation of CCI calculation, representing the average of high, low, and closing prices
- Simple Moving Average: The baseline against which price deviations are measured
- Mean Deviation: A measure of volatility that adjusts the indicator for different market conditions
- Constant Factor (0.015): Ensures that approximately 70-80% of CCI values fall within the ±100 range
The CCI Formula: Mathematical Foundation
Understanding the mathematical foundation of the CCI is crucial for proper interpretation and application. The calculation involves several steps that work together to create a normalized momentum oscillator.
Step 1: Calculate Typical Price (TP)
Typical Price = (High + Low + Close) / 3
This represents the average price for each period
Step 2: Calculate Simple Moving Average of TP
SMA(TP) = Sum of Typical Prices over N periods / N
Usually N = 20 periods (default setting)
Step 3: Calculate Mean Deviation
Mean Deviation = Sum of |TP - SMA(TP)| over N periods / N
This measures the average deviation from the mean
Step 4: Calculate CCI Value
CCI = (TP - SMA(TP)) / (0.015 × Mean Deviation)
The final CCI value oscillates around zero
Practical Calculation Example
Let's walk through a practical example to illustrate the CCI calculation process:
Given Data (20-period CCI):
- Current Typical Price = $52.33
- 20-period SMA of Typical Price = $50.75
- 20-period Mean Deviation = $1.20
Calculation:
CCI = ($52.33 - $50.75) / (0.015 × $1.20)
CCI = $1.58 / $0.018
CCI = +87.78
This positive CCI reading of +87.78 indicates that the current price is above average but not yet in overbought territory (above +100).
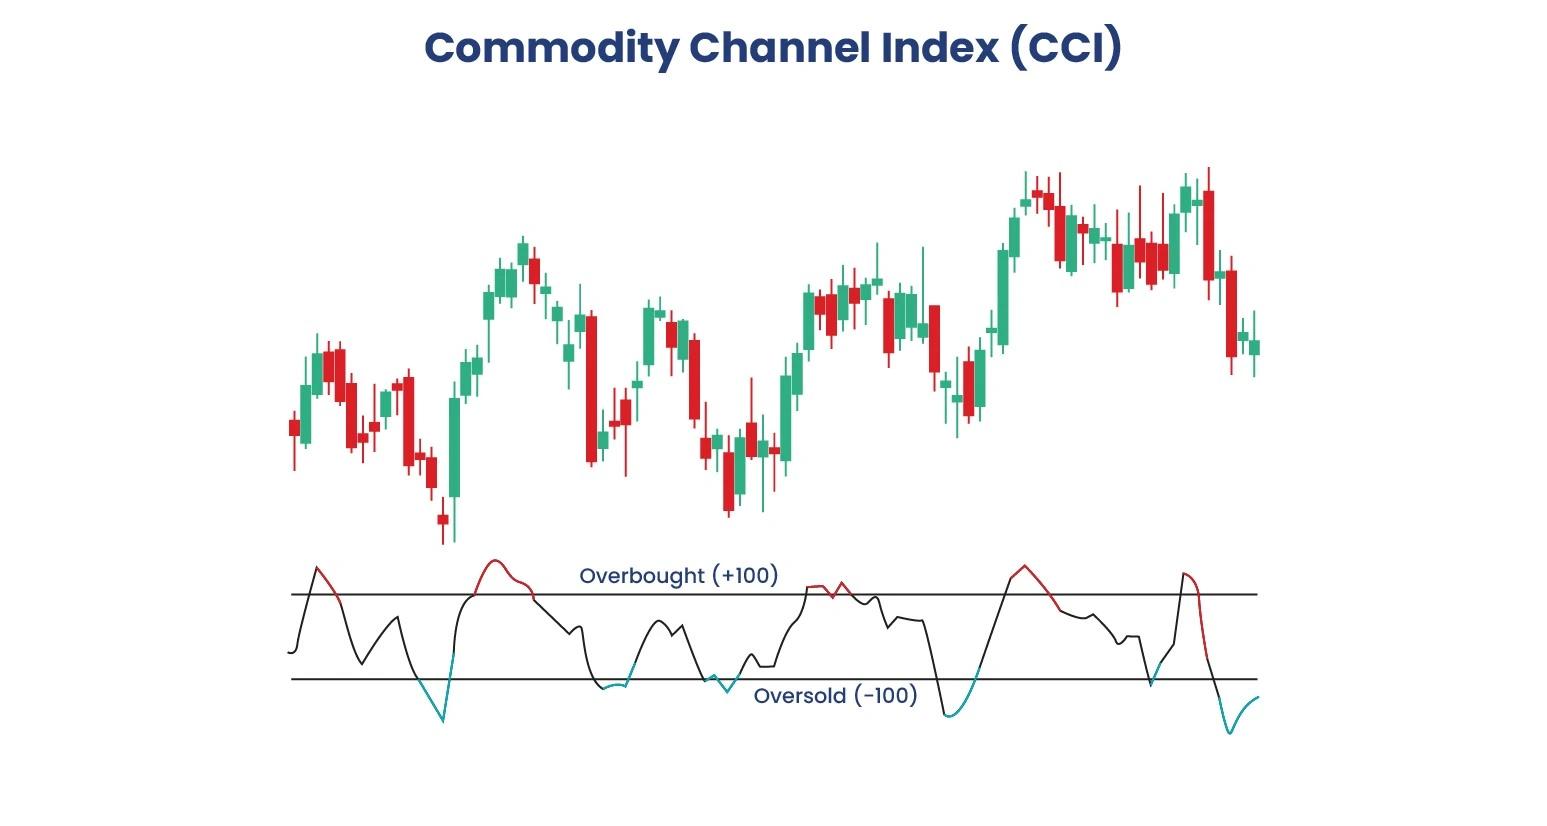
CCI Signal Interpretation
The CCI generates signals through various patterns and threshold crossings. Understanding these signals is crucial for effective trading application.
Primary Signal Zones
- Above +100: Overbought zone - potential selling opportunity or profit-taking
- +100 to 0: Bullish zone - upward momentum but approaching equilibrium
- 0 to -100: Bearish zone - downward momentum but approaching oversold
- Below -100: Oversold zone - potential buying opportunity
Zero Line Significance
The zero line in CCI represents the point where the current typical price equals the moving average. Crossovers of this line often signal momentum shifts:
- Bullish Signal: CCI crosses above zero, indicating upward momentum
- Bearish Signal: CCI crosses below zero, indicating downward momentum
- Trend Strength: The further CCI moves from zero, the stronger the momentum
CCI Trading Strategies
The versatility of the CCI allows for multiple trading approaches, from simple overbought/oversold strategies to complex multi-timeframe analysis. Here are the most effective methods for incorporating CCI into your trading.
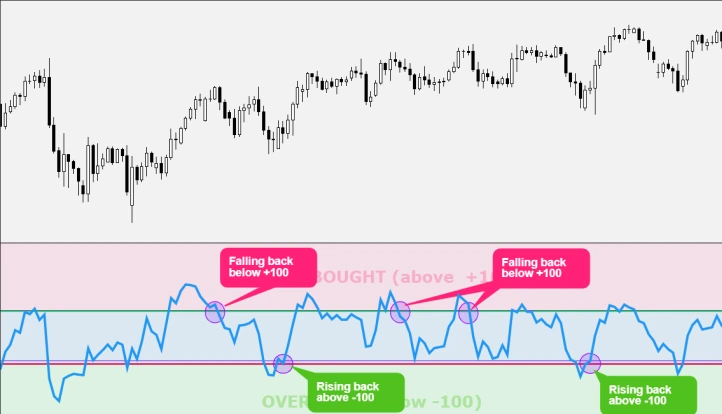
1. Overbought/Oversold Strategy
This is the most straightforward CCI trading approach, ideal for range-bound markets:
- Buy Signal: CCI falls below -100 and then crosses back above -100
- Sell Signal: CCI rises above +100 and then crosses back below +100
- Stop Loss: Place stops at recent swing highs/lows
- Take Profit: Target the opposite extreme or use a fixed risk-reward ratio
2. Zero Line Cross Strategy
This momentum-based strategy works well in trending markets:
- Enter long positions when CCI crosses above zero from below
- Enter short positions when CCI crosses below zero from above
- Hold positions as long as CCI remains on the correct side of zero
- Exit when CCI crosses back through zero in the opposite direction
3. CCI Divergence Strategy
Divergences often provide early warning signs of potential trend reversals:
- Bullish Divergence: Price makes lower lows while CCI makes higher lows
- Bearish Divergence: Price makes higher highs while CCI makes lower highs
- Confirmation: Wait for price action confirmation before entering trades
- Target: Look for moves toward the previous swing high/low
4. Multi-Timeframe CCI Analysis
Using CCI across multiple timeframes increases signal reliability:
- Higher Timeframe: Determine overall trend direction (daily for swing trading)
- Lower Timeframe: Fine-tune entry timing (4-hour for swing trading)
- Alignment: Only take trades when both timeframes align
- Confirmation: Use additional indicators for extra confirmation
Optimizing CCI Settings
While the default 20-period setting works well for most applications, optimizing CCI parameters for specific markets and timeframes can significantly improve performance.
Period Adjustments
- Shorter Periods (10-14): More sensitive to price changes, suitable for day trading and scalping
- Standard Period (20): Balanced approach, good for most swing trading applications
- Longer Periods (30-50): Smoother signals, better for position trading and long-term analysis
Threshold Adjustments
The standard ±100 levels can be adjusted based on market volatility:
- Low Volatility Markets: Use ±75 for more frequent signals
- High Volatility Markets: Use ±150 or ±200 to avoid false signals
- Trending Markets: Consider using only one threshold (e.g., -100 for long entries in uptrends)
Market-Specific Optimizations
- Forex Markets: 14-period CCI often works well due to currency pair correlations
- Stock Markets: 20-period remains optimal for most individual stocks
- Cryptocurrency: Consider 10-14 periods due to higher volatility
- Commodities: Original 20-period setting still performs well in the intended market
Combining CCI with Other Indicators
While powerful on its own, the CCI becomes even more effective when combined with complementary technical analysis tools. These combinations help filter false signals and provide additional confirmation.
CCI + Moving Averages
Moving averages provide trend context for CCI signals:
- Trend Filter: Only take CCI signals in the direction of the major trend (200 MA)
- Support/Resistance: Use key MAs as additional confirmation levels
- Multiple MAs: Combine with 20/50 MA crossovers for stronger signals
- Dynamic Levels: MAs can act as dynamic support/resistance for CCI reversals
CCI + RSI Combination
The combination of two momentum oscillators provides robust signal confirmation:
- Double Confirmation: CCI overbought + RSI overbought = stronger sell signal
- Divergence Confirmation: Both indicators showing divergence increases reliability
- Momentum Alignment: Both oscillators crossing their respective zero/50 lines
- Timeframe Analysis: Use CCI on one timeframe, RSI on another for perspective
CCI + Volume Analysis
Volume provides crucial confirmation for CCI signals:
- Volume Confirmation: High volume on CCI signal crossings indicates stronger moves
- Volume Divergence: Declining volume with CCI extremes may signal reversal
- Breakout Validation: Use volume to confirm CCI threshold breakouts
- Trend Strength: Increasing volume in trend direction supports CCI momentum signals
CCI + Bollinger Bands Strategy
Bollinger Bands complement CCI by providing price-based overbought/oversold levels:
- Look for CCI oversold readings when price touches lower Bollinger Band
- Seek CCI overbought readings when price approaches upper Bollinger Band
- Use Bollinger Band squeezes to anticipate CCI breakout signals
- Combine CCI zero line crosses with Bollinger Band centerline crosses
Advanced CCI Techniques
As you become more proficient with basic CCI strategies, these advanced techniques can help extract additional value from this versatile indicator.
CCI Trendline Analysis
Drawing trendlines on the CCI itself can provide early warning signals:
- CCI Trendlines: Draw trendlines connecting CCI highs and lows
- Early Signals: CCI trendline breaks often precede price trendline breaks
- Support/Resistance: CCI levels can act as support/resistance on the indicator
- Pattern Recognition: Look for triangles, channels, and other patterns in CCI
Multiple CCI Strategy
Using multiple CCI indicators with different periods provides layered analysis:
- Fast CCI (10): For short-term signals and scalping opportunities
- Medium CCI (20): Standard setting for most trading decisions
- Slow CCI (50): For long-term trend identification and major signals
- Signal Hierarchy: Prioritize signals when multiple CCIs align
CCI-Based Price Targets
Use CCI extremes to project potential price targets:
- Measure typical CCI extreme levels for the asset (e.g., ±150)
- Calculate corresponding price levels based on CCI formula
- Use these levels as potential reversal zones
- Adjust targets based on market volatility and trend strength
Risk Management with CCI
Effective risk management is crucial when trading with any technical indicator. The CCI provides several natural risk management opportunities when properly applied.
Stop Loss Strategies
- Technical Stops: Place stops beyond key support/resistance levels identified with CCI
- Indicator Stops: Exit when CCI crosses back through the signal threshold
- Time Stops: Exit if CCI doesn't confirm the expected move within a set time
- Volatility Stops: Use ATR-based stops adjusted for current market volatility
Position Sizing Considerations
- Signal Strength: Larger positions for strong CCI signals with multiple confirmations
- Market Conditions: Reduce size during choppy or low-volume periods
- Risk Per Trade: Never risk more than 1-2% of capital on any single CCI signal
- Portfolio Heat: Limit total portfolio risk across all open CCI-based positions
Market Condition Awareness
CCI performance varies significantly with market conditions:
- Trending Markets: Focus on momentum signals and zero line crosses
- Ranging Markets: Emphasize overbought/oversold mean reversion strategies
- High Volatility: Widen thresholds and use longer confirmation periods
- Low Volatility: Tighten thresholds but watch for false breakouts
Common CCI Mistakes and How to Avoid Them
Understanding common pitfalls helps traders avoid costly mistakes when using the CCI indicator.
1. Rigid Threshold Adherence
Mistake: Treating ±100 levels as absolute buy/sell signals regardless of market context.
Solution: Adjust thresholds based on market volatility and use additional confirmation signals. Consider the overall trend and market conditions.
2. Ignoring Market Trends
Mistake: Taking contrarian CCI signals against strong underlying trends.
Solution: Always consider the broader market trend. Use trend-following strategies in trending markets and mean reversion in ranging markets.
3. Over-Optimization
Mistake: Constantly changing CCI settings based on recent performance.
Solution: Test settings thoroughly across different market conditions. Stick with proven parameters unless fundamental market characteristics change.
4. Lack of Confirmation
Mistake: Entering trades based solely on CCI signals without additional confirmation.
Solution: Always use CCI in combination with other technical analysis tools such as price action, volume, or complementary indicators.
CCI Performance Analysis
Regular performance analysis helps optimize CCI trading strategies and identify areas for improvement.
Key Performance Metrics
- Win Rate: Percentage of profitable trades (target 50-60% for mean reversion strategies)
- Average Win/Loss Ratio: Should be at least 1.2:1 for sustainable profitability
- Maximum Drawdown: Largest peak-to-trough decline (keep under 15%)
- Profit Factor: Gross profit divided by gross loss (target 1.4 or higher)
- Signal Frequency: Number of signals per time period (balance quality vs. quantity)
Backtesting Considerations
- Sufficient Data: Use at least 2-3 years of historical data for robust testing
- Market Cycles: Ensure testing covers different market conditions (bull, bear, sideways)
- Transaction Costs: Include realistic spreads, commissions, and slippage
- Walk-Forward Analysis: Periodically re-optimize and test strategies forward
- Out-of-Sample Testing: Reserve 20-30% of data for final validation
Limitations and Considerations
Like all technical indicators, the CCI has limitations that traders must understand and accommodate.
Market Environment Dependencies
- Trending Markets: CCI can remain in extreme zones for extended periods
- Ranging Markets: May generate excessive false signals during choppy conditions
- Low Volume Markets: Signals may be less reliable during thin trading periods
- News-Driven Markets: Technical signals may be overwhelmed by fundamental developments
Inherent Limitations
- Lagging Nature: CCI confirms price movements rather than predicting them
- False Signals: Can generate whipsaws in consolidating markets
- No Price Targets: Doesn't provide specific profit target levels
- Subjectivity: Interpretation of signals can vary between traders
CCI in Different Market Conditions
Bull Markets
In bull markets, modify your CCI approach:
- Focus on oversold bounces rather than overbought sell signals
- Use zero line crosses for trend continuation entries
- Raise overbought thresholds to +150 or +200
- Combine with upward-sloping moving averages for confirmation
Bear Markets
During bear markets, adapt your strategy:
- Emphasize overbought sell signals over oversold buy signals
- Lower oversold thresholds to -150 or -200
- Use rallies to zero line as shorting opportunities
- Be more aggressive with stop losses on long positions
Sideways Markets
Range-bound markets offer the best conditions for traditional CCI strategies:
- Use standard ±100 thresholds for mean reversion trades
- Take profits quickly when signals reach opposite extremes
- Avoid trading during low-volume consolidation phases
- Watch for breakout signals that might end the ranging period
Conclusion: Mastering the CCI Indicator
The Commodity Channel Index stands as one of technical analysis's most versatile and effective momentum oscillators. Its unique mathematical foundation, which measures price deviation from statistical norms, provides traders with objective insights into market momentum and potential reversal points across all asset classes and timeframes.
The key to successful CCI trading lies in understanding its strengths and limitations while adapting its application to current market conditions. Whether you're identifying overbought and oversold conditions, spotting divergences, or confirming trend changes, the CCI provides clear, actionable signals when properly interpreted.
Remember that the CCI is most effective when used as part of a comprehensive trading strategy that includes proper risk management, multiple timeframe analysis, and confirmation from other technical indicators. The indicator's flexibility allows for customization based on trading style, market volatility, and specific asset characteristics.
As with any technical tool, practice and experience are essential for mastering the CCI. Start with the standard 20-period setting and ±100 thresholds, then gradually experiment with adjustments as you gain confidence and understanding. Most importantly, always combine CCI analysis with sound money management principles and realistic expectations about market behavior.
Key Takeaways
- CCI measures price deviation from statistical mean, providing objective momentum analysis
- Default settings (20 periods, ±100 thresholds) work well for most applications
- Zero line crossovers signal momentum shifts; extreme levels indicate overbought/oversold conditions
- Most effective when combined with trend analysis, volume, and other technical indicators
- Divergences between price and CCI often signal potential trend reversals
- Adjust thresholds and periods based on market volatility and trading timeframe
- Always use proper risk management and position sizing with CCI-based strategies