Parabolic SAR: Stop and Reverse Analysis
What is the Parabolic SAR Indicator?
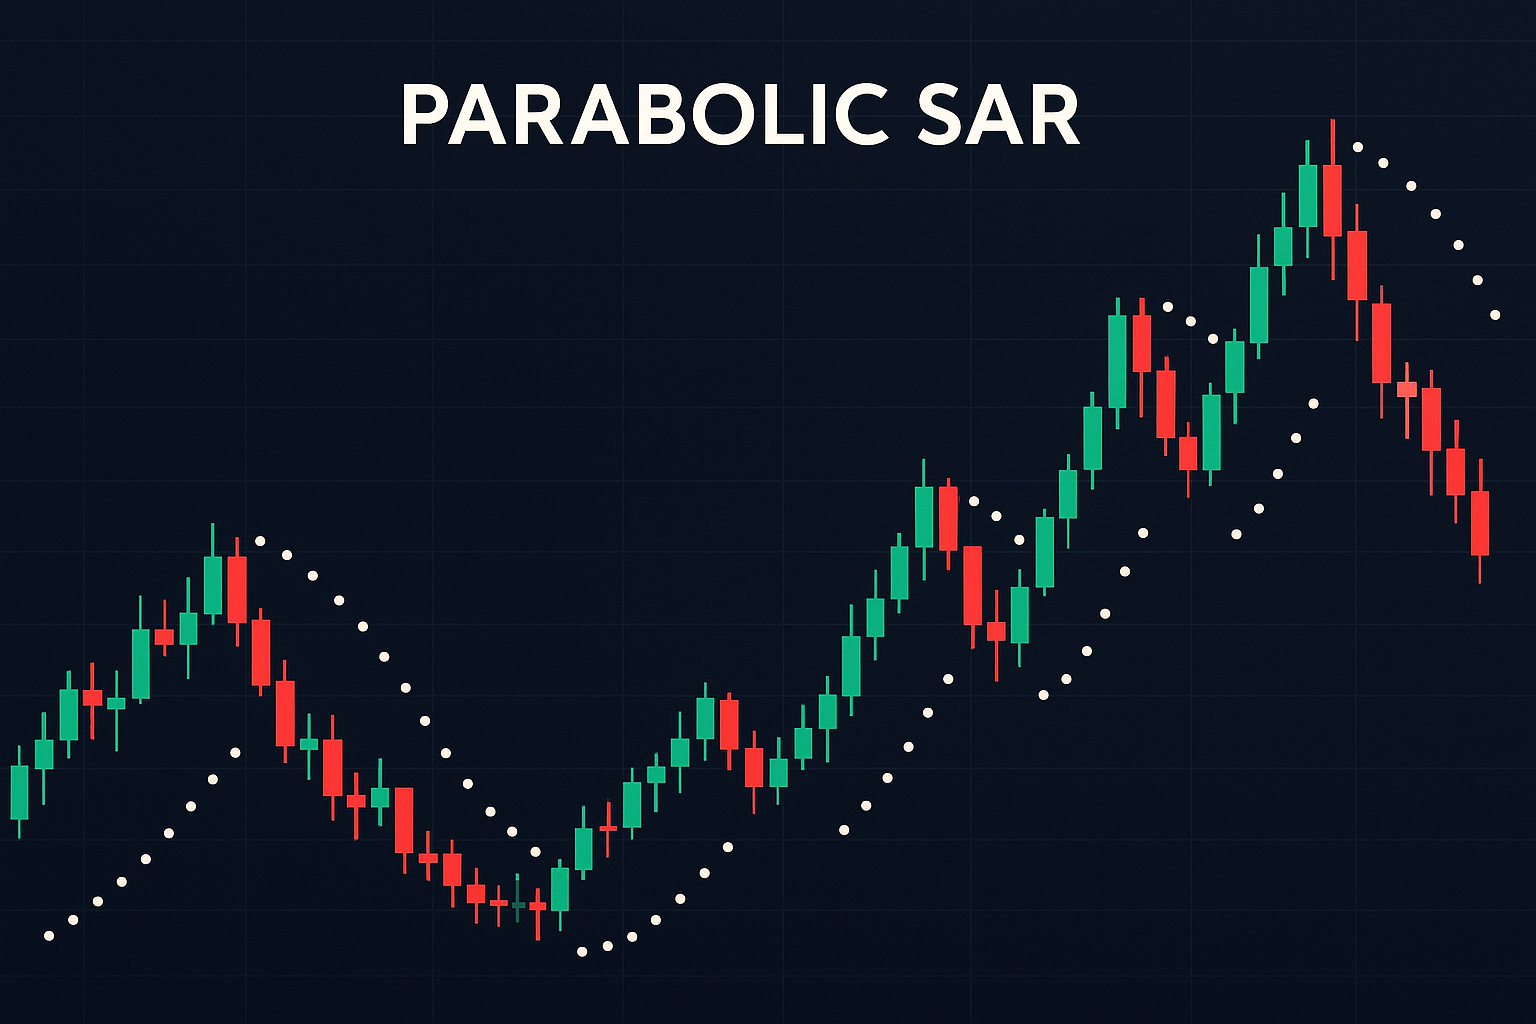
The Parabolic SAR (Stop and Reverse) is a trend-following indicator developed by J. Welles Wilder Jr. in the late 1970s and introduced in his groundbreaking book "New Concepts in Technical Trading Systems." The indicator provides potential entry and exit points through a series of dots plotted above or below price action, creating a unique visual representation of market trends.
The name "Parabolic" comes from the curved, parabolic shape the dots create as they accelerate with the trend, while "SAR" stands for "Stop and Reverse" - indicating its dual function as both a trend indicator and a stop-loss mechanism. When the dots flip from one side of the price to the other, it signals a potential trend reversal and a point where traders should stop their current position and reverse to the opposite direction.
Wilder designed the Parabolic SAR to capture the majority of a trend while providing clear, objective signals for entry and exit. Unlike many indicators that require subjective interpretation, the SAR provides binary signals - either you're long (dots below price) or short (dots above price), making it particularly appealing to systematic traders and algorithmic systems.
J. Welles Wilder Jr.: The Genius Behind the System
J. Welles Wilder Jr. stands as one of the most influential figures in technical analysis history. A mechanical engineer turned trader, Wilder brought mathematical precision to market analysis, developing several indicators that remain cornerstones of technical analysis today, including the RSI, ADX, ATR, and the Parabolic SAR.
Wilder's background in engineering influenced his systematic approach to trading. He believed that successful trading required objective, mathematical rules rather than subjective interpretation. The Parabolic SAR exemplifies this philosophy - it provides clear, unambiguous signals that remove emotional decision-making from the trading process.
Originally developed for commodity markets, the Parabolic SAR was designed to work in trending environments where prices show sustained directional movement. Wilder recognized that the biggest profits in trading come from riding trends, and the SAR was his solution for staying with trends while protecting profits through automatic stop-loss adjustments.
Parabolic SAR Calculation: Understanding the Mathematics
The Parabolic SAR calculation involves three key components that work together to create the characteristic dots and their acceleration pattern:
Core Parabolic SAR Formula:
Key Components Explained:
1. Acceleration Factor (AF)
- Starting Value: 0.02 (2%)
- Increment: 0.02 for each new extreme point
- Maximum Value: 0.20 (20%)
- Purpose: Controls the speed at which SAR approaches price
2. Extreme Point (EP)
- In Uptrends: The highest high reached since the trend began
- In Downtrends: The lowest low reached since the trend began
- Updates: Only when a new extreme is reached
- Drives: The direction of SAR movement
3. Stop and Reverse Rules
- Uptrend Rule: SAR never moves down; it only moves up or stays the same
- Downtrend Rule: SAR never moves up; it only moves down or stays the same
- Minimum Movement: SAR must be at least the prior period's high (uptrend) or low (downtrend)
Step-by-Step Calculation Process:
Step 1: Initialize the System
• First SAR = First period's low (for uptrend) or high (for downtrend)
• AF starts at 0.02
• EP = First extreme point in the trend direction
Step 2: Calculate Next SAR
• Apply formula: SAR = Prior SAR + AF × (EP - Prior SAR)
• Check if result violates minimum rules
• Adjust if necessary to prevent SAR from moving against trend
Step 3: Update Components
• Check for new extreme points
• If new extreme found: update EP and increase AF by 0.02 (max 0.20)
• If no new extreme: keep EP and AF unchanged
Step 4: Check for Reversal
• If price crosses SAR: reverse trend direction
• Reset AF to 0.02
• Set new EP to the reversal point extreme
Practical Example:
Day 1: Price = $100, SAR = $98, AF = 0.02, EP = $102
Day 2: New high = $103 (new EP), AF increases to 0.04
SAR = $98 + 0.04 × ($103 - $98) = $98.20
If price breaks below $98.20, trend reverses to bearish
How Parabolic SAR Dots Signal Trend Changes
The Parabolic SAR's visual simplicity makes it one of the most intuitive indicators to interpret. The position and movement of the dots provide clear, unambiguous information about trend direction and potential reversal points:
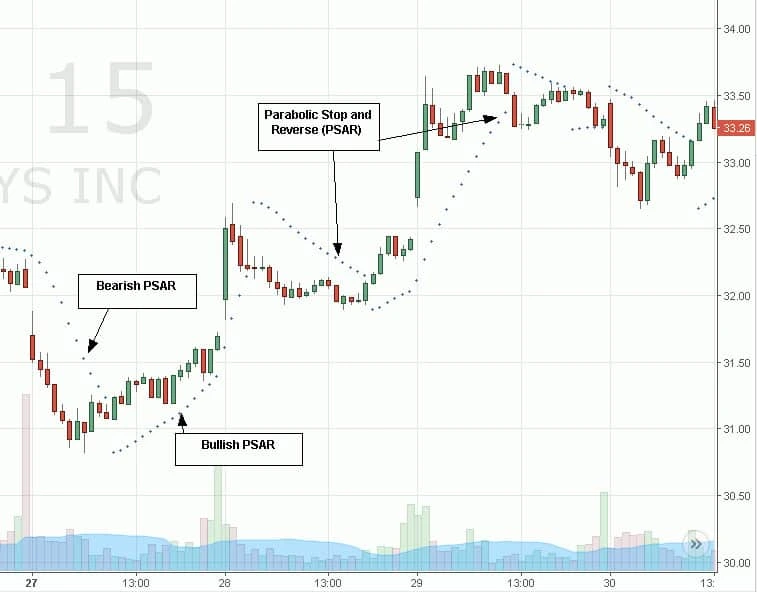
Dot Positioning and Meaning:
🟢 Bullish Configuration
- Dot Position: Below the price candles
- Trend Direction: Upward/Bullish
- Signal: Hold long positions
- Stop Loss: Use SAR level as trailing stop
- Acceleration: Dots move closer to price as trend strengthens
🔴 Bearish Configuration
- Dot Position: Above the price candles
- Trend Direction: Downward/Bearish
- Signal: Hold short positions
- Stop Loss: Use SAR level as trailing stop
- Acceleration: Dots move closer to price as trend strengthens
Understanding Dot Movement and Acceleration:
- Initial Placement: When a trend begins, SAR dots start far from price, providing room for normal fluctuations
- Acceleration Phase: As the trend continues and new extremes are reached, dots accelerate toward price
- Tightening Phase: In mature trends, dots get closer to price, providing tighter stop-loss protection
- Reversal Point: When price touches or crosses a SAR dot, the trend reverses and dots flip to the opposite side
Visual Trend Strength Indicators:
- Wide Gap: Large distance between dots and price indicates strong, established trend
- Narrow Gap: Dots close to price suggest weakening trend or potential reversal
- Consistent Spacing: Evenly spaced dots indicate steady trend momentum
- Rapid Acceleration: Quickly tightening dots suggest accelerating trend
Proven Parabolic SAR Trading Strategies
The Parabolic SAR's versatility allows for multiple trading approaches, each suited to different market conditions and trading styles:
Strategy 1: Basic SAR Reversal System
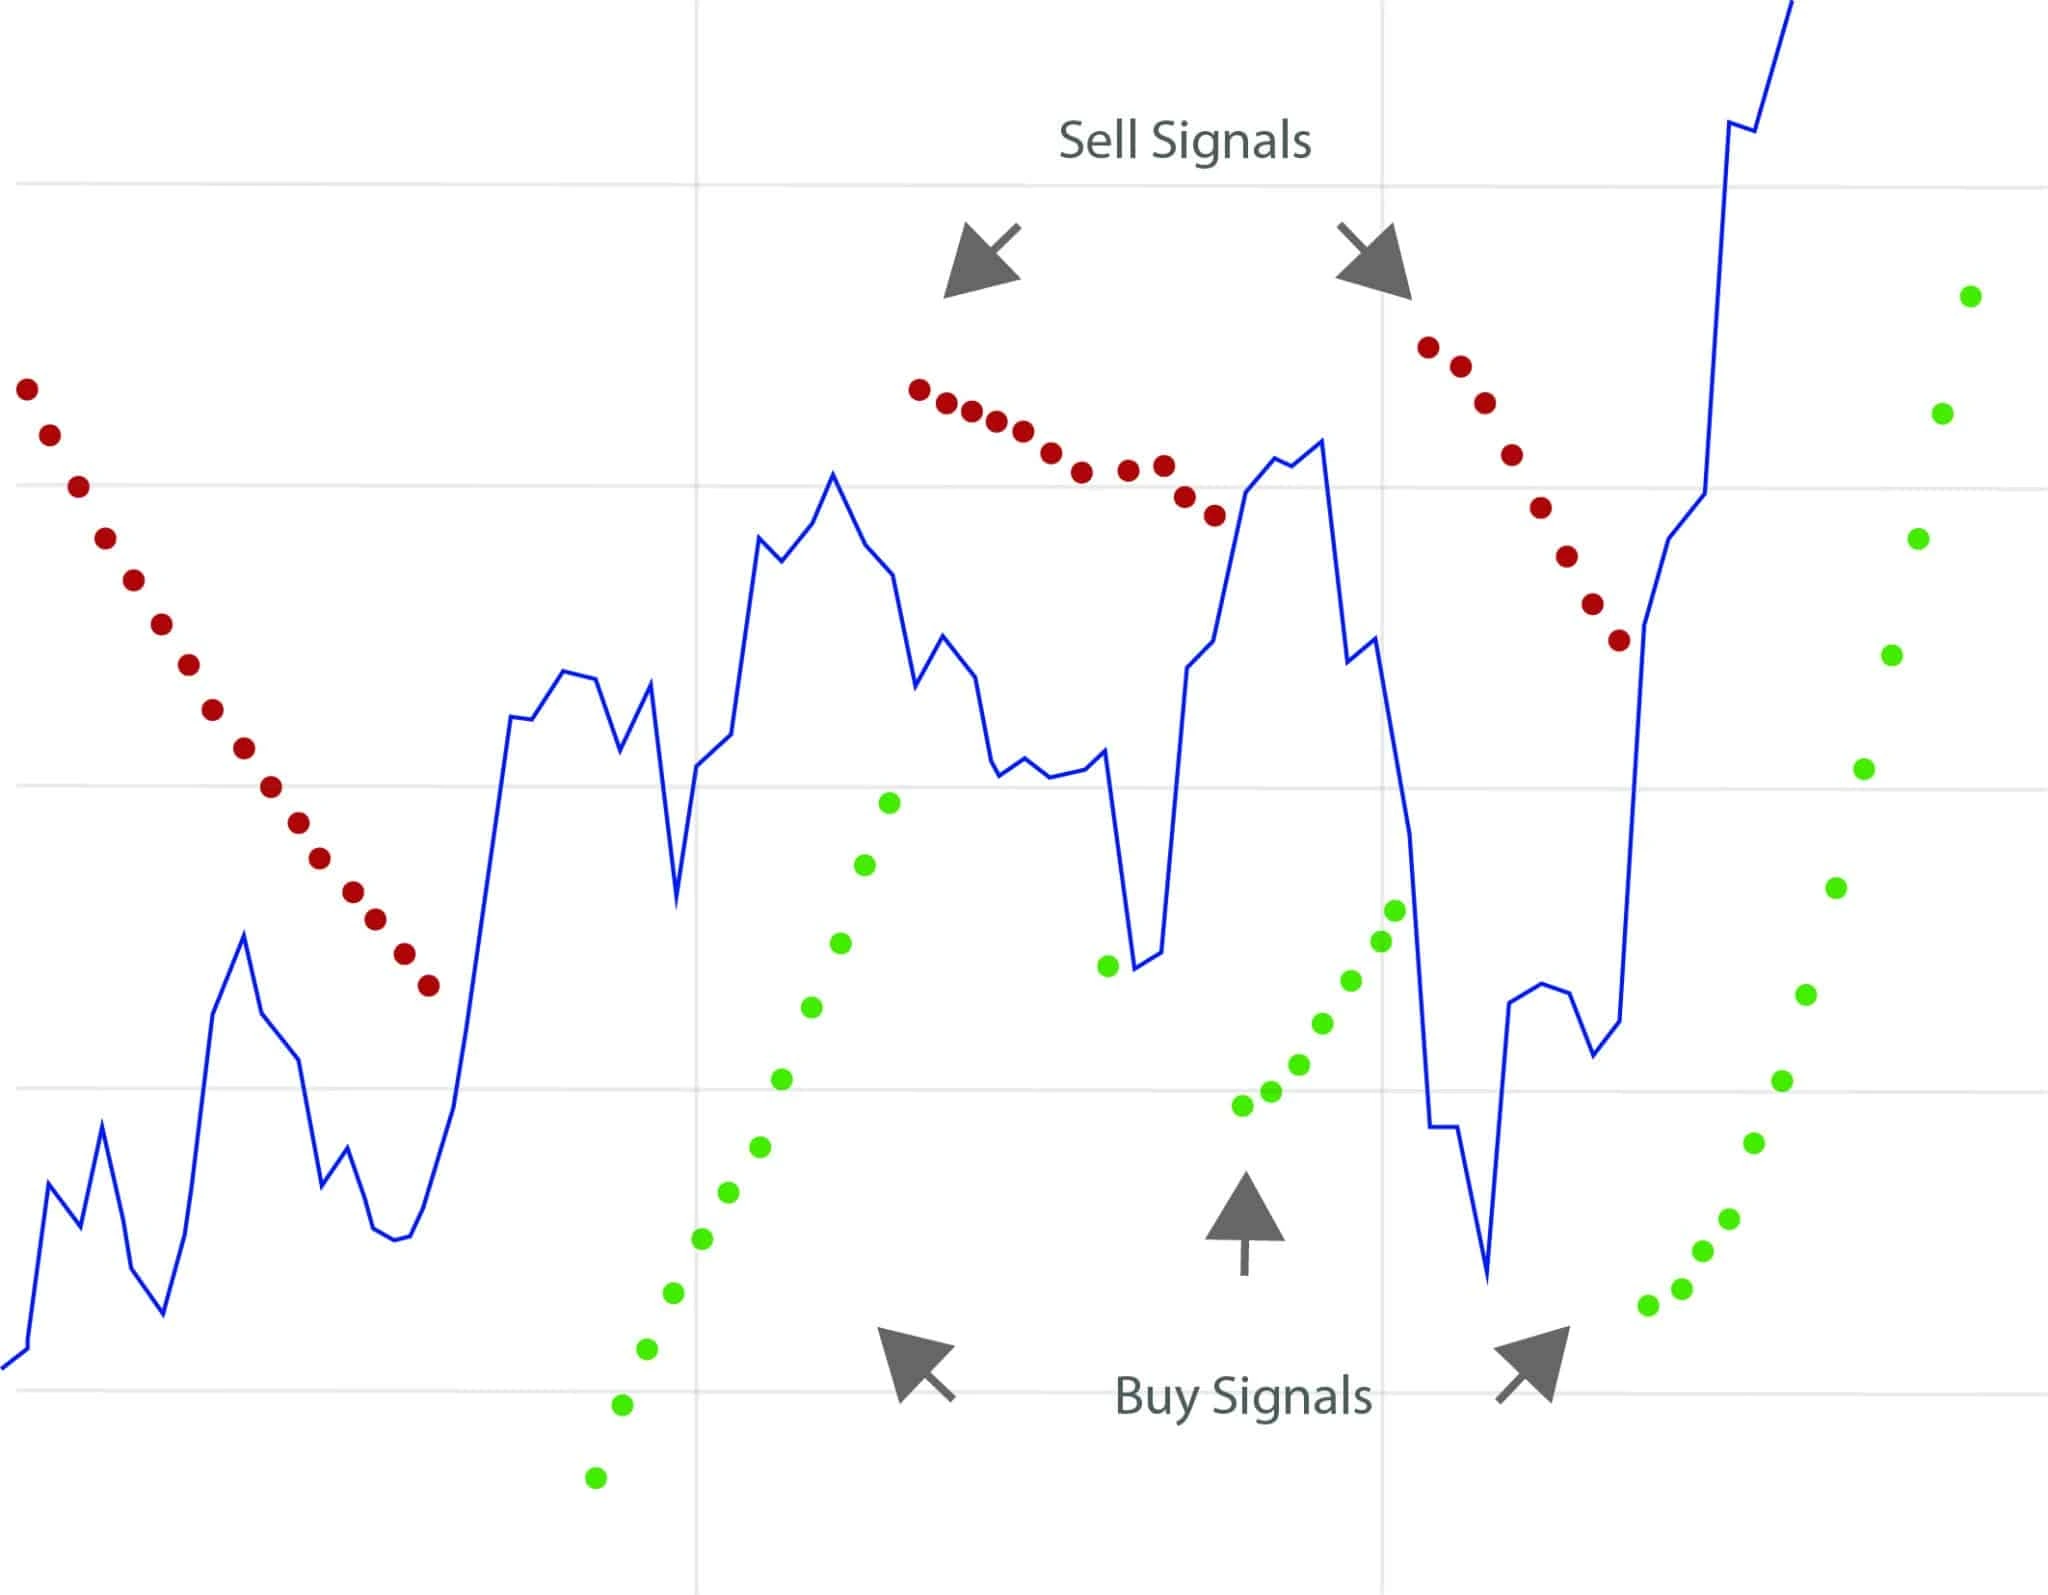
This is the pure implementation of Wilder's original concept:
Long Entry Signal:
- SAR dots flip from above to below price
- Enter long position at market open next candle
- Set initial stop at the SAR level
- Trail stop using subsequent SAR levels
- Exit when SAR flips back above price
Short Entry Signal:
- SAR dots flip from below to above price
- Enter short position at market open next candle
- Set initial stop at the SAR level
- Trail stop using subsequent SAR levels
- Exit when SAR flips back below price
💡 Strategy Advantages:
- Completely objective - no subjective interpretation required
- Always in the market - perfect for systematic trading
- Automatic stop-loss management through trailing stops
- Captures majority of strong trending moves
Conclusion
The Parabolic SAR stands as one of J. Welles Wilder Jr.'s most enduring contributions to technical analysis. Its elegant simplicity - dots that flip sides to signal trend changes - belies the sophisticated mathematics underlying its calculation. This unique indicator serves dual purposes as both a trend-following system and an automatic stop-loss mechanism, making it invaluable for traders seeking systematic approaches to market analysis.
The key to successful Parabolic SAR implementation lies in understanding its strengths and limitations. While it excels in trending markets and provides excellent risk management through trailing stops, it struggles in ranging, choppy conditions where it can generate numerous false signals. The solution is not to abandon the indicator but to enhance it with complementary tools like ADX for trend strength, moving averages for direction bias, and volume analysis for confirmation.
As markets continue to evolve, the Parabolic SAR remains relevant because it addresses fundamental market realities: trends exist, they eventually end, and successful traders must have systems for both capitalizing on trends and protecting profits when they reverse. In this light, Wilder's creation remains as valuable today as when it was first introduced nearly five decades ago.