Supertrend Indicator: The Complete Guide to Trend Following
What is the Supertrend Indicator?
The Supertrend indicator is one of the most effective and widely-used trend-following tools in technical analysis. Developed by renowned French trader Olivier Seban in 2009, this indicator has revolutionized how traders identify and follow market trends. Unlike complex oscillators or multiple-line indicators, the Supertrend provides crystal-clear signals through a single dynamic line that changes color based on market direction.
At its core, the Supertrend indicator combines two fundamental concepts: volatility (measured by Average True Range) and price action. This unique combination creates a robust system that automatically adjusts to changing market conditions, making it equally effective in both high-volatility and calm market environments.
The beauty of the Supertrend lies in its simplicity. When prices are trending upward, the indicator appears as a green line below the price action, acting as dynamic support. Conversely, during downtrends, it shows as a red line above the price, serving as dynamic resistance. This color-coded system makes trend identification instantaneous, even for novice traders.
How the Supertrend Indicator Works
The Supertrend indicator operates on a sophisticated yet elegant principle. It uses the Average True Range (ATR) to measure market volatility and then applies a multiplier to create upper and lower bands around the median price. However, unlike Bollinger Bands or Keltner Channels, the Supertrend displays only one line at a time, switching between the upper and lower bands based on price action.
The Three Key Components
- Median Price: Calculated as (High + Low) / 2, providing the baseline for calculations
- Average True Range (ATR): Measures market volatility over a specified period (typically 10 periods)
- Multiplier: A constant factor (usually 3) that determines the distance of the Supertrend line from the median price
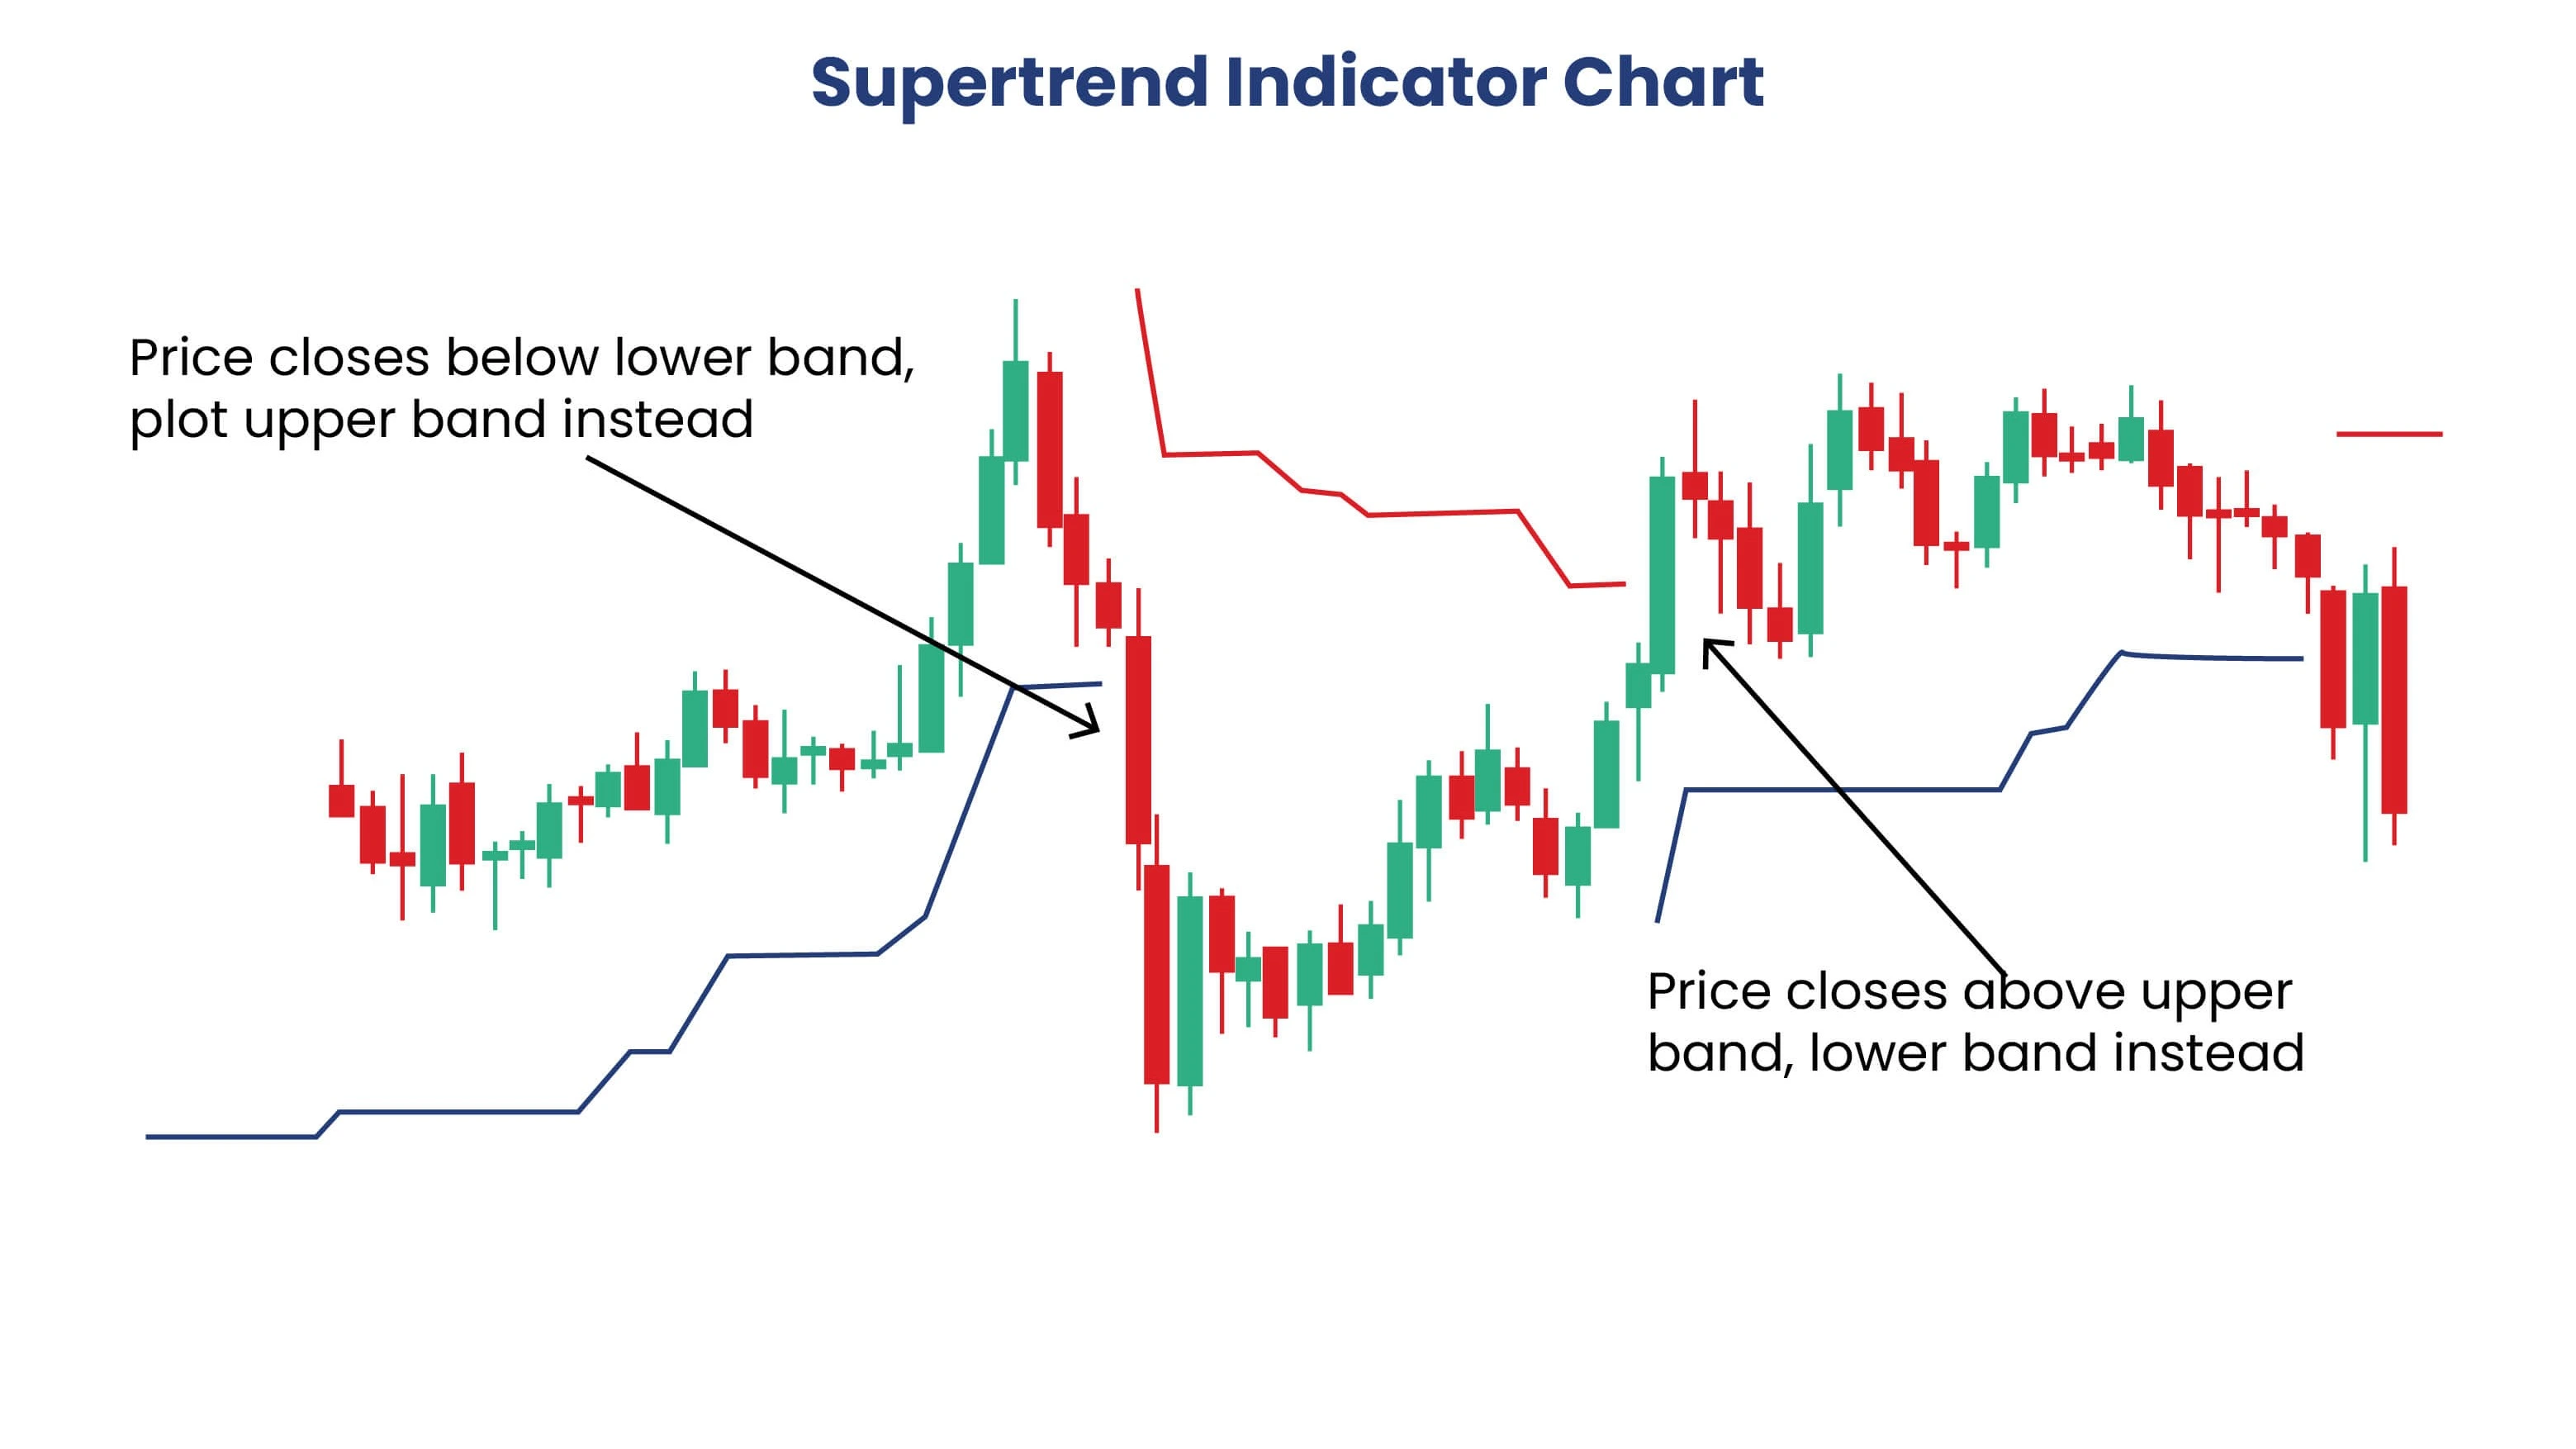
The indicator continuously monitors price action and switches between its upper and lower calculation modes. When price breaks above the upper band, the Supertrend switches to track the lower band (bullish mode). When price breaks below the lower band, it switches to track the upper band (bearish mode).
The Supertrend Formula: Mathematical Foundation
Understanding the mathematical foundation of the Supertrend indicator enhances your ability to optimize its parameters and interpret its signals effectively. The calculation involves several steps that work together to create the final indicator line.
Step 1: Calculate Median Price
Median Price = (High + Low) / 2
This provides the central reference point for the calculation
Step 2: Calculate Average True Range (ATR)
True Range = Max[(High - Low), |High - Previous Close|, |Low - Previous Close|]
ATR = Average of True Range over N periods
Typically N = 10 periods
Step 3: Calculate Upper and Lower Bands
Upper Band = Median Price + (Multiplier × ATR)
Lower Band = Median Price - (Multiplier × ATR)
Multiplier is typically 3
Step 4: Determine Supertrend Value
If Close ≤ Previous Supertrend: Supertrend = Upper Band
If Close > Previous Supertrend: Supertrend = Lower Band
The indicator switches between bands based on price action
Calculation Example
Let's walk through a practical example to illustrate the calculation process:
Given:
- High = $52.40, Low = $51.20
- ATR (10-period) = $0.85
- Multiplier = 3
Calculations:
Median Price = ($52.40 + $51.20) / 2 = $51.80
Upper Band = $51.80 + (3 × $0.85) = $54.35
Lower Band = $51.80 - (3 × $0.85) = $49.25
If the current close is above the previous Supertrend value, the indicator will use the Lower Band ($49.25) and display green. If below, it will use the Upper Band ($54.35) and display red.
Optimizing Supertrend Settings
While the default settings (10 periods, multiplier 3) work well in most market conditions, understanding how to adjust these parameters can significantly improve the indicator's performance for your specific trading style and market environment.
ATR Period Adjustments
- Shorter Periods (7-10): More responsive to recent price changes, ideal for short-term trading and volatile markets
- Standard Period (10-14): Balanced approach suitable for most trading strategies and timeframes
- Longer Periods (15-20): Smoother signals with fewer false breakouts, better for swing trading and position trading
Multiplier Optimization
- Lower Multiplier (2.0-2.5): Tighter stops, more signals, higher win rate but smaller average gains
- Standard Multiplier (3.0): Optimal balance for most market conditions and trading styles
- Higher Multiplier (3.5-4.0): Wider stops, fewer signals, lower win rate but larger average gains
Market-Specific Adjustments
Different markets and timeframes may require specific optimizations:
- Forex Markets: Often perform well with standard settings due to consistent volatility patterns
- Stock Markets: May benefit from slightly higher multipliers (3.5) during earnings seasons
- Cryptocurrency: Higher volatility often requires larger multipliers (4.0-5.0) to avoid whipsaws
- Commodities: Agricultural products may need longer ATR periods due to seasonal volatility
Reading Supertrend Signals
The Supertrend indicator generates clear, unambiguous signals that are easy to interpret once you understand the basic principles. The key is learning to distinguish between high-probability signals and potential false signals.
Primary Trend Signals
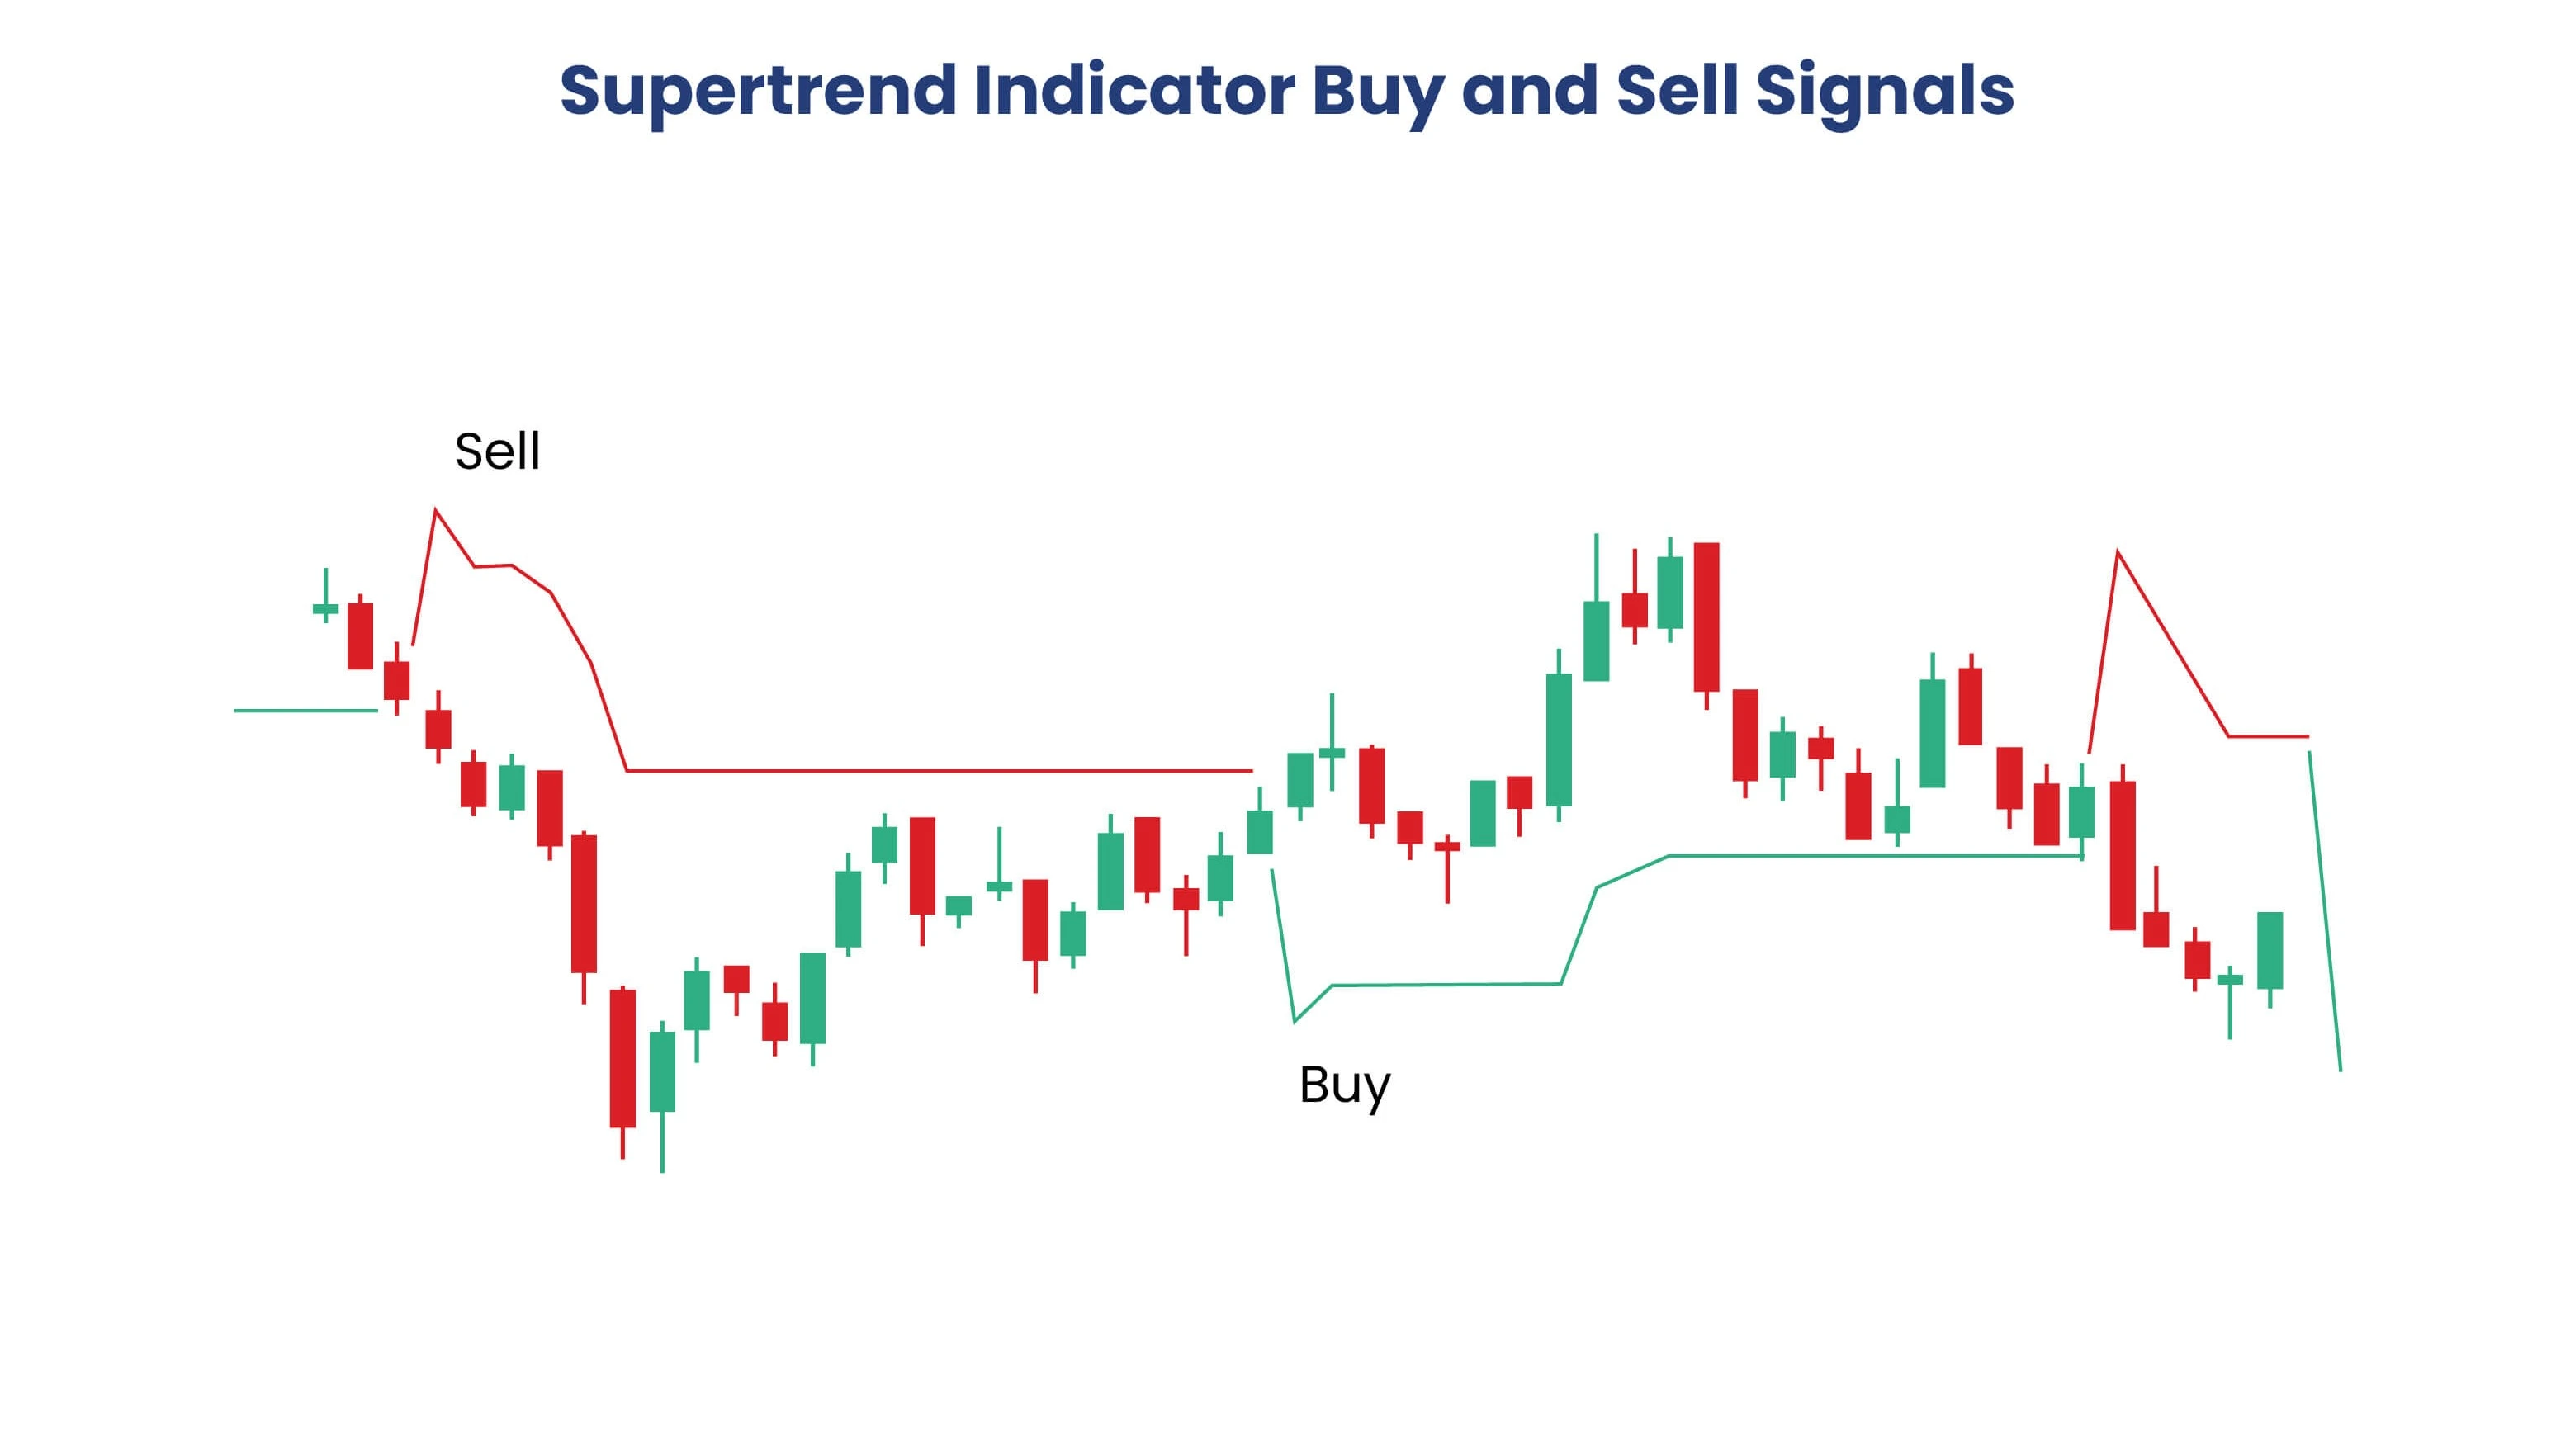
- Bullish Signal: Supertrend changes from red to green, with price closing above the line
- Bearish Signal: Supertrend changes from green to red, with price closing below the line
- Trend Continuation: Price remains on the same side of the Supertrend line with no color changes
Signal Quality Assessment
Not all Supertrend signals are created equal. High-quality signals typically exhibit:
- Volume Confirmation: Increased volume accompanying the signal
- Strong Price Action: Decisive close above/below the Supertrend line
- Market Context: Signal aligns with broader market trend and structure
- Time of Day: Signals during active trading hours tend to be more reliable
Supertrend Trading Strategies
The Supertrend indicator's versatility allows for multiple trading approaches, from simple trend following to complex multi-timeframe strategies. Here are the most effective methods for incorporating Supertrend into your trading arsenal.
1. Basic Trend Following Strategy
This straightforward approach is perfect for beginners and forms the foundation of most Supertrend strategies:
- Entry: Buy when Supertrend turns green, sell when it turns red
- Stop Loss: Place initial stop below/above the Supertrend line
- Take Profit: Exit when Supertrend changes color or use a fixed risk-reward ratio
- Risk Management: Never risk more than 2-3% of capital per trade
2. Pullback Entry Strategy
This advanced strategy improves entry timing by waiting for price to retrace to the Supertrend line:
- Identify established trend (Supertrend showing consistent color)
- Wait for price to pull back to the Supertrend line
- Enter when price bounces off the line with confirmation
- Use the Supertrend line as a trailing stop
3. Multi-Timeframe Approach
Enhance signal reliability by analyzing Supertrend across multiple timeframes:
- Higher Timeframe: Use for overall trend direction (daily for swing trading)
- Entry Timeframe: Use for precise entry signals (4-hour for swing trading)
- Exit Timeframe: Use for fine-tuning exits (1-hour for swing trading)
4. Supertrend Scalping Strategy
For day traders seeking quick profits from short-term moves:
- Use 5-minute or 15-minute charts with tighter settings (7, 2.5)
- Enter on color changes with volume confirmation
- Target quick 1:1 or 1:2 risk-reward ratios
- Exit at predetermined profit targets or opposite signals
Combining Supertrend with Other Indicators
While powerful on its own, the Supertrend indicator becomes even more effective when combined with complementary technical analysis tools. These combinations help filter false signals and provide additional confirmation for trades.
Supertrend + RSI Combination
The Relative Strength Index adds momentum confirmation to Supertrend signals:
- Bullish Setup: Supertrend turns green + RSI above 50 and rising
- Bearish Setup: Supertrend turns red + RSI below 50 and falling
- Divergence Detection: RSI divergence can warn of potential Supertrend reversals
- Overbought/Oversold: Use RSI levels to time entries and exits
Supertrend + Volume Analysis
Volume provides crucial confirmation for Supertrend signals:
- Signal Confirmation: Higher volume on color changes indicates stronger signals
- Trend Strength: Increasing volume in trend direction confirms trend health
- Reversal Warning: Declining volume may signal weakening trends
- Breakout Validation: High volume breakouts are more likely to sustain
Supertrend + Moving Averages
Moving averages provide additional trend context and support/resistance levels:
- Trend Filter: Only take signals in direction of 200-day moving average
- Support/Resistance: Key moving averages act as additional entry/exit levels
- Crossover Confirmation: MA crossovers can confirm Supertrend signals
- Multiple Timeframes: Use MAs from higher timeframes for context
Supertrend + MACD Strategy
MACD provides momentum and divergence analysis to complement Supertrend:
- Wait for Supertrend color change
- Confirm with MACD signal line crossover in same direction
- Enter when both indicators align
- Exit when either indicator gives opposite signal
Risk Management with Supertrend
Effective risk management is crucial for long-term success with any trading strategy. The Supertrend indicator offers several natural risk management features that, when properly utilized, can significantly improve your trading results.
Dynamic Stop Loss Management
One of Supertrend's greatest strengths is its ability to provide dynamic stop loss levels:
- Initial Stops: Place stops at the Supertrend line when entering trades
- Trailing Stops: Move stops with the Supertrend line as it moves favorably
- Breakeven Moves: Move stops to breakeven when price moves significantly in your favor
- Partial Exits: Take partial profits at key levels while letting winners run
Position Sizing Strategies
The distance between entry price and Supertrend line helps determine optimal position sizes:
- Fixed Risk: Risk same dollar amount on each trade regardless of stop distance
- Volatility Adjusted: Smaller positions when stops are far, larger when stops are close
- ATR-Based Sizing: Use ATR value to determine position size for consistent risk
- Portfolio Heat: Never have more than 6-8% total portfolio risk across all open positions
Market Condition Awareness
Supertrend performance varies with market conditions. Adjust your approach accordingly:
- Trending Markets: Ideal conditions for Supertrend strategies
- Ranging Markets: Reduce position sizes and expect more false signals
- High Volatility: Consider wider settings and smaller positions
- Low Volatility: Tighten settings but watch for sudden volatility expansions
Common Supertrend Mistakes and How to Avoid Them
Even experienced traders can fall into common traps when using the Supertrend indicator. Understanding these pitfalls and how to avoid them is crucial for consistent profitability.
1. Ignoring Market Context
Mistake: Taking all Supertrend signals regardless of broader market conditions.
Solution: Always consider overall market trend, key support/resistance levels, and upcoming economic events before entering trades.
2. Over-Optimization
Mistake: Constantly adjusting settings based on recent performance.
Solution: Find settings that work across different market conditions and stick with them. Test thoroughly before making changes.
3. Poor Risk Management
Mistake: Risking too much per trade or not using proper stop losses.
Solution: Always use the Supertrend line as your stop loss and never risk more than 2-3% of your account per trade.
4. Chasing False Breakouts
Mistake: Entering trades immediately on color changes without confirmation.
Solution: Wait for additional confirmation such as volume increase, candlestick patterns, or other indicator alignment.
Advanced Supertrend Techniques
As you become more comfortable with basic Supertrend strategies, these advanced techniques can help you extract even more value from this powerful indicator.
Multiple Supertrend Strategy
Using multiple Supertrend indicators with different settings can provide more nuanced signals:
- Fast Supertrend: (7, 2.5) for early signals and scalping
- Medium Supertrend: (10, 3) for standard trend following
- Slow Supertrend: (14, 3.5) for major trend identification
Enter trades when all three align, exit when the fastest one changes color.
Supertrend Bands Strategy
Instead of using just the indicator line, display both upper and lower bands:
- Treat bands as dynamic support and resistance
- Enter on bounces from the appropriate band
- Exit when price reaches the opposite band
- Use band width to gauge market volatility
News and Event Integration
Combine Supertrend analysis with fundamental events:
- Pre-Event: Reduce position sizes before major announcements
- Post-Event: Look for Supertrend signals that confirm news impact
- Earnings Seasons: Adjust multipliers higher to account for increased volatility
- Central Bank Meetings: Watch for trend changes following policy announcements
Supertrend Performance Analysis
Understanding how to analyze and improve your Supertrend trading performance is essential for long-term success. Regular performance review helps identify strengths and weaknesses in your approach.
Key Performance Metrics
- Win Rate: Percentage of profitable trades (aim for 45-60% with trend following)
- Average Win/Loss Ratio: Should be at least 1.5:1 for sustainable profitability
- Maximum Drawdown: Largest peak-to-trough decline (keep under 20%)
- Profit Factor: Gross profit divided by gross loss (target 1.3 or higher)
- Sharpe Ratio: Risk-adjusted returns (higher is better)
Backtesting Best Practices
Proper backtesting is crucial for validating Supertrend strategies:
- Use Quality Data: Ensure tick-by-tick or at least minute-by-minute data
- Include Costs: Factor in spreads, commissions, and slippage
- Test Multiple Markets: Validate strategy across different instruments
- Out-of-Sample Testing: Reserve 30% of data for validation
- Walk-Forward Analysis: Regularly re-optimize and test forward
Limitations and Considerations
While the Supertrend indicator is highly effective, it's important to understand its limitations to use it appropriately and avoid common pitfalls.
Market Environment Dependencies
- Trending Markets: Supertrend excels in strong, sustained trends
- Ranging Markets: Can produce numerous false signals and whipsaws
- Volatile Markets: May require wider settings to avoid noise
- Low Volume Periods: Signals may be less reliable during thin trading
Inherent Limitations
- Lagging Nature: Like all trend-following indicators, signals come after moves begin
- No Price Targets: Doesn't provide specific profit target levels
- Trend Strength: Doesn't indicate how strong or weak a trend might be
- Reversal Timing: Cannot predict exactly when trends will reverse
Best Practice Guidelines
To maximize Supertrend effectiveness while minimizing limitations:
- Always use in conjunction with other analysis methods
- Adapt settings to current market volatility
- Combine with volume and momentum indicators
- Practice proper risk management at all times
- Regularly review and adjust your approach
Supertrend in Different Market Conditions
Bull Markets
In bull markets, Supertrend shines as a trend-following tool:
- Focus primarily on long signals (green Supertrend)
- Use pullbacks to the line as buying opportunities
- Hold positions longer during strong uptrends
- Be cautious of short signals against the major trend
Bear Markets
During bear markets, adapt your approach accordingly:
- Emphasize short signals (red Supertrend)
- Take profits more quickly on short trades
- Be extra cautious with long positions
- Consider tighter settings to capture shorter-term moves
Sideways Markets
Ranging markets require special consideration:
- Reduce position sizes significantly
- Take profits quickly when available
- Consider using range-trading strategies instead
- Wait for clear breakouts before following Supertrend signals
Conclusion: Mastering the Supertrend Indicator
The Supertrend indicator represents one of the most elegant solutions to trend identification in technical analysis. Its combination of simplicity and effectiveness makes it an invaluable tool for traders at all experience levels. By automatically adapting to market volatility through its ATR-based calculation, the Supertrend provides dynamic support and resistance levels that evolve with changing market conditions.
The key to success with Supertrend lies not just in understanding its calculation and signals, but in recognizing its strengths and limitations. While it excels in trending markets and provides clear, unambiguous signals, it can struggle in ranging conditions and produces lagging signals by nature. The most successful traders combine Supertrend with other analytical tools, maintain strict risk management protocols, and adapt their approach to current market conditions.
Whether you're a day trader seeking quick scalping opportunities, a swing trader looking to capture medium-term trends, or a position trader focusing on major market moves, the Supertrend indicator can be adapted to suit your trading style. The key is finding the right parameter settings for your approach and consistently applying proper risk management principles.
Remember that no single indicator, no matter how powerful, guarantees trading success. The Supertrend should be viewed as one component of a comprehensive trading strategy that includes fundamental analysis, market sentiment assessment, and sound money management practices. With proper application and realistic expectations, the Supertrend indicator can become a cornerstone of your technical analysis toolkit.
Key Takeaways
- Supertrend combines ATR volatility measurement with price action for dynamic trend identification
- Default settings (10, 3) work well for most markets, but optimization can improve performance
- Green line below price indicates uptrend; red line above price indicates downtrend
- Most effective in trending markets; requires caution in ranging conditions
- Works best when combined with volume analysis, momentum indicators, or other technical tools
- Always use proper risk management with stops at the Supertrend line
- Regular performance analysis and strategy adjustment are essential for long-term success