Trend Lines: The Complete Guide to Trading with Diagonal Support and Resistance
What Are Trend Lines?
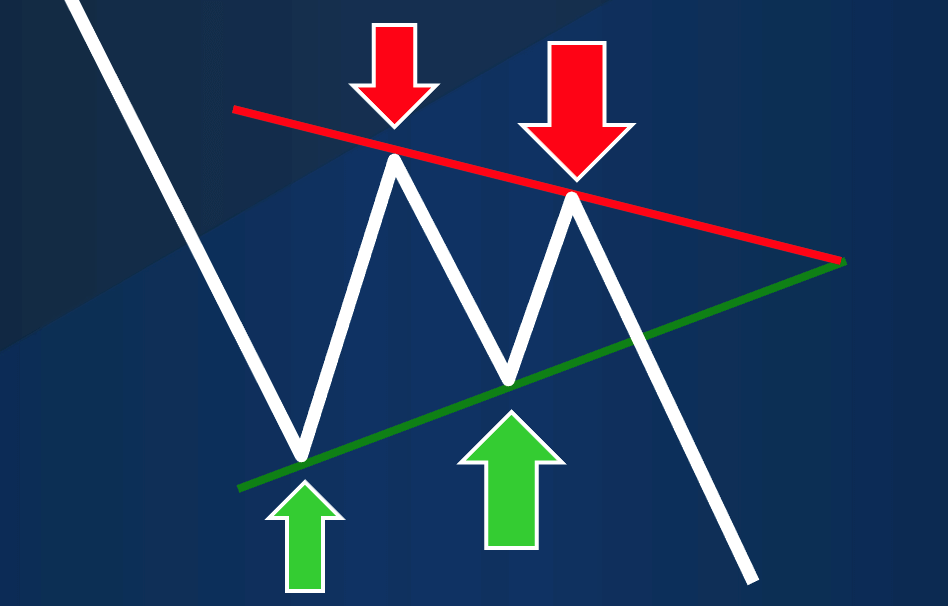
Trend lines are fundamental tools in technical analysis that help traders identify and confirm the direction of market trends. They are straight lines drawn on price charts that connect two or more significant price points, creating a visual representation of the market's direction.
In essence, trend lines serve as diagonal support and resistance levels. They help traders visualize the overall price direction, identify potential reversal points, and make more informed trading decisions based on these visual cues of price momentum.
Trend lines connecting significant price points to show market direction
Types of Trend Lines
There are two primary types of trend lines used in technical analysis, each serving a specific purpose in identifying market trends:
1. Uptrend Lines (Bullish)
An uptrend line is drawn by connecting a series of ascending low points (swing lows) in a rising market. For a valid uptrend line, the second low point must be higher than the first, creating a line with a positive slope. These lines act as dynamic support levels.
Key characteristics:
- Connects higher lows in an uptrend
- Has a positive slope (points upward)
- Acts as support for the price
- Indicates buyer dominance as demand exceeds supply
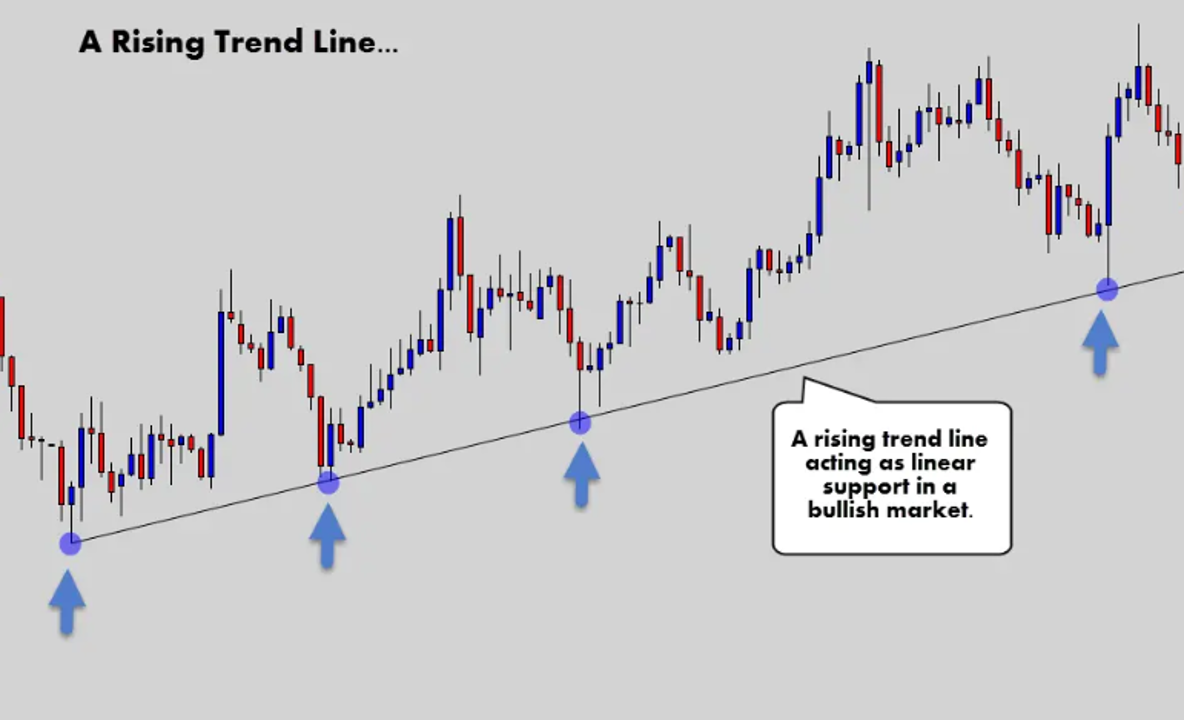
Uptrend line connecting higher lows and acting as support
2. Downtrend Lines (Bearish)
A downtrend line is created by connecting a series of descending high points (swing highs) in a falling market. For a valid downtrend line, the second high point must be lower than the first, creating a line with a negative slope. These lines act as dynamic resistance levels.
Key characteristics:
- Connects lower highs in a downtrend
- Has a negative slope (points downward)
- Acts as resistance for the price
- Indicates seller dominance as supply exceeds demand
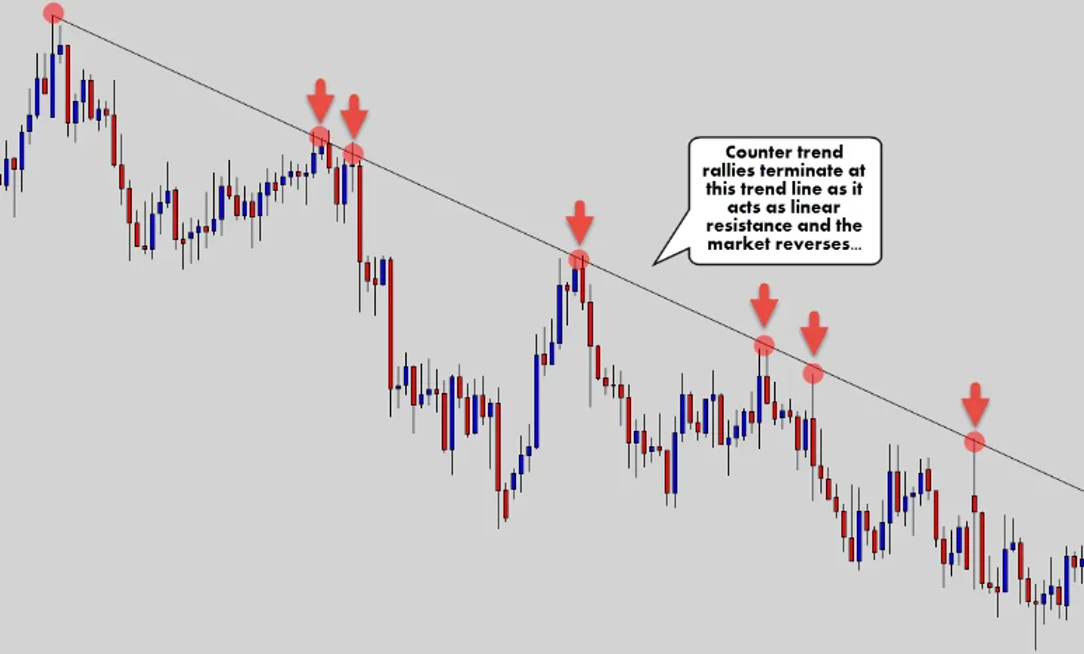
Downtrend line connecting lower highs and acting as resistance
How to Draw Trend Lines Correctly
Drawing accurate trend lines is crucial for effective technical analysis. Follow these guidelines to ensure your trend lines provide reliable signals:
Key Principles for Drawing Trend Lines
- Identify the trend direction: Before drawing trend lines, determine if the market is in an uptrend (higher highs and higher lows) or a downtrend (lower highs and lower lows).
- Connect significant points: For uptrends, connect at least two successive low points. For downtrends, connect at least two successive high points.
- Validate with a third touch: A general rule states, "It takes two points to draw a trend line, and the third point confirms its validity." The more points of contact, the more reliable the trend line.
- Consider spacing between points: The points used to draw trend lines should not be too close together or too far apart. Ideally, use relatively evenly spaced points.
- Watch the angle: Very steep trend lines are less reliable as support or resistance levels. They often result from sharp, unsustainable price movements.
- Use appropriate scaling: Semi-logarithmic charts often work better for long-term trend lines, especially when there are large price changes over time.
- Don't force trend lines to fit: If the points don't line up cleanly, don't force the trend line. Sometimes, internal trend lines that ignore price spikes may be more appropriate.
Common Mistakes to Avoid
- Forcing trend lines to fit: Don't manipulate a trend line to make it work; if it doesn't fit naturally, it's likely not valid.
- Ignoring timeframes: Trend lines on higher timeframes (daily, weekly) are generally more reliable than those on lower timeframes.
- Overreliance on a single tool: Don't base trading decisions solely on trend lines; use them in conjunction with other technical analysis tools.
- Not adjusting trend lines: Markets evolve, and sometimes trend lines need to be redrawn to reflect changing conditions.
The Significance of Multiple Touches
One of the most important factors determining the strength and validity of a trend line is the number of times price touches it without breaking through. Each additional touch provides further confirmation of the trend line's significance.
How Touch Points Strengthen Trend Lines
The relationship between touches and trend line strength works as follows:
- Two points: This is the minimum requirement to draw a trend line, but offers little predictive value on its own.
- Three touches: The third touch provides initial validation that the trend line is significant and being respected by the market.
- Four or more touches: Each additional touch substantially increases the trend line's importance. A trend line that has been tested and respected four or more times is considered highly significant.
Each time the price touches a trend line and reverses, it demonstrates that market participants collectively recognize this level as important. Buyers step in at uptrend line support, and sellers emerge at downtrend line resistance, reinforcing the psychological importance of these levels.
Paradox of Touch Points
While more touches increase a trend line's validity, they also present a paradox: the more times a trend line is tested, the more likely it eventually becomes to break. This occurs because:
- Each test of the trend line may slightly weaken the support/resistance as some traders take profits at these predictable levels
- Very well-established trend lines become obvious to many market participants, potentially creating crowded trades
- Markets constantly evolve, and no trend persists indefinitely
This creates an interesting dynamic where the most reliable trend lines (based on numerous touches) may also be the closest to breaking. Experienced traders remain particularly vigilant after the fourth or fifth touch of a trend line.
Quality vs. Quantity of Touches
While the number of touches is important, the quality of these touches also matters significantly:
- Clear rejections: Touches that result in strong, decisive reversals (such as long-tailed candlesticks) carry more weight than minor touches
- Volume on touches: Touches accompanied by higher volume show greater market participation and conviction
- Time between touches: Touches spread out over longer periods typically indicate more significant trend lines than those occurring over short time frames
- Price distance between touches: Widely spaced touches often create more reliable trend lines than closely clustered ones
The ideal trend line combines both quantity (multiple touches) and quality (strong rejections with volume) to create the most reliable trading signals.
Trend Lines as Support and Resistance
One of the most powerful applications of trend lines is their function as dynamic support and resistance levels. Unlike horizontal support and resistance, trend lines move with the market, providing continuously updated levels where price may reverse.
Trend Lines as Support (Uptrends)
In an uptrend, the trend line acts as a support level where buying interest is expected to be strong enough to prevent the price from falling further. Traders often look for buying opportunities when the price pulls back to test the uptrend line.
Trend Lines as Resistance (Downtrends)
In a downtrend, the trend line serves as a resistance level where selling pressure is expected to overcome buying interest, preventing the price from rising significantly. Traders may look for selling opportunities when the price rallies to test the downtrend line.
Advanced Trend Line Concepts
1. Trend Line Channels
A trend channel is formed by drawing a parallel line to the main trend line, creating a corridor within which the price tends to move. The main trend line serves as support (in an uptrend) or resistance (in a downtrend), while the parallel line represents resistance (in an uptrend) or support (in a downtrend).
Channels provide traders with both potential support and resistance levels, offering more precise entry and exit points as the price oscillates between the channel boundaries.
2. Internal Trend Lines
Internal trend lines are drawn by ignoring price spikes or outliers that distort the overall trend picture. When market volatility creates price spikes that don't align with the general trend, internal trend lines can provide a clearer view of the underlying price direction.
3. Multiple Timeframe Analysis
Drawing trend lines across different timeframes can provide a more comprehensive understanding of market trends. Trend lines on higher timeframes (weekly, monthly) indicate long-term trends, while those on lower timeframes (hourly, daily) show short-term movements.
Aligning trades with trend lines across multiple timeframes can significantly improve trading success, as it ensures you're trading in the direction of both short-term and long-term trends.
Trend Line Trading Strategies
Trend lines are not just analytical tools but can form the basis of effective trading strategies. Here are some of the most popular trend line trading approaches:
1. Trend Line Bounce Strategy
This strategy involves entering trades when the price touches and rebounds from a trend line, continuing in the direction of the prevailing trend.
How to implement:
- Identify a strong uptrend or downtrend with a well-established trend line.
- Wait for the price to pull back to the trend line.
- Look for confirmation of a bounce through price action (such as bullish or bearish candlestick patterns).
- Enter a trade in the direction of the trend after confirmation.
- Place a stop-loss just beyond the trend line in case it breaks.
- Target profits at the previous high (in an uptrend) or low (in a downtrend), or use a risk-reward ratio to determine your take-profit level.
2. Trend Line Breakout Strategy
This strategy focuses on trading breakouts when the price decisively moves through a trend line, potentially signaling a reversal of the prevailing trend.
How to implement:
- Identify a well-established uptrend or downtrend with a clear trend line.
- Watch for a decisive break of the trend line, preferably on higher volume.
- Wait for confirmation, such as a strong close beyond the trend line or a retest of the broken line.
- Enter a trade in the direction of the breakout.
- Place a stop-loss on the opposite side of the trend line.
- Consider using the height of the previous trend as a measure for your profit target.
3. Support/Resistance Flip Strategy
This strategy takes advantage of the principle that once a trend line is broken, it often "flips" its role: a broken support line becomes resistance, and a broken resistance line becomes support.
How to implement:
- Identify a break of a significant trend line.
- Wait for the price to retest the broken trend line from the opposite side.
- Look for rejection at this level (confirming the role flip).
- Enter a trade in the direction of the new trend.
- Place a stop-loss beyond the retested trend line.
- Set a target based on previous support/resistance levels or using a risk-reward ratio.
4. Trend Channel Trading Strategy
This strategy involves trading within the boundaries of a trend channel, buying near the lower boundary and selling near the upper boundary.
How to implement:
- Identify a well-formed trend channel with multiple touches on both the upper and lower lines.
- Look for buying opportunities when the price approaches the lower channel line in an uptrend.
- Look for selling opportunities when the price approaches the upper channel line in a downtrend.
- Confirm entries with candlestick patterns or other technical indicators.
- Place stops beyond the channel boundary.
- Target the opposite channel boundary for exits, or use trailing stops to maximize profits during strong moves.
Combining Trend Lines with Other Technical Tools
While trend lines are powerful on their own, their effectiveness can be enhanced when combined with other technical analysis tools:
Trend Lines with Moving Averages
Moving averages can complement trend lines by providing additional confirmation of trend direction and potential reversal points. When a trend line and a key moving average (such as the 50-day or 200-day MA) align, they create a stronger support or resistance zone.
Trend Lines with Momentum Indicators
Momentum indicators like RSI, MACD, or Stochastic can help confirm trend strength and identify potential reversals. For example, a break of a trend line accompanied by a bearish divergence on RSI provides stronger evidence of a potential trend reversal than either signal alone.
Trend Lines with Volume Analysis
Volume can confirm the validity of trend line breaks or bounces. High volume on a trend line break suggests a more significant trend change, while high volume on a trend line bounce indicates strong support or resistance at that level.
Common Pitfalls and Limitations
While trend lines are valuable tools, they are not without limitations:
- Subjectivity: Different traders might draw trend lines slightly differently, leading to varying interpretations.
- False Breakouts: Price can temporarily break a trend line before resuming the original trend, leading to false signals.
- Not Suitable for All Market Conditions: Trend lines work best in trending markets and may provide less reliable signals in choppy or ranging markets.
- Need for Confirmation: Trend line signals should generally be confirmed by other technical tools or price action before making trading decisions.
Tips for Effective Trend Line Trading
- Practice drawing trend lines regularly to develop a consistent approach.
- Be patient and wait for clear confirmations before acting on trend line signals.
- Adjust trend lines as new price data emerges, especially after significant market moves.
- Use multiple timeframes to gain a more comprehensive view of market trends.
- Combine trend lines with other technical tools for stronger, more reliable signals.
- Always use proper risk management regardless of how strong a trend line signal appears.
Conclusion
Trend lines are among the most versatile and powerful tools in technical analysis, providing clear visual representations of market trends and potential reversal points. When drawn correctly and interpreted with a proper understanding of their strengths and limitations, trend lines can significantly enhance your trading strategy and decision-making process.
Remember that successful trend line trading requires practice, patience, and a comprehensive approach that combines trend line analysis with other technical tools and sound risk management principles.
By mastering the art of drawing and trading with trend lines, you'll add a valuable skill to your technical analysis toolkit that can help you identify profitable trading opportunities across various market conditions and timeframes.