Support and Resistance Trading: The Foundation of Technical Analysis
What are Support and Resistance Levels?
Support and resistance levels are foundational concepts in technical analysis that represent key price zones where market forces tend to temporarily pause or reverse price movements. These levels function as invisible barriers that restrict price, creating opportunities for traders to make high-probability trading decisions.
Support levels are price zones where buying pressure (demand) overcomes selling pressure (supply), causing price to stop falling and potentially reverse upward. These levels act as a "floor" that prevents prices from falling further. Buyers step in at these levels because they perceive the asset to be attractively priced or undervalued.
Resistance levels are price zones where selling pressure (supply) overcomes buying pressure (demand), causing price to stop rising and potentially reverse downward. These levels function as a "ceiling" that prevents prices from rising further. Sellers emerge at these levels because they perceive the asset to be overvalued.
These critical levels form the backbone of market structure and influence decision-making by traders across all markets and timeframes. Understanding how to identify and trade these levels effectively is essential for any technical analysis approach.
Why Support and Resistance Levels Work
Support and resistance levels are effective primarily because of market psychology and the collective behavior of market participants. Several factors contribute to the reliability of these levels:
- Market Memory - Traders remember significant price points where the market previously reversed, and often place orders around these levels during subsequent approaches
- Round Numbers - Psychological price levels (like 1.2000 in forex or $100 in stocks) naturally attract orders and cause reactions
- Institutional Order Clustering - Large market participants often place significant buy and sell orders at key levels based on their analysis
- Self-Fulfilling Prophecy - As more traders observe and trade these levels, they become increasingly effective, reinforcing their importance
- Risk Management Practices - Traders commonly place stop-losses just beyond support or resistance levels, creating clusters of orders that can fuel strong moves when triggered
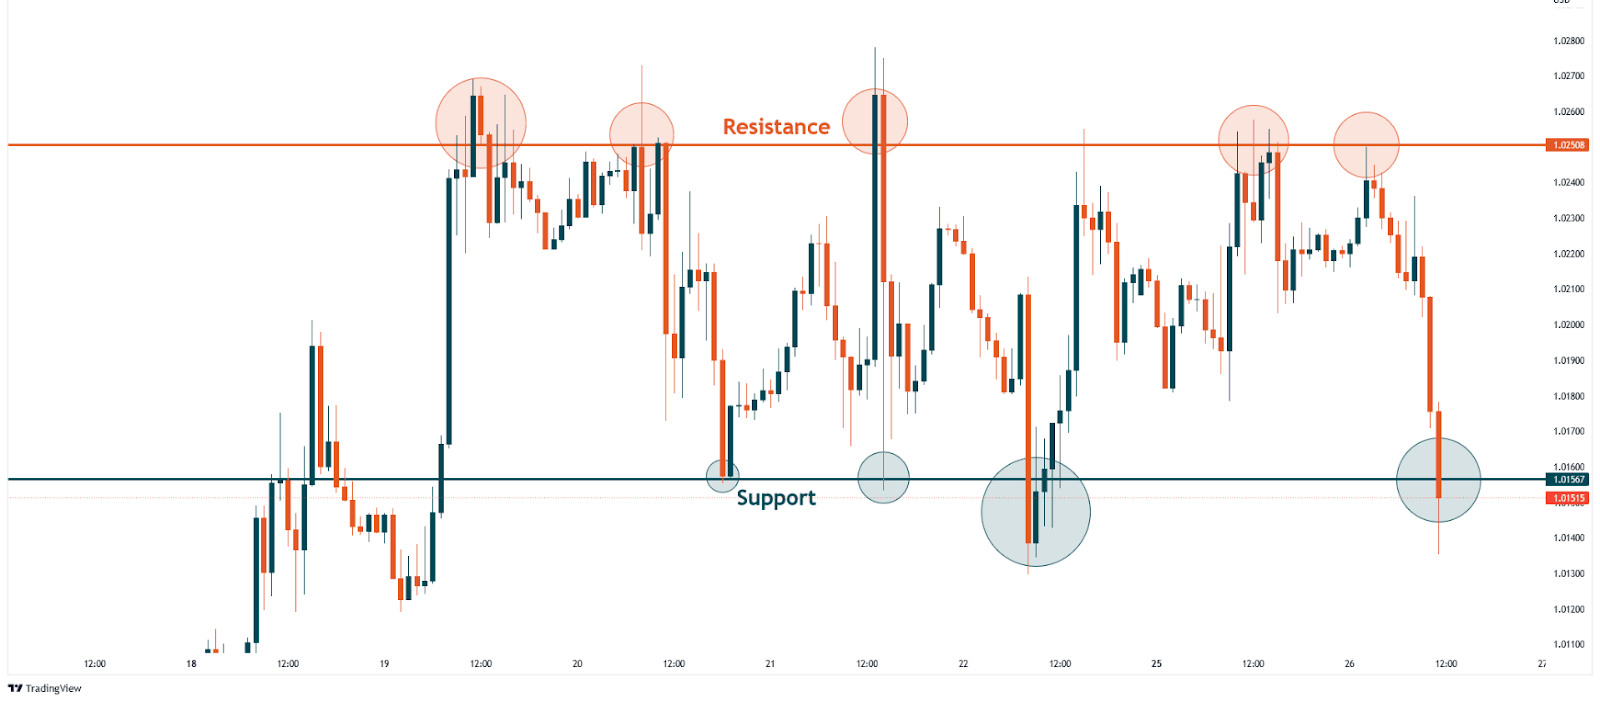
Strength of Support and Resistance Levels
Not all support and resistance levels are created equal. Their strength depends on several key factors:
Number of Times Tested
Weak support level tested only twice
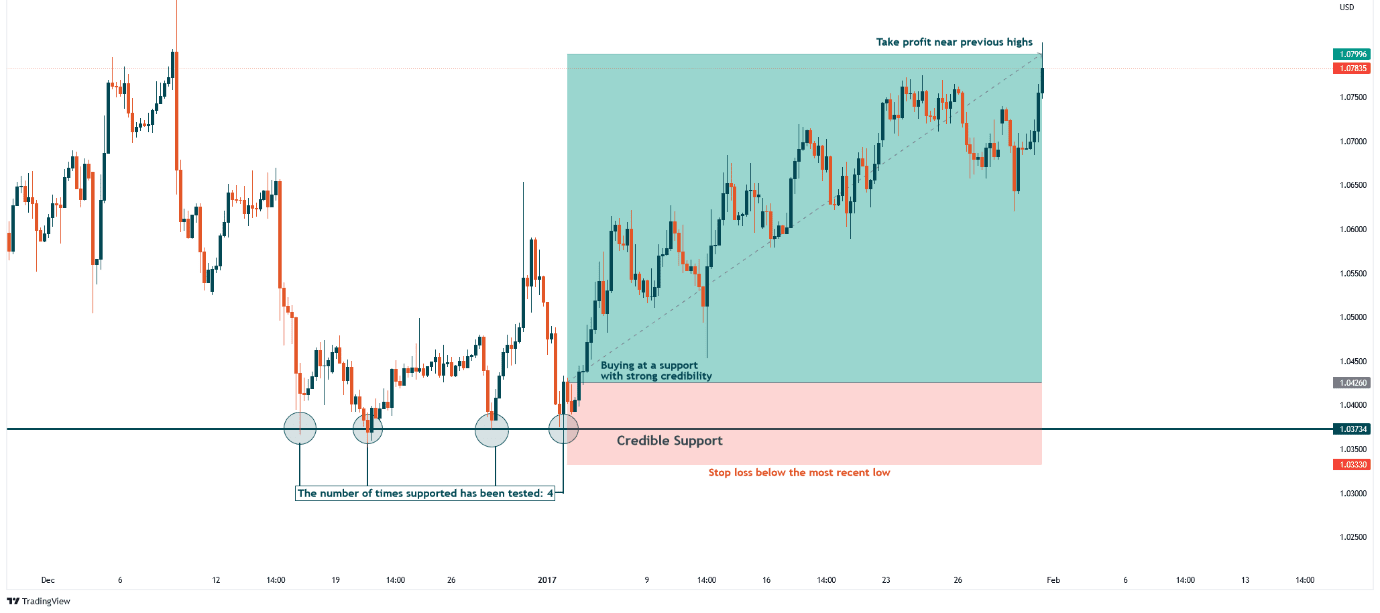
Strong support level tested four times
One of the most important factors determining the strength of a support or resistance level is the number of times it has been tested. Generally, the more times a level has been touched and respected, the stronger it becomes.
As shown in the images, a support level that has been tested only twice (top) is relatively weak compared to a support level that has been tested four times (bottom). Each successful test of the level reinforces its significance as traders gain increased confidence in its validity.
Resistance Strength Comparison
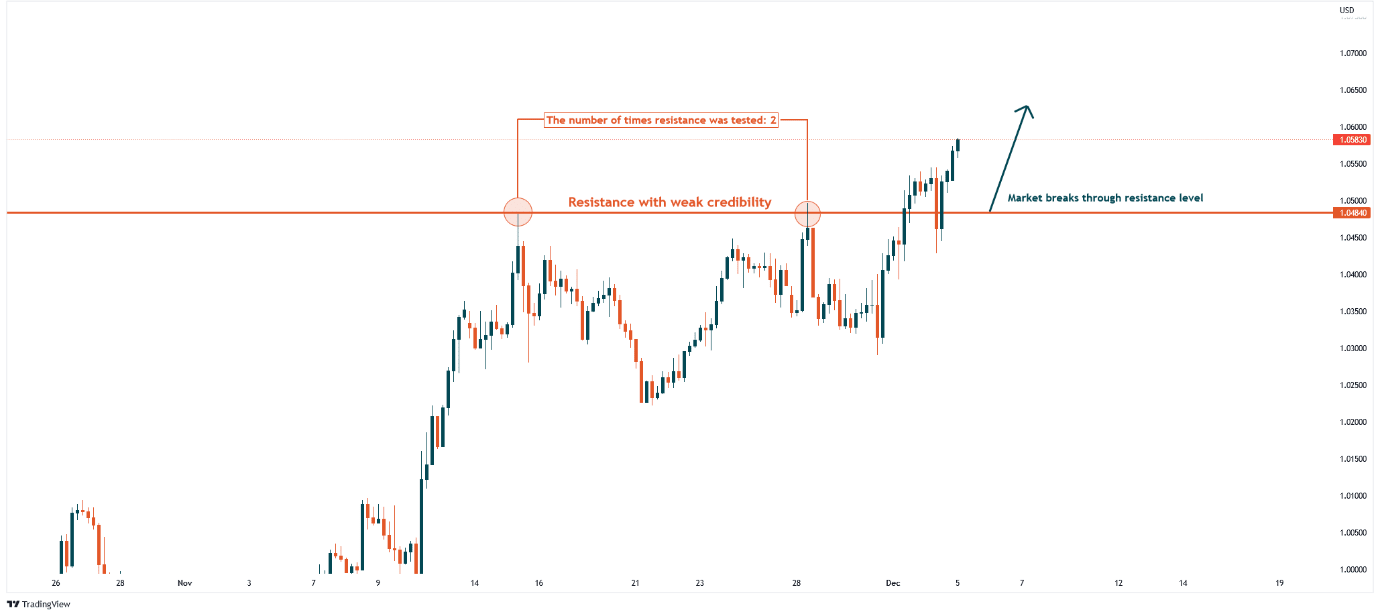
Weak resistance level tested only twice
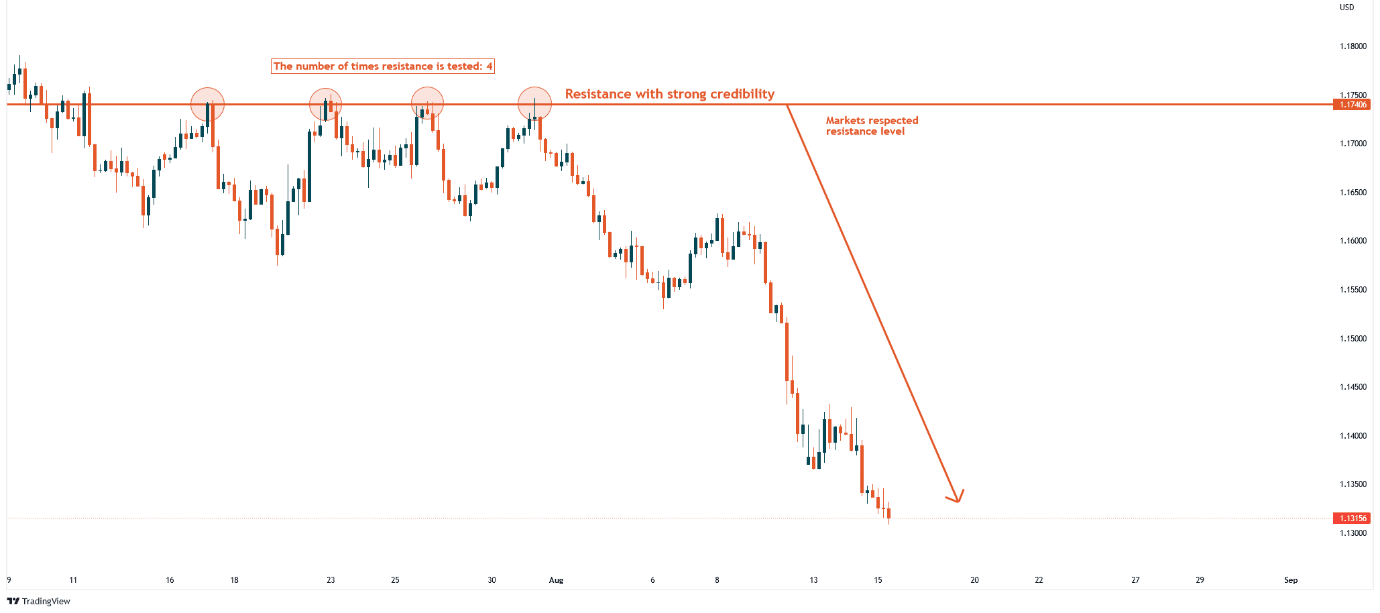
Strong resistance level tested four times
Similarly, resistance levels that have been tested multiple times gain strength. The image on the bottom shows a resistance level that has been tested four times, making it significantly more reliable than the level on the top that has only been tested twice.
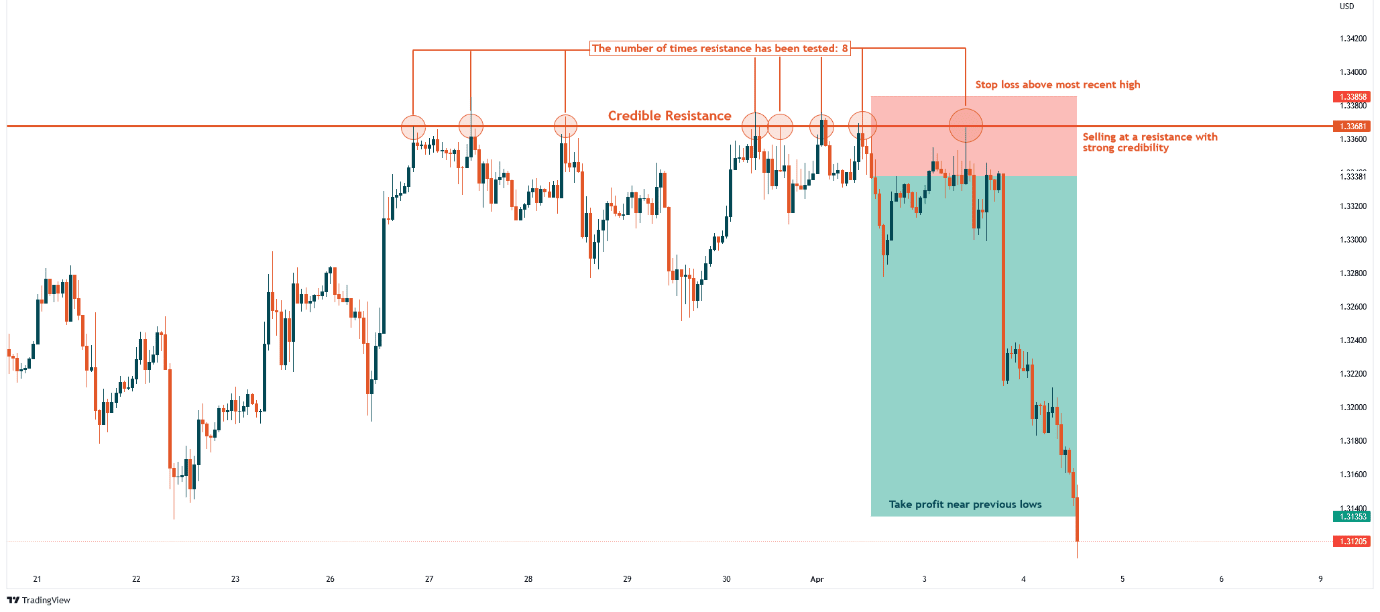
In extreme cases, levels that have been tested many times can become exceptionally strong. The example below shows a resistance level tested eight times, creating an extremely powerful technical level that would require significant momentum to break.
Other Factors Affecting Level Strength
Beyond the number of tests, several other factors influence the strength of support and resistance levels:
- Timeframe - Levels on higher timeframes (daily, weekly) typically carry more significance than those on lower timeframes
- Volume - Higher volume at a level indicates stronger participation and conviction
- Recency - More recent levels often have greater relevance than older ones
- Price Rejection Force - Sharp, decisive rejections from a level indicate stronger conviction than minor reactions
- Confluence - Levels that align with other technical factors (moving averages, Fibonacci levels, etc.) gain additional strength
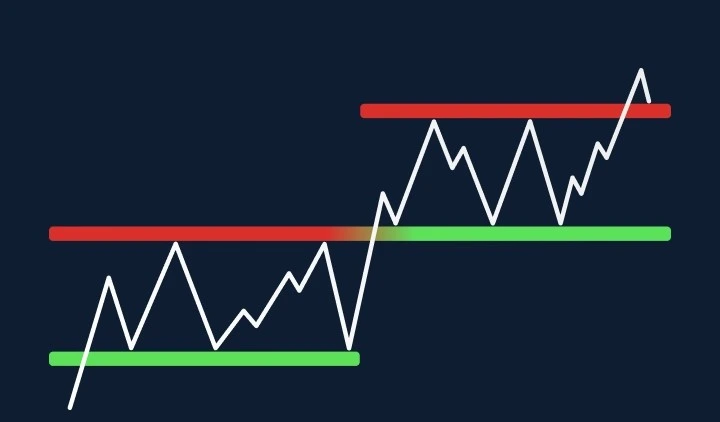
The Principle of Polarity: Role Reversal
One of the most powerful phenomena in technical analysis is the principle of polarity, often referred to as "role reversal." This principle states that once a support level is broken, it often becomes resistance, and once a resistance level is broken, it often becomes support.
Broken Support Becomes Resistance
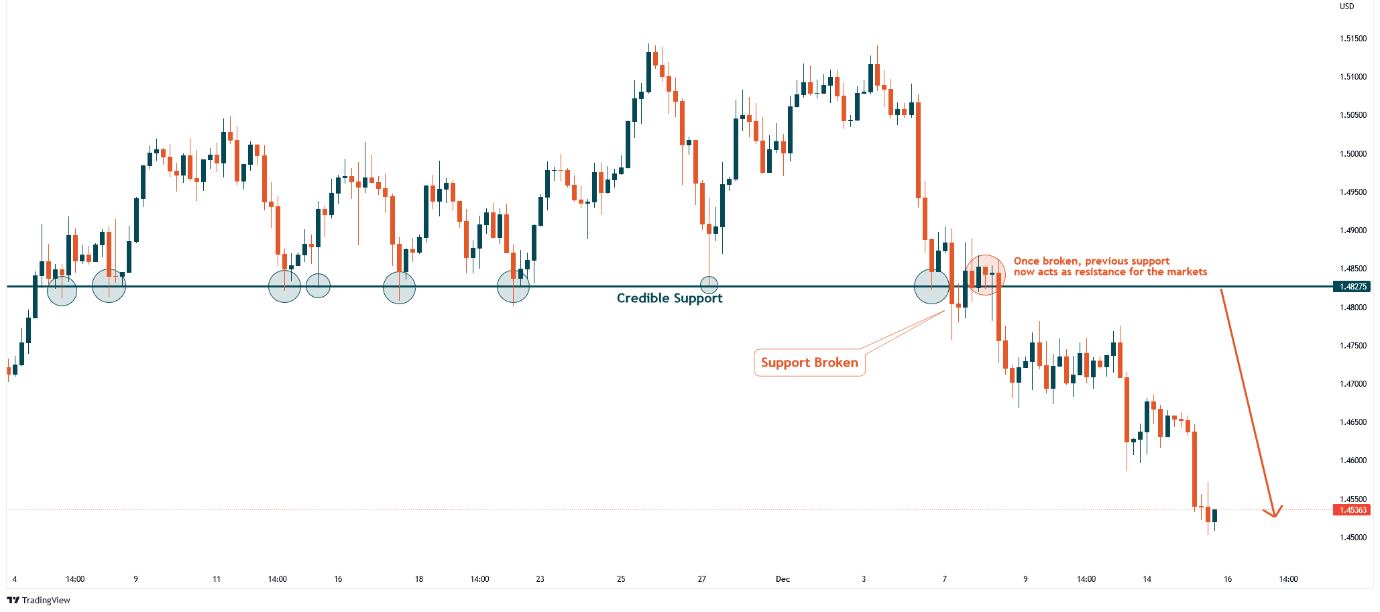
When price breaks below a support level, traders who bought at that level are now facing losses. If price later returns to this level from below, these traders often see it as an opportunity to exit their positions at breakeven, creating selling pressure. Additionally, new sellers enter the market at this level, perceiving it as a lower-risk opportunity to establish short positions. This collective selling pressure causes the former support to now act as resistance.
Broken Resistance Becomes Support
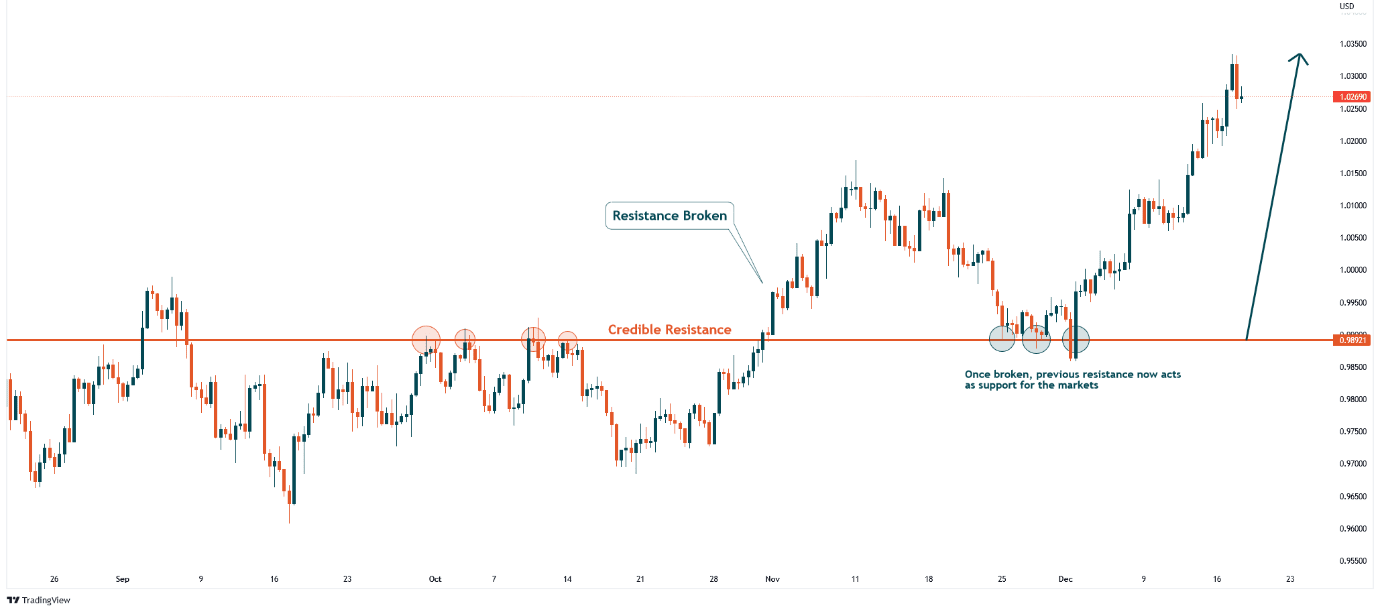
Conversely, when price breaks above a resistance level, traders who sold at that level are now facing losses. If price later returns to this level from above, these traders often cover their shorts to minimize losses, creating buying pressure. Additionally, new buyers enter the market, seeing the retest of the former resistance as a favorable entry point. This collective buying pressure causes the former resistance to now function as support.
This role reversal principle is one of the most reliable phenomena in technical analysis and forms the basis for many profitable trading strategies, particularly breakout-retest approaches.
How to Identify Support and Resistance Levels
There are several approaches to identifying support and resistance levels on price charts:
1. Historical Price Swings
- Identify significant swing highs (peaks) and swing lows (troughs) in price action
- Focus on levels where price has reversed multiple times
- Pay particular attention to sharp, decisive reversals with strong momentum
- Connect similar swing points to establish horizontal support/resistance zones
2. Psychological Round Numbers
- Watch for reactions at round price levels (e.g., 1.2000 in forex, $50 or $100 in stocks)
- The more zeros in the number, the more significant the psychological level
- These levels often create support/resistance due to the clustering of limit orders and psychological anchor points
3. Previous Gap Areas
- Price gaps (areas where the market jumps without trading) often form support/resistance zones
- These unfilled gaps represent areas of potential order imbalance that can affect future price action
4. High Volume Nodes
- Areas where significant trading volume has occurred often become support/resistance
- Use volume profile tools to identify price levels with historically high participation
- These zones represent levels where many market participants have established positions
5. Previous Market Structure Points
- Major breakout or breakdown points often become significant support/resistance on retests
- Areas where trends changed direction or consolidated before continuing
- Points where previous trend lines or channels were broken
Trading Strategies Using Support and Resistance
Support and resistance levels form the foundation for many trading strategies. Here are some of the most effective approaches:
1. Range Trading (Bounces)
- Strategy: Buy at support levels and sell at resistance levels in sideways markets
- Entry Signals: Look for rejection candles (pin bars, engulfing patterns) at these levels
- Stop-Loss: Place stops just beyond the support/resistance level being traded
- Target: The opposing support/resistance level of the range
- Best Used: In clearly defined trading ranges with established boundaries
2. Breakout Trading
- Strategy: Enter when price decisively breaks through support or resistance
- Entry Signals: Strong candle closes beyond the level, preferably with increased volume
- Stop-Loss: Place stops just inside the broken level
- Target: Measured moves (the height of the previous range projected from the breakout point)
- Best Used: When ranges have been established for extended periods before breaking
3. Role Reversal Trading (Retest Strategy)
- Strategy: Enter when price returns to a broken level and respects the new role
- Entry Signals: Rejection candles at the retest of the broken level
- Stop-Loss: Just beyond the retested level
- Target: Next significant support/resistance level in the direction of the trend
- Best Used: After confirmed breakouts with a clear retest of the broken level
4. Support/Resistance as Stop-Loss Placement
- Strategy: Use these levels to define your risk parameters
- Implementation: Place stops just beyond support when buying or just beyond resistance when selling
- Advantage: Aligns risk management with key technical levels
- Best Used: In conjunction with any trading strategy to define maximum risk
5. Multiple Timeframe Approach
- Strategy: Identify key levels on higher timeframes, enter on lower timeframe signals
- Implementation: Use daily/weekly charts to identify major levels, then use hourly/4-hour charts for precise entries
- Advantage: Combines the reliability of higher timeframe levels with better risk-reward on lower timeframes
- Best Used: By traders who want to maximize probability while optimizing entry points
Common Mistakes When Trading Support and Resistance
Despite their apparent simplicity, traders often make these common mistakes when trading support and resistance levels:
- Treating Levels as Exact Lines - Support and resistance are better viewed as zones rather than precise price points
- Ignoring Market Context - Not considering the broader trend or market conditions when trading these levels
- Overtrading Weak Levels - Trading every perceived level rather than focusing on the strongest, most well-defined ones
- Lack of Confirmation - Entering trades immediately when price reaches a level without waiting for confirmation signals
- Poor Stop Placement - Placing stops too close to support/resistance levels, risking being stopped out by normal price volatility
- Ignoring Timeframe Context - Not considering that higher timeframe levels typically override lower timeframe ones
- Failure to Adjust - Not recognizing when a level has been invalidated or needs to be redrawn
Advanced Support and Resistance Trading Strategies
1. The Institutional Order Flow Approach
Professional traders understand that significant support and resistance levels often correspond to areas where large institutional orders accumulate. These "liquidity pools" create strong price reactions due to the sheer volume of pending orders.
How to Identify Institutional Levels:
- • Look for areas where price has "swept" obvious highs or lows before reversing sharply
- • Identify levels where multiple timeframes align (daily support matching weekly resistance)
- • Watch for sudden volume spikes at key price levels
- • Monitor overnight gaps that get filled during regular trading hours
2. The Supply and Demand Zone Strategy
This advanced approach focuses on identifying specific areas where supply overwhelms demand (resistance) or demand overwhelms supply (support). Unlike traditional S/R analysis, this method emphasizes the origin of strong moves.
Supply Zone Identification:
- 1. Find a strong bearish move (supply injection)
- 2. Identify the consolidation area before this move
- 3. Mark this area as a supply zone
- 4. Watch for price to return to this zone for shorting opportunities
3. Market Structure Break Strategy
This strategy combines support/resistance analysis with market structure concepts from Smart Money Concepts (SMC). It focuses on how institutional traders create liquidity sweeps before reversing direction.
Key Components:
- Liquidity Sweep: Price briefly breaks S/R level to trigger stops
- Fair Value Gap (FVG): Imbalance created during the sweep
- Change of Character (CHoCH): Market structure shift at the level
- Retest Entry: Entry on return to the swept level
4. Algorithm-Based Support and Resistance
In today's electronic markets, many S/R levels are influenced by algorithmic trading systems. Understanding these patterns can provide an edge:
- VWAP Levels: Volume Weighted Average Price often acts as dynamic S/R
- Time-Based Levels: Specific times when algorithms activate (London open, NY open)
- Round Number Magnetism: How algorithms target psychological levels
- Fibonacci Cluster Zones: Where multiple Fib levels from different swings converge
Real-World Trading Examples and Case Studies
Case Study 1: EUR/USD Daily Support Level
Scenario Analysis:
Setup: EUR/USD approaches major daily support at 1.0500 level that held 4 times in the past 3 months.
- Confluence Factors: Level aligns with 61.8% Fibonacci retracement and 200-day MA
- Volume Analysis: Previous bounces showed 300%+ volume increase
- Time Factor: Approaching level during London session (high liquidity)
- Entry Strategy: Wait for bullish engulfing candle with stop below 1.0480
- Risk Management: 20-pip stop, 60-pip target (1:3 risk/reward)
- Outcome: 85% win rate over 20 similar setups
Case Study 2: Bitcoin Weekly Resistance Break
Breakout Strategy:
Setup: Bitcoin tests weekly resistance at $45,000 - a level that rejected price 6 times over 8 months.
- Volume Confirmation: Breakout occurred with 400% above average volume
- Close Confirmation: Weekly candle closed $1,200 above resistance
- Retest Setup: Price returned to $45,000 level after 3 days
- Entry Signal: Bullish hammer at retest with volume surge
- Target: Next major resistance at $52,000 (measured move)
- Management: Trailing stop using 20-period EMA on 4H chart
Support and Resistance in Different Market Conditions
Trending Markets
In strong trending markets, traditional horizontal S/R levels become less reliable. Instead, focus on:
- Dynamic S/R: Moving averages, especially 21, 50, and 200 EMAs
- Trend line breaks: Diagonal support in uptrends, resistance in downtrends
- Pullback levels: 38.2% and 61.8% Fibonacci retracements of the main trend
- Flag patterns: Brief consolidations that act as continuation patterns
Range-Bound Markets
In sideways markets, horizontal S/R levels are most effective:
- Range boundaries: Clear upper and lower limits of the range
- Mean reversion: Trading bounces between extremes
- Volume confirmation: Higher volume at range extremes
- Time decay: Longer ranges tend to produce stronger breakouts
Volatile Markets (High VIX Environments)
During high volatility periods, S/R analysis requires adjustments:
- Wider zones: Increase tolerance for "overshoots" and false breaks
- Volume emphasis: Require higher volume confirmation for valid breaks
- Multiple timeframes: Use higher timeframes for more reliable levels
- Risk adjustment: Smaller position sizes due to increased uncertainty
Technology and Tools for Modern S/R Analysis
Automated Level Detection
Modern trading platforms offer sophisticated tools for identifying S/R levels:
Essential Tools:
- Volume Profile: Identifies high-volume nodes that often become S/R
- Market Profile: Shows price distribution and value areas
- Pivot Points: Mathematical calculation of potential S/R levels
- Fibonacci Auto-Draw: Automatically draws retracement levels
- Support/Resistance Indicators: Algorithmic identification of key levels
PineScript for Custom S/R Detection
Advanced traders can create custom indicators to identify S/R levels automatically:
Basic S/R Level Detection Script:
//@version=5
indicator("Professional S/R Levels", overlay=true, max_boxes_count=500)

// Input parameters
lookback = input.int(20, "Lookback Period", minval=5)
strength = input.int(3, "Strength Requirement", minval=1)

// Pivot detection
ph = ta.pivothigh(high, lookback, lookback)
pl = ta.pivotlow(low, lookback, lookback)

// Draw support and resistance levels
if not na(ph)
    box.new(bar_index[lookback], ph, bar_index, ph,
             border_color=color.red, bgcolor=color.new(color.red, 90))

if not na(pl)
    box.new(bar_index[lookback], pl, bar_index, pl,
             border_color=color.green, bgcolor=color.new(color.green, 90))
Risk Management and Position Sizing with S/R Levels
The 1% Rule with S/R Levels
Professional risk management using support and resistance levels:
Position Sizing Formula:
Example: $10,000 account, 1% risk, buying at $100 with stop at $95 support level:
Position Size = 1% ÷ $5 × $10,000 = 20 shares maximum
Multiple Time Frame Risk Management
Use different timeframes for different aspects of trade management:
- Weekly/Daily: Identify major S/R levels for overall trade direction
- 4-Hour: Fine-tune entry points and initial stops
- 1-Hour: Monitor trade progress and adjust trailing stops
- 15-Minute: Execute precise entries and exits
Conclusion
Support and resistance represent the foundational building blocks of technical analysis and price action trading. These levels reflect the collective psychology of market participants and provide a framework for understanding where prices may stall, reverse, or break through.
By mastering the identification and trading of support and resistance levels, traders gain a powerful edge in the markets. These concepts work across all timeframes and markets because they tap into fundamental aspects of market psychology that remain consistent regardless of the specific instrument being traded.
Remember that while support and resistance analysis is powerful, it should ideally be combined with other forms of analysis and proper risk management for the best results. The most successful traders view these levels as probability zones rather than certainties, and they adapt their approach as market conditions evolve.