Signals & Overlays
Your complete market analysis toolbox in one powerful indicator
What is Signals & Overlays?
Signals & Overlays is a comprehensive trading tool designed to provide traders with a holistic view of market conditions. It combines multiple analysis techniques to offer insights into trend direction, potential reversal points, and optimal entry and exit levels. This versatile indicator integrates contrarian signals, reversal zones, smart trail, trend cloud, and trend analyzer features into a single tool, complemented by an informative dashboard for quick market assessment. With beginner-friendly presets that enable multiple features at once with just one click, it's suitable for various trading styles and timeframes.
What Does It Provide?
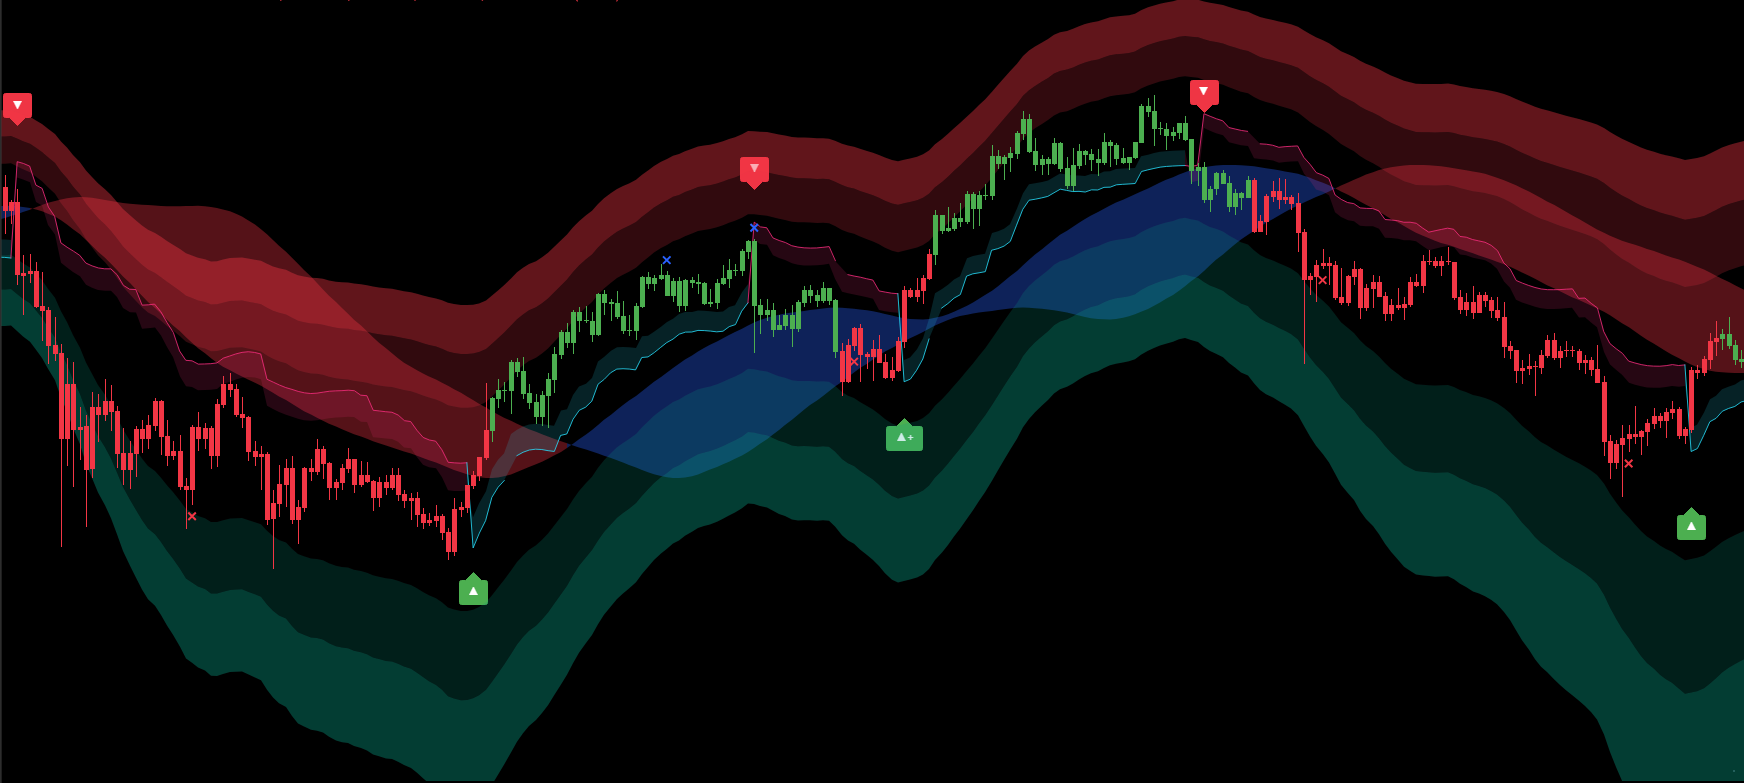
Contrarian Signals
Identify potential trend reversals and market turning points with clear arrow markers, based on a combination of price action, momentum, and volatility factors.
Reversal Zones
Visualize potential support and resistance areas calculated with statistical methods using Gaussian weights, providing dynamic zones where price reversals are more likely.
Smart Trail
Follow trends with an adaptive trailing stop mechanism that adjusts based on price action and volatility, helping optimize exit points and manage open positions.
Trend Cloud
Quickly assess market direction with intuitive colored clouds that visually represent bullish and bearish trends, generated using double-smoothed EMAs and volatility analysis.
How Does It Work?
Signals & Overlays combines multiple technical analysis methods to provide a comprehensive market view:
- Contrarian signals algorithms identify potential trend reversals based on price action, momentum, and volatility
- Reversal zones are computed using statistical methods with Gaussian weights to highlight potential support/resistance areas
- The Smart Trail feature adapts to market volatility, providing a dynamic trailing stop reference
- Trend Cloud utilizes double-smoothed EMAs applied to closing prices and the high-low range to visualize market direction
- The Trend Analyzer provides detailed trend analysis using customizable moving average systems
Who Is It For?
- •Trend traders who want to identify trend direction and optimal entry/exit points with the Trend Cloud and Smart Trail features
- •Reversal traders looking for high-probability turning points using Contrarian Signals and Reversal Zones
- •Multi-timeframe traders who need a versatile tool that works across different trading horizons
- •Beginners who benefit from the intuitive dashboard and one-click presets that simplify technical analysis
Additional Features
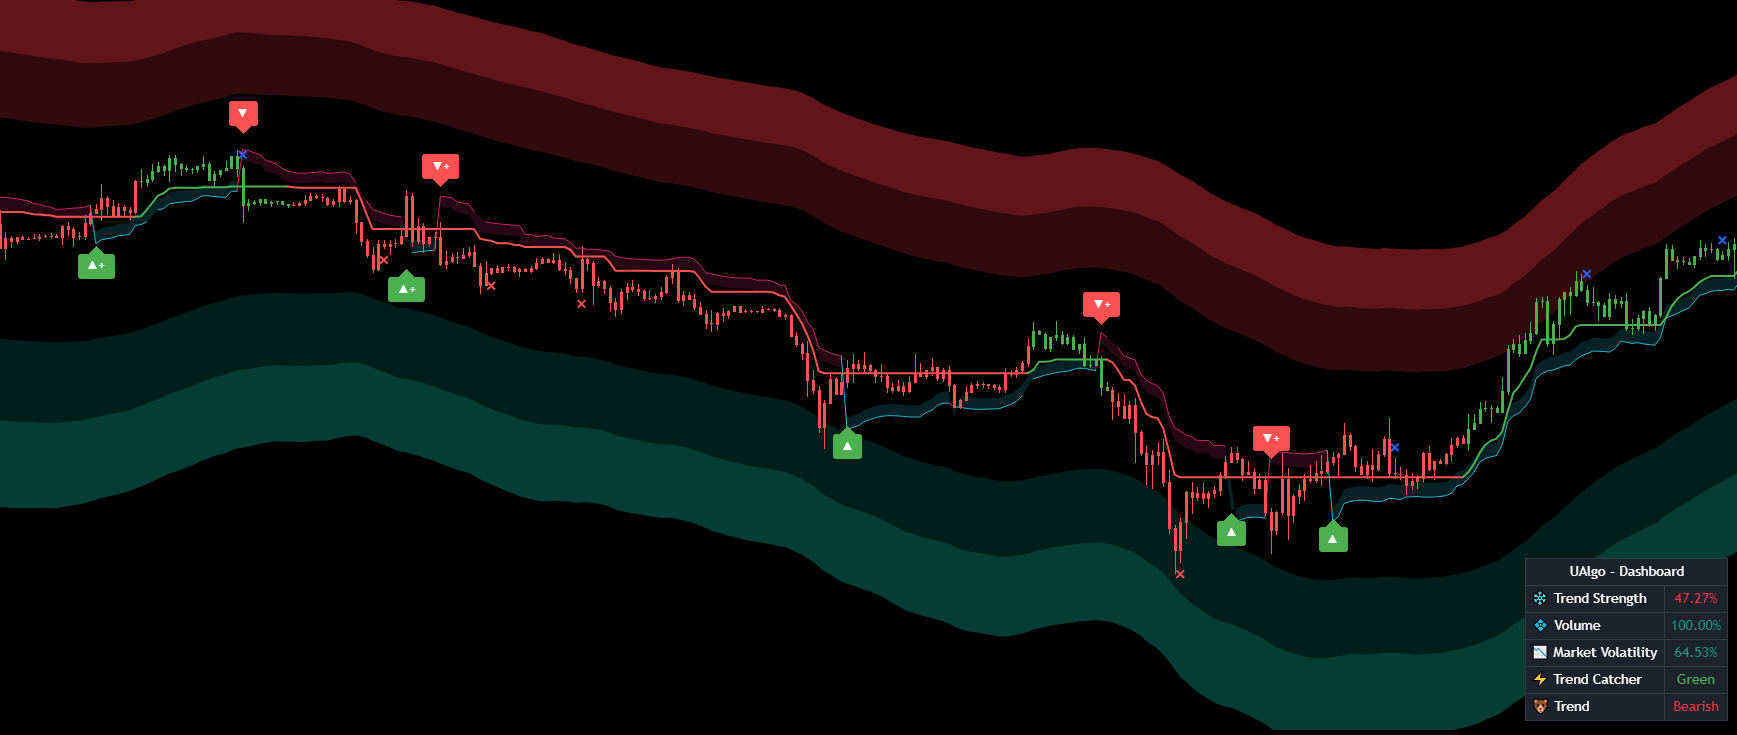
Trend Analyzer
Get in-depth analysis of market trends with a customizable moving average system that determines trend direction and strength across various timeframes.
TP/Exit/Entry Levels
Optimize trade management with calculated take profit, exit, and entry levels based on market structure and volatility, clearly marked on your chart.
Informative Dashboard
Get a quick overview of key market metrics including trend strength, volume analysis, volatility, and market bias (bullish/bearish) for informed decision-making.
Beginner-Friendly Presets
Quickly configure the indicator with one-click presets that enable multiple features at once, perfect for new traders or those who prefer a streamlined setup.
Complete Your Trading Arsenal
These indicators work perfectly alongside Signals & Overlays for a complete trading approach
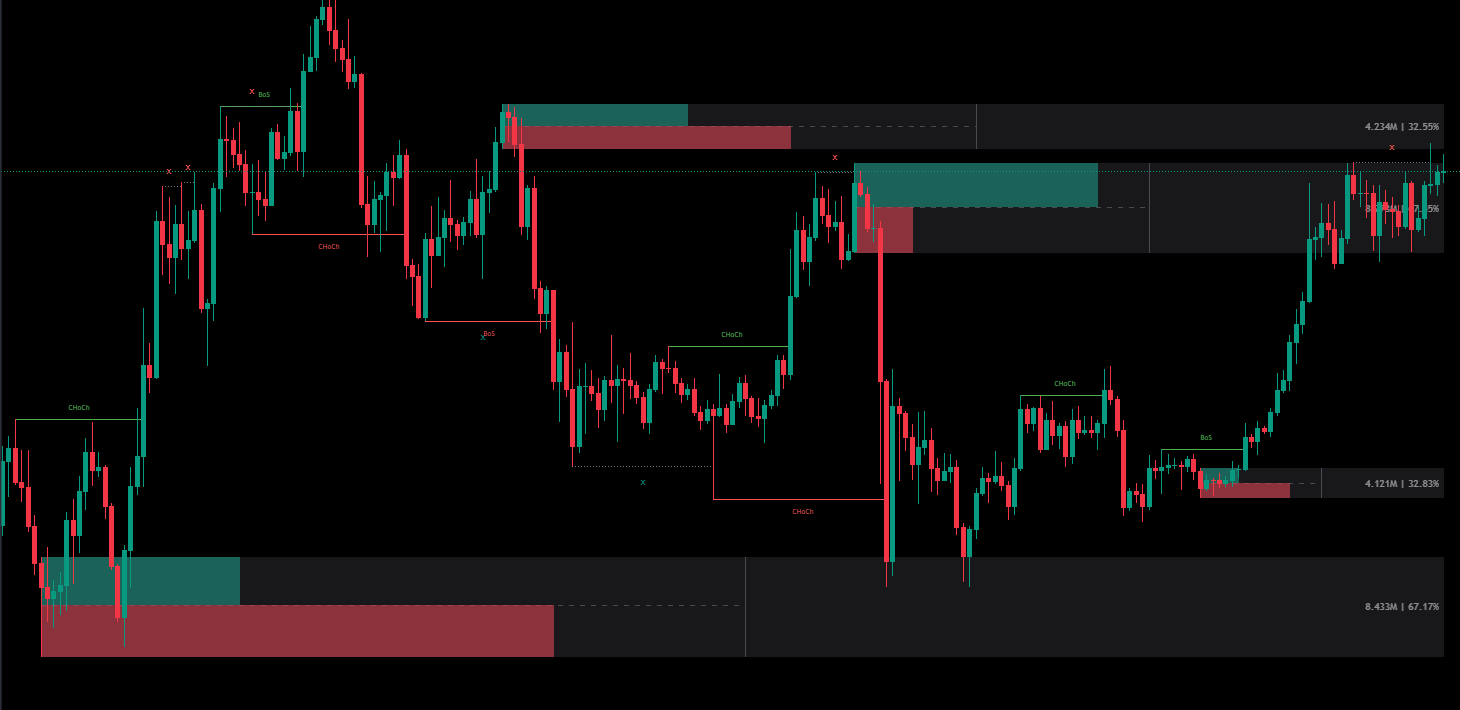
Smart Money Concepts
Advanced indicator for tracking institutional money flow and market structure with order blocks, imbalances and liquidity sweeps.
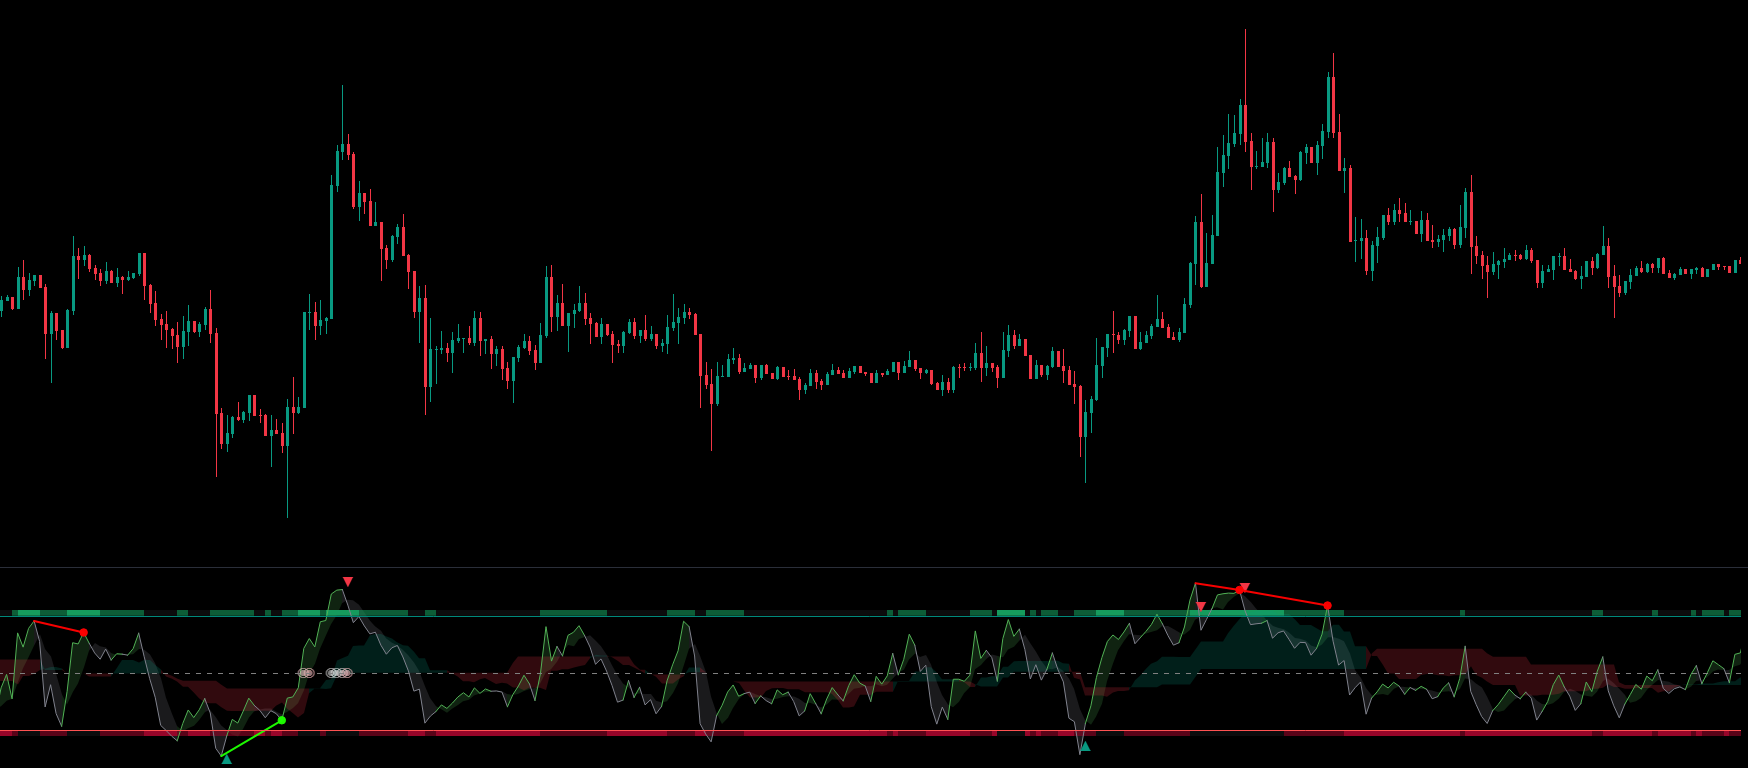
Premium Oscillator
Multi-dimensional technical analysis indicator with non-repainting signals for all markets including stocks, forex, crypto, commodities and indices.
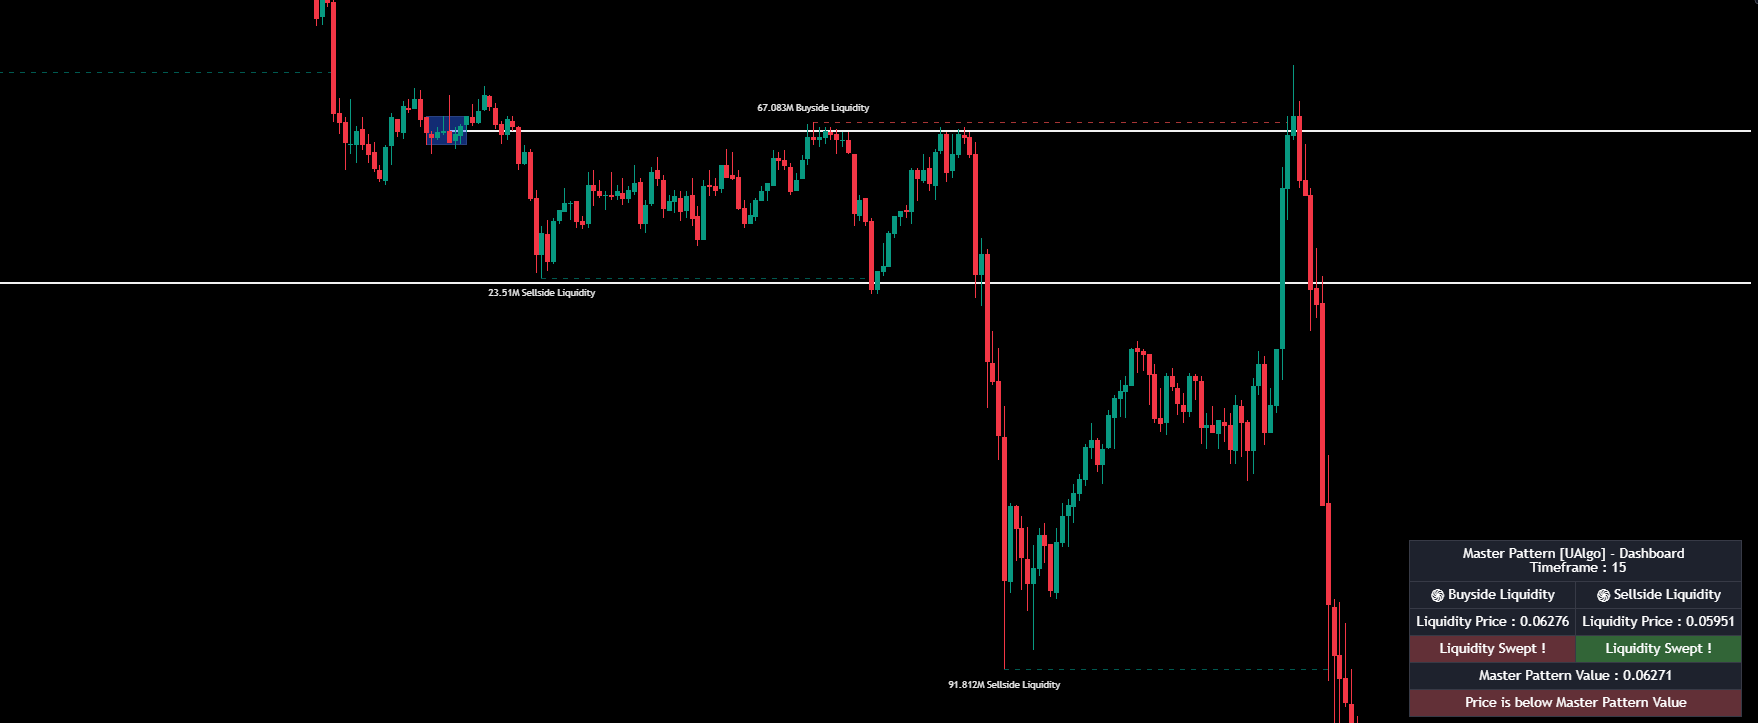
Master Pattern
The Master Pattern is an alternative form of technical analysis that provides a framework which will help you to find and follow the hidden price pattern that reveals the true intentions of financial markets.
Frequently Asked Questions
Does Signals & Overlays work on all timeframes?
Yes, Signals & Overlays is designed to work effectively across all timeframes from 1-minute to monthly charts. The indicator's features automatically adapt to the selected timeframe, providing relevant signals and analysis regardless of your trading horizon. Many traders find it particularly valuable to use the indicator on multiple timeframes simultaneously to confirm signals and identify high-probability setups.
Can the indicator send alerts to my mobile device?
Absolutely. Signals & Overlays fully supports TradingView's alert system, allowing you to receive notifications for various signal types including contrarian signals, reversal zone touches, and trend changes. These alerts can be delivered via mobile push notifications, email, or SMS depending on your TradingView subscription, ensuring you never miss important trading opportunities.
How accurate are the reversal zones for identifying potential price turns?
The reversal zones in Signals & Overlays are calculated using statistical methods with Gaussian weights, which helps filter out market noise and identify areas with a higher probability of price reaction. While no indicator can predict reversals with 100% accuracy, our users report that these zones provide reliable support and resistance areas, especially when confirmed with other features of the indicator such as contrarian signals or the trend analyzer.
Is this indicator suitable for beginners?
Yes, Signals & Overlays includes beginner-friendly presets that enable multiple features with a single click, making it accessible to traders of all experience levels. The intuitive dashboard provides clear market information without overwhelming complexity, and the visual nature of the trend cloud and reversal zones makes market analysis more intuitive. Additionally, we provide comprehensive documentation and support to help new traders get the most from the indicator.
Ready to Elevate Your Trading?
Join traders worldwide who use Signals & Overlays for comprehensive market analysis and higher-probability trades.
View Pricing Options